Back in January 2015, my good friend and fellow SQL Server MVP Rob Farley wrote about a novel solution to the problem of finding the median in SQL Server versions prior to 2012. As well as being an interesting read by itself, it turns out to be a great example to use to demonstrate some advanced execution plan analysis, and to highlight some subtle behaviours of the query optimizer and execution engine.
Single Median
Although Rob's article specifically targets a grouped median calculation, I am going to start by applying his method to a large single median calculation problem, because it highlights the important issues most clearly. The sample data will once again come from Aaron Bertrand's original article:
CREATE TABLE dbo.obj
(
    id  integer NOT NULL IDENTITY(1,1),
    val integer NOT NULL
);

INSERT dbo.obj WITH (TABLOCKX)
    (val)
SELECT TOP (10000000)
    AO.[object_id]
FROM sys.all_columns AS AC
CROSS JOIN sys.all_objects AS AO
CROSS JOIN sys.all_objects AS AO2
WHERE AO.[object_id] > 0
ORDER BY
    AC.[object_id];

CREATE UNIQUE CLUSTERED INDEX cx
ON dbo.obj(val, id);
Applying Rob Farley's technique to this problem gives the following code:
-- 5800ms
DECLARE @Start datetime2 = SYSUTCDATETIME();
DECLARE @Count bigint = 10000000
--(
--    SELECT COUNT_BIG(*)
--    FROM dbo.obj AS O
--);

SELECT
    Median = AVG(0E + f.val)
FROM
(
    SELECT TOP (2 - @Count % 2)
        t.val
    FROM
    (
        SELECT TOP (@Count / 2 + 1)
            z.val
        FROM dbo.obj AS z
        ORDER BY
            z.val ASC
    ) AS t
    ORDER BY
        t.val DESC
) AS f;

SELECT RF = DATEDIFF(MILLISECOND, @Start, SYSUTCDATETIME());
As usual, I have commented out counting the number of rows in the table and replaced it with a constant to avoid a source of performance variance. The execution plan for the important query is as follows:

This query runs for 5800ms on my test machine.
The Sort Spill
The primary cause of this poor performance should be clear from looking at the execution plan above: The warning on the Sort operator shows that an insufficient workspace memory grant caused a level 2 (multi-pass) spill to physical tempdb disk:
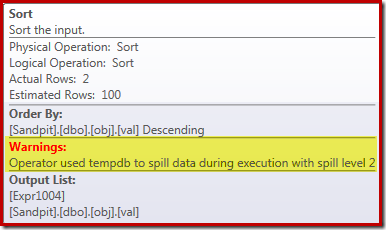
In versions of SQL Server before 2012, you would need to be separately monitoring for sort spill events to see this. Anyway, the insufficient sort memory reservation is caused by a cardinality estimation error, as the pre-execution (estimated) plan shows:

The 100-row cardinality estimate at the Sort input is a (wildly inaccurate) guess by the optimizer, due to the local variable expression in the preceding Top operator:
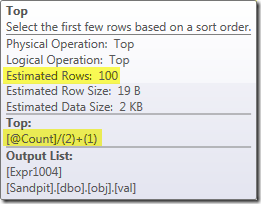
Note that this cardinality estimation error is not a row-goal problem. Applying trace flag 4138 will remove the row-goal effect below the first Top, but the post-Top estimate will still be a 100-row guess (so the memory reservation for the Sort will still be far too small):

Hinting the value of the local variable
There are several ways we could resolve this cardinality estimation problem. One option is to use a hint to provide the optimizer with information about the value held in the variable:
-- 3250ms
DECLARE @Start datetime2 = SYSUTCDATETIME();
DECLARE @Count bigint = 10000000
--(
--    SELECT COUNT_BIG(*)
--    FROM dbo.obj AS O
--);

SELECT
    Median = AVG(0E + f.val)
FROM
(
    SELECT TOP (2 - @Count % 2)
        t.val
    FROM
    (
        SELECT TOP (@Count / 2 + 1)
            z.val
        FROM dbo.obj AS z
        ORDER BY
            z.val ASC
    ) AS t
    ORDER BY
        t.val DESC
) AS f
OPTION (MAXDOP 1, OPTIMIZE FOR (@Count = 11000000)); -- NEW!

SELECT RF = DATEDIFF(MILLISECOND, @Start, SYSUTCDATETIME());
Using the hint improves performance to 3250ms from 5800ms. The post-execution plan shows that the sort no longer spills:

There are a couple of downsides to this though. First, this new execution plan requires a 388MB memory grant – memory which could otherwise be used by the server to cache plans, indexes, and data:
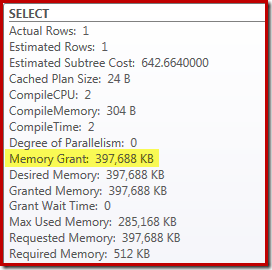
Second, it can be difficult to choose a good number for the hint that will work well for all future executions, without reserving memory unnecessarily.
Notice also that we had to hint a value for the variable that is 10% higher than the actual value of the variable to eliminate the spill completely. This is not uncommon, because the general sorting algorithm is rather more complex than a simple in-place sort. Reserving memory equal to the size of the set to be sorted will not always (or even generally) be enough to avoid a spill at runtime.
Embedding and Recompiling
Another option is to take advantage of the Parameter Embedding Optimization enabled by adding a query-level recompilation hint on SQL Server 2008 SP1 CU5 or later. This action will allow the optimizer to see the runtime value of the variable, and optimize accordingly:
-- 3150ms
DECLARE @Start datetime2 = SYSUTCDATETIME();
DECLARE @Count bigint = 10000000
--(
--    SELECT COUNT_BIG(*)
--    FROM dbo.obj AS O
--);

SELECT
    Median = AVG(0E + f.val)
FROM
(
    SELECT TOP (2 - @Count % 2)
        t.val
    FROM
    (
        SELECT TOP (@Count / 2 + 1)
            z.val
        FROM dbo.obj AS z
        ORDER BY
            z.val ASC
    ) AS t
    ORDER BY
        t.val DESC
) AS f
OPTION (MAXDOP 1, RECOMPILE);

SELECT RF = DATEDIFF(MILLISECOND, @Start, SYSUTCDATETIME());
This improves execution time to 3150ms – 100ms better than using the OPTIMIZE FOR hint. The reason for this further small improvement can be discerned from the new post-execution plan:

The expression (2 – @Count % 2) – as seen previously in the second Top operator – can now be folded down to a single known value. A post-optimization rewrite can then combine the Top with the Sort, resulting in a single Top N Sort. This rewrite was not previously possible because collapsing Top + Sort into a Top N Sort only works with a constant literal Top value (not variables or parameters).
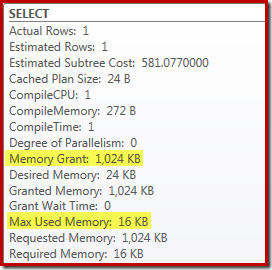
Replacing the Top and Sort with a Top N Sort has a small beneficial effect on performance (100ms here), but it also almost entirely eliminates the memory requirement, because a Top N Sort only has to keep track of the N highest (or lowest) rows, rather than the whole set. As a result of this change in algorithm, the post-execution plan for this query shows that the minimum 1MB memory was reserved for the Top N Sort in this plan, and only 16KB was used at runtime (remember, the full-sort plan required 388MB):
Avoiding Recompilation
The (obvious) drawback of using the recompile query hint is that it requires a full compilation on every execution. In this case, the overhead is pretty small – around 1ms of CPU time and 272KB of memory. Even so, there is a way to tweak the query such that we get the benefits of a Top N Sort without using any hints, and without recompiling.
The idea comes from recognising that a maximum of two rows will be required for the final median calculation. It might be one row, or it might be two at runtime, but it can never be more. This insight means we can add a logically-redundant Top (2) intermediate step to the query as follows:
-- 3150ms
DECLARE @Start datetime2 = SYSUTCDATETIME();
DECLARE @Count bigint = 10000000
--(
--    SELECT COUNT_BIG(*)
--    FROM dbo.obj AS O
--);

SELECT
    Median = AVG(0E + f.val)
FROM
(
    SELECT TOP (2 - @Count % 2)
        t.val
    FROM
    (
        SELECT TOP (2) -- NEW!
            z.val
        FROM
        (
            SELECT TOP (@Count / 2 + 1)
                z.val
            FROM dbo.obj AS z
            ORDER BY
                z.val ASC
        ) AS z
        ORDER BY z.val DESC
    ) AS t
    ORDER BY
        t.val DESC
) AS f
OPTION (MAXDOP 1);

SELECT RF = DATEDIFF(MILLISECOND, @Start, SYSUTCDATETIME());
The new Top (with the all-important constant literal) means the final execution plan features the desired Top N Sort operator without recompiling:

The performance of this execution plan is unchanged from the recompile-hinted version at 3150ms and the memory requirement is the same. Note though that the lack of parameter embedding means the cardinality estimates below the sort are 100-row guesses (though that does not affect performance here).
The main takeaway at this stage is that if you want a low-memory Top N Sort, you have to use a constant literal, or enable the optimizer to see a literal via the parameter embedding optimization.
The Compute Scalar
Eliminating the 388MB memory grant (while also making a 100ms performance improvement) is certainly worthwhile, but there is a much bigger performance win available. The unlikely target of this final improvement is the Compute Scalar just above the Clustered Index Scan.
This Compute Scalar relates to the expression (0E + f.val) contained in the AVG aggregate in the query. In case that looks weird to you, this is a fairly common query-writing trick (like multiplying by 1.0) to avoid integer arithmetic in the average calculation, but it has some very important side-effects.
There is a particular sequence of events here that we need to follow step by step.
First, notice that 0E is a constant literal zero, with a float data type. In order to add this to the integer column val, the query processor must convert the column from integer to float (in accordance with the data type precedence rules). A similar sort of conversion would be necessary had we chosen to multiply the column by 1.0 (a literal with an implicit numeric data type). The important point is that this routine trick introduces an expression.
Now, SQL Server generally tries to push expressions down the plan tree as far as possible during compilation and optimization. This is done for several reasons, including to make matching expressions with computed columns easier, and to facilitate simplifications using constraint information. This push-down policy explains why the Compute Scalar appears much closer to the leaf level of the plan than the original textual position of the expression in the query would suggest.
A risk of performing this push-down is that the expression might end up being computed more times than necessary. Most plans feature a reducing row count as we move up the plan tree, due to the effect of joins, aggregation, and filters. Pushing expressions down the tree therefore risks evaluating those expressions more times (i.e. on more rows) than necessary.
To mitigate this, SQL Server 2005 introduced an optimization whereby Compute Scalars may simply define an expression, with the work of actually evaluating the expression deferred until a later operator in the plan requires the result. When this optimization works as intended, the effect is to gain all the benefits of pushing expressions down the tree, while still only actually evaluating the expression as many times as actually needed.
What all this Compute Scalar stuff means
In our running example, the 0E + val expression was originally associated with the AVG aggregate, so we might expect to see it at (or slightly after) the Stream Aggregate. However, this expression was pushed down the tree to become a new Compute Scalar just after the scan, with the expression labelled as [Expr1004].
Looking at the execution plan, we can see that [Expr1004] is referenced by the Stream Aggregate (Plan Explorer Expressions Tab extract shown below):

All things being equal, evaluation of expression [Expr1004] would be deferred until the aggregate needs those values for the sum part of the average calculation. Since the aggregate can only ever possibly encounter one or two rows, this should result in [Expr1004] being evaluated only once or twice:

Unfortunately, this is not quite how it works out here. The problem is the blocking Sort operator:
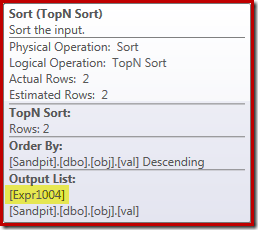
This forces evaluation of [Expr1004], so instead of it being evaluated just once or twice at the Stream Aggregate, the Sort means we end up converting the val column to a float and adding zero to it 5,000,001 times!
A workaround
Ideally, SQL Server would be a bit smarter about all this, but that is not how it works today. There is no query hint to prevent expressions being pushed down the plan tree, and we cannot force Compute Scalars with a Plan Guide either. There is, inevitably, an undocumented trace flag, but it is not one I can responsibly talk about in the present context.
So, for better or worse, this leaves us with trying to find a query rewrite that happens to prevent SQL Server separating the expression from the aggregate and pushing it down past the Sort, without changing the result of the query. This is not as easy as you might think, but the (admittedly slightly odd-looking) modification below achieves this using a CASE expression on a non-deterministic intrinsic function:
-- 2150ms
DECLARE @Start datetime2 = SYSUTCDATETIME();
DECLARE @Count bigint = 10000000
--(
--    SELECT COUNT_BIG(*)
--    FROM dbo.obj AS O
--);

SELECT
    -- NEW!
    Median = AVG(CASE WHEN GETDATE() >= {D '1753-01-01'} THEN 0E + f.val END)
FROM
(
    SELECT TOP (2 - @Count % 2)
        t.val
    FROM
    (
        SELECT TOP (2)
            z.val
        FROM
        (
            SELECT TOP (@Count / 2 + 1)
                z.val
            FROM dbo.obj AS z
            ORDER BY
                z.val ASC
        ) AS z
        ORDER BY z.val DESC
    ) AS t
    ORDER BY
        t.val DESC
) AS f
OPTION (MAXDOP 1);

SELECT RF = DATEDIFF(MILLISECOND, @Start, SYSUTCDATETIME());
The execution plan for this final form of the query is shown below:

Notice that a Compute Scalar no longer appears between the Clustered Index Scan and the Top. The 0E + val expression is now computed at the Stream Aggregate on a maximum of two rows (rather than five million!) and performance increases by a further 32% from 3150ms to 2150ms as a result.
This still does not compare that well with the sub-second performance of the OFFSET and dynamic cursor median-calculation solutions, but it still represents a very significant improvement over the original 5800ms for this method on a large single-median problem set.
The CASE trick is not guaranteed to work in future, of course. The takeaway is not so much about using weird case expression tricks, as it is about the potential performance implications of Compute Scalars. Once you know about this sort of thing, you might think twice before multiplying by 1.0 or adding float zero inside an average calculation.
Update: please see the first comment for a nice workaround by Robert Heinig that does not require any undocumented trickery. Something to bear in mind when you're next tempted to multiply an integer by decimal (or float) one in an average aggregate.
Grouped Median
For completeness, and to tie this analysis more closely back to Rob's original article, we will finish up by applying the same improvements to a grouped median calculation. The smaller set sizes (per group) mean the effects will be smaller, of course.
The grouped median sample data (again as originally created by Aaron Bertrand) comprises ten thousand rows for each of one hundred imaginary sales people:
CREATE TABLE dbo.Sales
(
    SalesPerson integer NOT NULL,
    Amount integer NOT NULL
);

WITH X AS
(
    SELECT TOP (100)
        V.number
    FROM master.dbo.spt_values AS V
    GROUP BY
        V.number
)
INSERT dbo.Sales WITH (TABLOCKX)
(
    SalesPerson,
    Amount
)
SELECT
    X.number,
    ABS(CHECKSUM(NEWID())) % 99
FROM X
CROSS JOIN X AS X2
CROSS JOIN X AS X3;

CREATE CLUSTERED INDEX cx
ON dbo.Sales
    (SalesPerson, Amount);
Applying Rob Farley's solution directly gives the following code, which executes in 560ms on my machine.
-- 560ms Original
DECLARE @s datetime2 = SYSUTCDATETIME();

SELECT
    d.SalesPerson,
    w.Median
FROM
(
    SELECT S.SalesPerson, COUNT_BIG(*) AS y
    FROM dbo.Sales AS S
    GROUP BY S.SalesPerson
) AS d
CROSS APPLY
(
    SELECT AVG(0E + f.Amount)
    FROM
    (
        SELECT TOP (2 - d.y % 2)
            t.Amount
        FROM
        (
            SELECT TOP (d.y / 2 + 1)
                z.Amount
            FROM dbo.Sales AS z
            WHERE z.SalesPerson = d.SalesPerson
            ORDER BY z.Amount ASC
        ) AS t
        ORDER BY t.Amount DESC
    ) AS f
) AS w (Median)
OPTION (MAXDOP 1);

SELECT DATEDIFF(MILLISECOND, @s, SYSUTCDATETIME());
The execution plan has obvious similarities to the single median:

Our first improvement is to replace the Sort with a Top N Sort, by adding an explicit Top (2). This improves execution time slightly from 560ms to 550ms.
-- 550ms
DECLARE @s datetime2 = SYSUTCDATETIME();

SELECT
    d.SalesPerson,
    w.Median
FROM
(
    SELECT S.SalesPerson, COUNT_BIG(*) AS y
    FROM dbo.Sales AS S
    GROUP BY S.SalesPerson
) AS d
CROSS APPLY
(
    SELECT AVG(0E + f.Amount)
    FROM
    (
        SELECT TOP (2 - d.y % 2)
            q.Amount
        FROM
        (
            -- NEW!
            SELECT TOP (2) t.Amount
            FROM
            (
                SELECT TOP (d.y / 2 + 1)
                    z.Amount
                FROM dbo.Sales AS z
                WHERE z.SalesPerson = d.SalesPerson
                ORDER BY z.Amount ASC
            ) AS t
            ORDER BY t.Amount DESC
        ) AS q
        ORDER BY q.Amount DESC
    ) AS f
) AS w (Median)
OPTION (MAXDOP 1);

SELECT DATEDIFF(MILLISECOND, @s, SYSUTCDATETIME());
The execution plan shows the Top N Sort as expected:

Finally, we deploy the odd-looking CASE expression to remove the pushed Compute Scalar expression. This further improves performance to 450ms (a 20% improvement over the original):
-- 450ms
DECLARE @s datetime2 = SYSUTCDATETIME();

SELECT
    d.SalesPerson,
    w.Median
FROM
(
    SELECT S.SalesPerson, COUNT_BIG(*) AS y
    FROM dbo.Sales AS S
    GROUP BY S.SalesPerson
) AS d
CROSS APPLY
(
    -- NEW!
    SELECT AVG(CASE WHEN GETDATE() >= {D '1753-01-01'} THEN 0E + Amount END)
    FROM
    (
        SELECT TOP (2 - d.y % 2)
            q.Amount
        FROM
        (
            SELECT TOP (2) t.Amount
            FROM
            (
                SELECT TOP (d.y / 2 + 1)
                    z.Amount
                FROM dbo.Sales AS z
                WHERE z.SalesPerson = d.SalesPerson
                ORDER BY z.Amount ASC
            ) AS t
            ORDER BY t.Amount DESC
        ) AS q
        ORDER BY q.Amount DESC
    ) AS f
) AS w (Median)
OPTION (MAXDOP 1);

SELECT DATEDIFF(MILLISECOND, @s, SYSUTCDATETIME());
The finished execution plan is as follows:


Ahem…
DECLARE @Start datetime2 = SYSUTCDATETIME();
DECLARE @Count bigint = 10000000
--(
--    SELECT COUNT_BIG(*)
--    FROM dbo.obj AS O
--);

SELECT Median = CASE @Count % 2 WHEN 0 THEN x.S * 0.5E ELSE x.S END
FROM (
        SELECT
                S = SUM(f.val)
        FROM
        (
                SELECT TOP (2 - @Count % 2)
                        t.val
                FROM
                (
                        SELECT TOP (2) -- NEW!
                                z.val
                        FROM
                        (
                                SELECT TOP (@Count / 2 + 1)
                                        z.val
                                FROM dbo.obj AS z
                                ORDER BY
                                        z.val ASC
                        ) AS z
                        ORDER BY z.val DESC
                ) AS t
                ORDER BY
                        t.val DESC
        ) AS f
) AS x
OPTION (MAXDOP 1);

SELECT RF = DATEDIFF(MILLISECOND, @Start, SYSUTCDATETIME());
Checked on 11.0.5623: No non-deterministic trick, late conversion, almost readable, on my dev box 2656ms compared to 2656 for the getdate() solution… I must be not getting something, improving on Paul White should be impossible.
Very nice, Robert, thanks. And no, it's rarely impossible to improve my T-SQL: I hope to write about interesting internals and execution plan features, but I know for sure other people write better T-SQL than me :) Anyway, I trust you found rest of the article useful.