“Waitstats helps us identify performance-related counters. But waits information by itself isn't enough to accurately diagnose performance problems. The queues component of our methodology comes from Performance Monitor counters, which provide a view of system performance from a resource standpoint.”Tom Davidson, Opening Microsoft's Performance-Tuning Toolbox
SQL Server Pro Magazine, December 2003
Waits and Queues has been used as a SQL Server performance tuning methodology since Tom Davidson published the above article as well as the well-known SQL Server 2005 Waits and Queues whitepaper in 2006. When applied in combination with resource metrics, waits can be valuable for assessing certain performance characteristics of the workload and aid in steering tuning efforts. Waits data is surfaced by many SQL Server performance monitoring solutions, and I’ve been an advocate of tuning using this methodology since the beginning. The approach was influential in the design of the SQL Sentry performance dashboard, which presents waits flanked by queues (key resource metrics) to deliver a comprehensive view of server performance.
However, some seem to have missed Davidson’s point regarding the importance of resources and rely almost entirely on waits to present a picture of query performance and system health. Wait stats come directly from the SQL Server engine and are easy to consume and categorize. Waiting queries mean waiting applications and users, and no one likes to wait! It is easier to evangelize tuning with waits as the singular solution for making queries and applications faster than it is to tell the full story, which is more involved.
Unfortunately, a waits-focused approach to the exclusion of resource analysis can mislead, and worst-case leave you flying blind. SentryOne team members Kevin Kline and Steve Wright have previously touched on this here and here. In this post I’m going to take a deeper dive into some recent research made possible by Query Store that has shed new light on how deficient waits-exclusive tuning can truly be.
The Top Queries That Weren’t
Recently, a SentryOne customer contacted me about performance concerns with their SentryOne database. There is a single SQL Server database at the heart of every SentryOne monitoring environment, and this customer was monitoring around 600 servers with our software. At that scale it’s not unusual to see the occasional query performance issue and do a little tuning, and some supposedly new queries in the workload were the source of their concern.
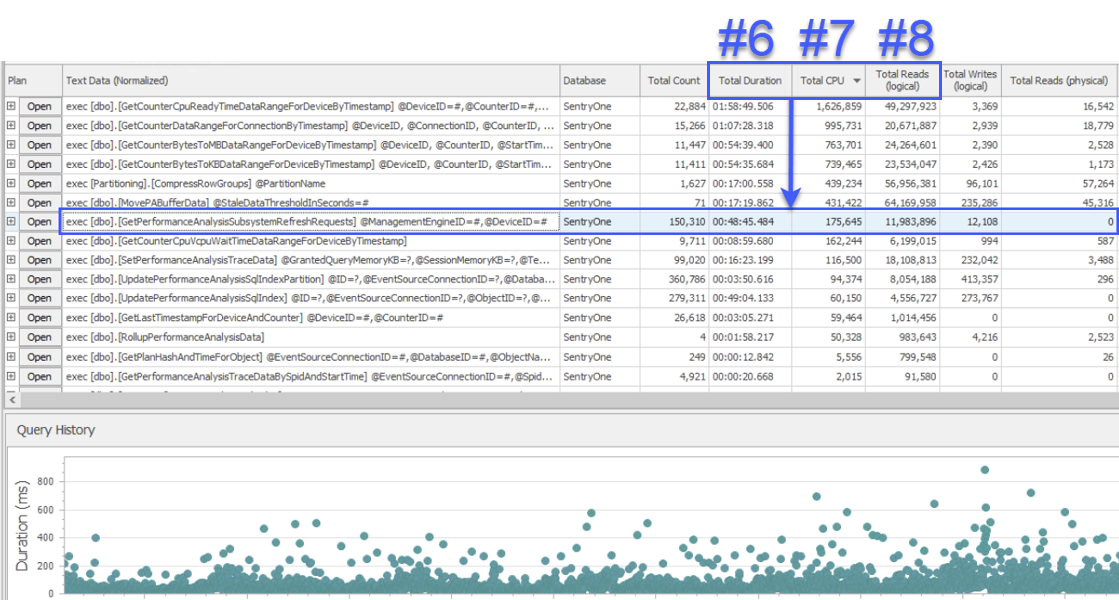
I joined in a screen-share session to have a look, and the customer first presented me with data from a different system that was also monitoring the SentryOne database. The system used a query-level waits approach and showed two stored procedures as responsible for approximately half of the waits on the SQL Sentry database server. This was unusual because these two procedures always run very quickly and have never been indicative of a real performance problem in our database. Puzzled, I switched over to SQL Sentry to see what it would show us, and was surprised to see that over the same interval the #1 procedure in the other system was #6, #7 and #8 in terms of total duration, CPU and logical reads respectively:
From a resource consumption standpoint, this meant that the queries above it represented 75% of total duration, 87% of total CPU, and 88% of logical reads. Moreover, the #2 procedure in the other system wasn’t even in the top 30 in SQL Sentry, by any measure! These two queries were far from the top 2, and the queries that accounted for most of the actual consumption on the system were being severely underrepresented.
I had always assumed that there was a stronger correlation between the top waiters and top resource consumers but had never performed a direct query-level comparison like this, so these results were surprising to say the least. My interest piqued, I decided to investigate to determine whether this situation was typical or anomalous.
Query Store 2017 to the Rescue
In SQL Server 2017 and above, Query Store captures query-level waits in addition to query resource consumption. Erin Stellato did a great post on Query Store waits here. It is lower overhead and more accurate than querying waits DMVs every second hoping to catch queries in-flight, the standard approach used by other tools including the aforementioned one.
SQL Sentry has always captured waits but at the SQL Server instance level, due to these concerns about overhead and accuracy. Detailed query waits are available on demand via integrated Plan Explorer, and we are evaluating augmenting instance-level waits with query-level data from Query Store, when available.
For this endeavor I enlisted the help of the SentryOne Product Advisory Council, a group of SentryOne customers, partners, and friends in the industry who participate in a private Slack channel. I shared this script to dump the previous 8 hours of data from Query Store and received results back for 11 production servers across multiple verticals including financial services, game publishing, fitness tracking and insurance.
Query Store wait categories are documented here. All categories were included in the analysis except for these, which were removed for the reasons cited:
- Parallelism – It can wildly inflate a query’s wait time well past its actual duration since multiple threads can throw off the associated waits, confounding correlation with duration and other metrics. Further, although the CXPACKET/CXCONSUMER split is helpful, CXPACKET still only means that you have parallelism and isn’t necessarily problematic or actionable.
- CPU – Signal wait time can be helpful for ascertaining CPU bottlenecks via correlation with resource waits, but Query Store currently includes only SOS_SCHEDULER_YIELD in this category, which is not a wait in the traditional sense as covered here. It doesn’t lend itself to easy comparison or correlation, especially when SQL Server is on a VM that lives on an over-subscribed host. For example, on one server Query Store CPU waits were 227% of total CPU time across all queries without any parallelism, which should not be possible.
- User Wait and Idle – These categories are comprised exclusively of timer and queue waits and were excluded for the same reason one should always exclude these types – they are innocuous and only create noise.
As an aside, I recently spoke with the father of Query Store, Conor Cunningham, about the likelihood of future changes to the Query Store wait types and categories and he indicated that it was certainly possible… so we’ll need to keep an eye on it.
Analysis Results TL;DR
After extensive analysis, I’ve confirmed that the results observed on the customer system are not anomalous, but rather commonplace. This means that if you are dependent on a waits-focused tool for monitoring and tuning your workloads, there’s a high likelihood that you are focusing on the wrong queries and missing those responsible for most of the query duration and resource consumption on a system. Since CPU and IO consumption translate directly to server hardware and cloud spend, this is significant.
Most Queries Don’t Wait
An interesting and important finding that I will cover first is that most queries don’t generate any waits at all. Out of 56,438 total queries across all servers, only 9,781 (17%) had any wait time, and only 8,092 (14%) had wait time from significant types. If you are using waits alone to determine which queries to optimize, you will miss most queries in the workload.
Correlating Waits and Resources
I analyzed how waits relate to resource consumption by ranking all queries on each system by waits and resources and using the ranks to calculate a Spearman’s correlation. What we are ultimately trying to determine is whether the top waiters tend to be the top consumers. As it turns out, they do not.
Table 1 shows the color-scaled correlation coefficients for average query wait time to other measures – a value of 1.00 (dark blue) represents data that is perfectly correlated. As you can see, the correlation with waits and other measures across most of the servers is not strong, and for one server there is a negative correlation with most measures.
 Table 1: Correlation with Avg Query Wait Time (ms)
Query duration is often a primary concern for DBAs and developers since it translates directly to the user experience, and Table 2 shows the correlation between average query duration and the other measures. The correlation with duration and the two primary resource measures, CPU and logical reads, is quite strong at .97 and .75 respectively.
 Table 2: Correlation with Avg Query Duration (ms)
Since logical reads always use CPU, and, like duration, CPU is measured in milliseconds, this relationship is not surprising. The results are consistent with the idea that if you want your database applications to run as fast as possible, focusing on reducing query CPU and logical reads will be more effective at reducing duration than using waits alone. Fortunately, doing so via better query design, indexing, etc. is usually a more straightforward proposition than reducing query wait time directly. Colleague Aaron Bertrand effectively presents some of the caveats when tuning with waits here.
% of Total Wait Time
Next, I looked at whether the queries with the highest wait time tend to account for the most resource consumption. We want to determine whether what we saw on the customer system is atypical, where the top 2 waiting queries represented a relatively small percentage of the total resource consumption.
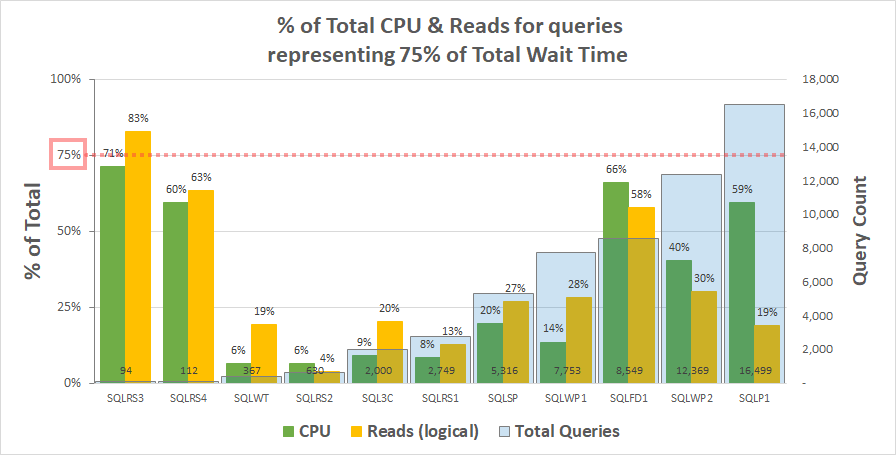
Chart 1 below shows the % of total CPU and logical reads for each server accounted for by the queries representing 75% of the total wait time. Only one server had a resource exceeding 75% – reads on SQLRS3. For the rest, the queries responsible for 75% of the wait time consumed less than 75% of the resources – often far less. This reflects what we saw on the customer system and is consistent with the correlation analysis.
Note that there appears to be a relationship with the total number of queries in the workload. This is represented by the light blue column series on the secondary y-axis and the chart is sorted ascending by this series. The two servers with the highest resource measures at 75% of waits also had the fewest queries (SQLRS3 and SQLRS4). The smaller the workload set the greater the potential influence of a small number of queries, and sure enough, on both servers only two queries accounted for most of the waits and resources. One way to look at this is that waits help most to identify your heaviest queries when you least need it.
Wait Time and Query Duration
Finally, I evaluated the % of total wait time to total query duration on each system. Table 3 has columns for:
- Total query duration in ms
- Total wait time ms – raw
- Total wait time ms – without Parallelism, Idle and User Waits (Rev1)
- Total wait time ms – without Parallelism, Idle, User Waits and CPU (Rev2)
- The % of duration for the 3 wait time columns, with data bars
- Total unique query count, with data bars
The unweighted average for the meaningful waits (Rev2) across all systems is 37% of total query duration. On five of the systems it was less than 25%, and on only two systems was it above 50%. On the system with 92% wait time (SQLRS4), one with the fewest queries, two queries accounted for 99% of waits, 97% of duration, 84% of CPU, and 86% of reads.
Although wait time can represent a significant portion of query runtime on certain systems, and it seems intuitive that if you reduce wait time query duration will also drop, we’ve seen that wait time and duration are weakly correlated. It’s unlikely to be that simple, and my own experience corroborates this. More research is needed here.
Comprehensive Tuning with Plan Explorer and SQL Sentry
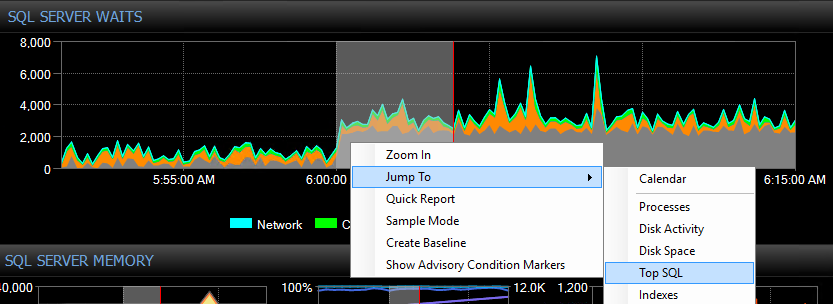
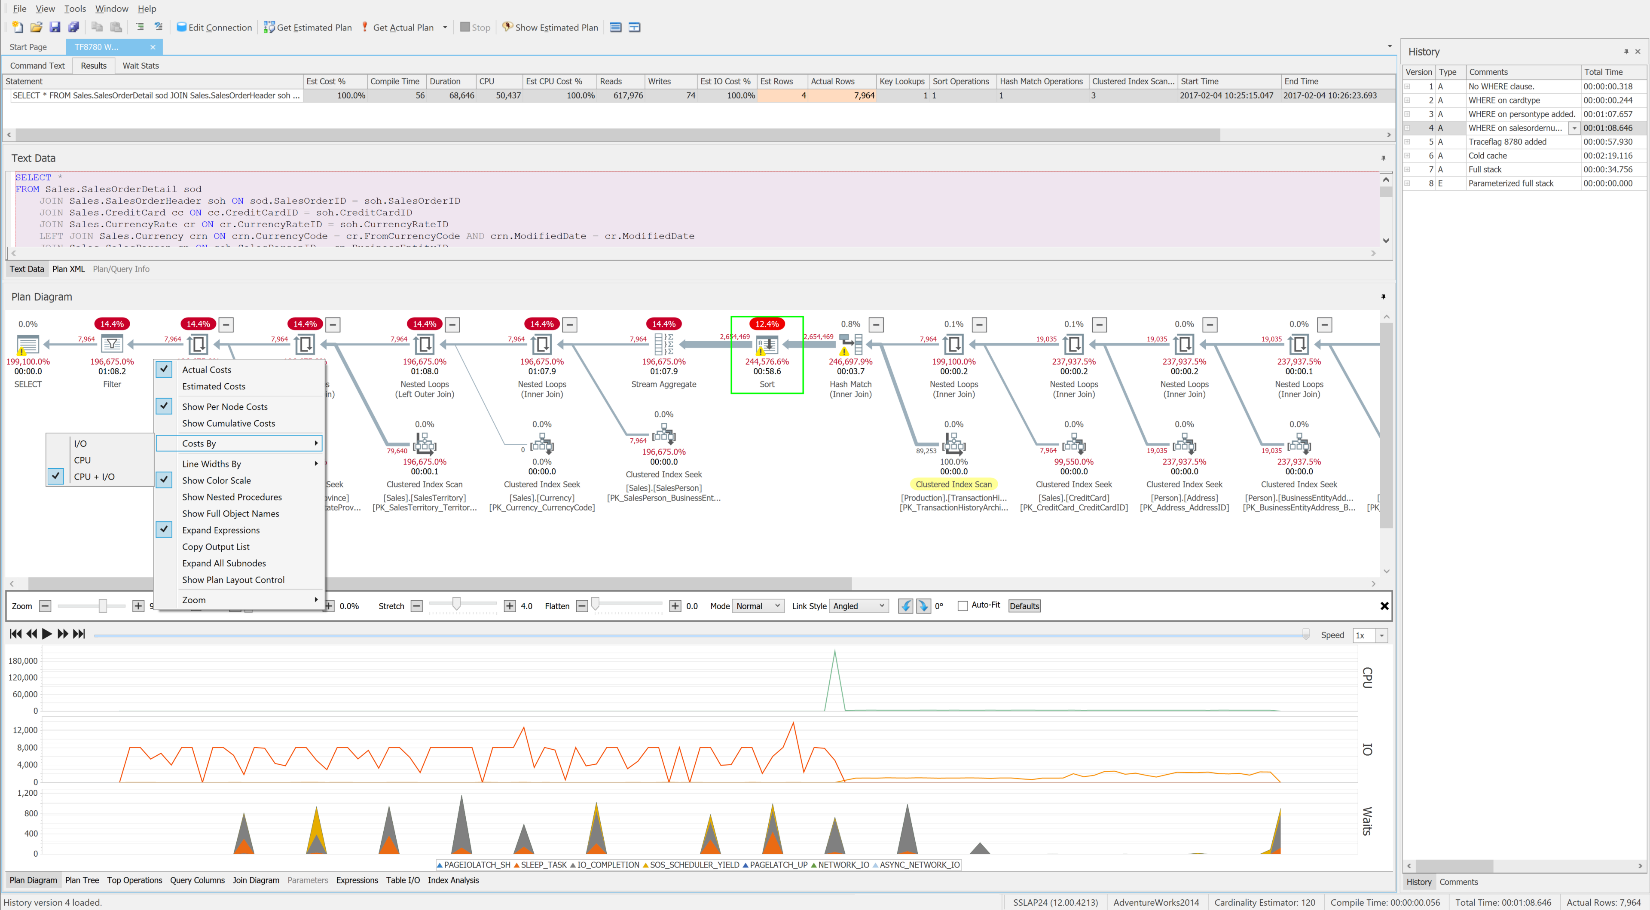
As this excellent SQLskills whitepaper frequently suggests, the root of high waits is often unoptimized queries and indexes. The free SentryOne Plan Explorer is purpose-built to reduce resource consumption via efficient query tuning using its Index Analysis module and many other innovative features. SQL Sentry integrates Plan Explorer directly into the Top SQL, Blocking, and Deadlocks modules, so you can automatically capture and tune problematic queries in one place. You can easily select a range of interest on the SQL Sentry dashboard’s historical waits, CPU, or IO charts and jump to the Top SQL view to find the top resource-consuming queries during that time. Then with a single click you can open a query in Plan Explorer and get detailed query-level waits and resources on demand when needed. I don’t think there is a better embodiment of the full Waits and Queues tuning methodology than this.
 SQL Sentry Dashboard “Waits” chart
 The free SentryOne Plan Explorer showing waits over time, along with operation-level costs and resources
Conclusion
Tuning with waits and queues is just as applicable to SQL Server performance today as it was back in 2006. However, focusing on waits to the exclusion of resources is dangerous business, since it’s clear from the data that doing so will lead to generally unoptimized and cost-inefficient systems. When it comes to hardware resources and cloud spend, you are ultimately paying for compute and IO resources, not wait time, so it is expedient to optimize directly for consumption. In my experience, as resource consumption and related contention is lowered, reduced wait time will naturally follow.
Acknowledgment
I wanted to thank Fred Frost, Lead Data Scientist at SentryOne, for his valuable input and critical review of this analysis.


Excellent
Very well researched article. Thanks for posting
One thing I forgot to ask you Greg. The print-screen I see in this article of Plan Explorer has a lower panel with CPU/IO/Waits utilization.
Is this a feature of a paid version? (last time I checked, the Plan Explorer I have installed on my machine does not show you that… maybe I just don't know how to see it though…)
Hi Martin, no, this feature is in the free Plan Explorer. You have to use PE to get an actual plan with With Live Query Profile enabled. The query has to run long enough to sample meaningful data from the DMVs, so queries that run too fast won't show any info. The docs for enabling this feature are here:
https://docs.sentryone.com/help/live-query-profile
Jason Hall and I both talk a little about it in the following posts:
https://www.sentryone.com/blog/jasonhall/plan-explorer-update
https://sqlperformance.com/2016/09/sql-performance/plan-explorer-webinar
The demo kit has a sample you can play with, too:
https://www.sentryone.com/blog/aaronbertrand/plan-explorer-3-0-demo-kit
That's great info Aaron! I will look into these resources later today.
Thanks for the quick feedback.