
Wait Statistics and Query Store
There are numerous blog posts on this site related to wait statistics; they are one of the most important metrics you can use when troubleshooting performance issues in SQL Server. Wait statistics were made available in SQL Server 2005 and traditionally they have represented waits at the instance level via sys.dm_os_wait_statistics. This information is great when troubleshooting system performance in general, but when looking at query performance, wait information could only be seen when the query was executing and if it was waiting on a resource via sys.dm_os_waiting_tasks. The data in sys.dm_os_waiting_tasks is transient (it’s what is waiting right now) and isn’t easy to capture and retain for the life of a query for performance tuning at a later time.
In SQL Server 2016 a new DMV is exposed, sys.dm_exec_session_wait_stats, which provides information about waits for an existing, active session. If you know the session_id, you can track waits for a query when it starts and when it completes (snapshot the information at the beginning and end of the query and then diff the information). The challenge is that you have to know the session_id for the query, and you have to set up data capture in advance – which isn’t trivial when you’re in the midst of a high priority issue.
Wait statistics information exists in an actual execution plan starting in SQL Server 2016 SP1. Only the top 10 waits are captured, and there are limitations in terms of what this data represents. For example, CXPACKET is ignored and not included in the output, but it will be included in 2016 SP2 and 2017 CU3 and up – where irrelevant parallelism waits are instead captured by CXCONSUMER (which will not be included in actual plan waits).
So how can we see what a specific query is truly waiting on? We can use Query Store! SQL Server 2017 includes the capture of wait statistics information in Query Store, and this functionality is also available in Azure SQL Database. Wait statistics are tied to a query plan, and are captured over time, just like the runtime statistics. The addition of wait statistics information in Query Store was the number one feature request after its initial release, and all that information together creates powerful troubleshooting capabilities.
Getting Started
Wait statistics capture in Query Store is enabled by default for Azure SQL Database. When a new database is created in SQL Server 2017, or a database is upgraded from SQL Server 2014 or earlier, Query Store is disabled by default… and thus the capture of wait statistics is disabled. When a database is upgraded from SQL Server 2016, if it has Query Store enabled, then wait statistics collection for Query Store will be enabled upon upgrade.
For demonstration purposes, I’ve restored the WideWorldImporters database, then I executed the queries below to enable Query Store and clear out any data that might have existed previously (only necessary because this is a sample database):
ALTER DATABASE [WideWorldImporters] SET QUERY_STORE = ON;
GO

ALTER DATABASE [WideWorldImporters] SET QUERY_STORE
(
  OPERATION_MODE = READ_WRITE
);
GO

ALTER DATABASE [WideWorldImporters] SET QUERY_STORE CLEAR;
GO
The default settings are used with the statements above, and if you want to alter any of the options, you can do so through the UI or via the ALTER DATABASE statement. Now that Query Store is enabled, it will start to capture query data including the query text, the plan(s), runtime statistics, and wait statistics.
Looking at Wait Statistics
To generate some data, we will create a stored procedure that runs a parallel query repeatedly.
DROP PROCEDURE IF EXISTS [Sales].[OrderInfo];
GO

CREATE PROCEDURE [Sales].[OrderInfo]
AS
BEGIN
  WHILE 1=1
  BEGIN
    SELECT *
      FROM Sales.OrderLines ol
      INNER JOIN Warehouse.StockItems s
      ON ol.StockItemID = s.StockItemID
      OPTION (QUERYTRACEON 8649);
  END
END
Then, create a .cmd file with the following code:
exit
This allows us to not run the SP inside Management Studio, which creates significant ASYNC_NETWORK_IO waits; we want to see the waits related to parallelism. Save the .cmd file, then double-click to run. You can generate additional load by running multiple files. With this scenario we will primarily see the waits related to this query, as we have no other workload. Feel free to execute other queries against the WideWorldImporters database concurrently if you want to generate even more wait data.
After several minutes, stop the command files and expand the WideWorldImporters database within Management Studio to see the Query Store folder, and the reports underneath. If you open up the Top Resource Consuming Queries report, you should see the stored procedure query as the top query.
The default view for this report shows queries with the highest total duration. To view queries based on wait statistics, we can select the Configure button and change it to Wait Time (ms).
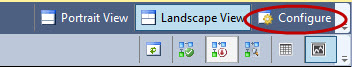 Configure button in report view (top right)
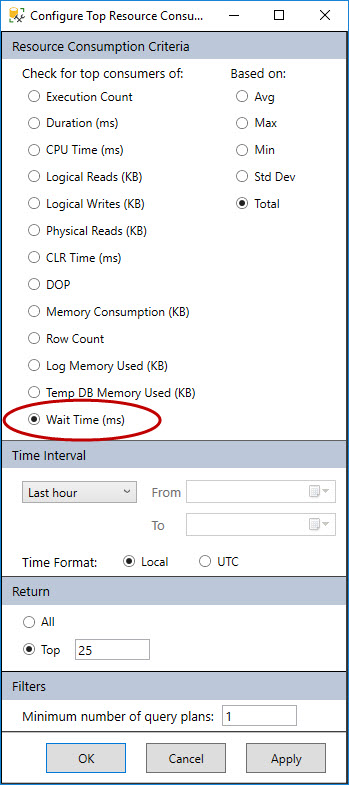 Changing the resource for the report
If you hover over the bar for the first query, you can see the wait times for the query. This view is currently the only way to view the wait information in the UI, but additional reports specific to wait stats are hopefully coming in a future release of Management Studio.
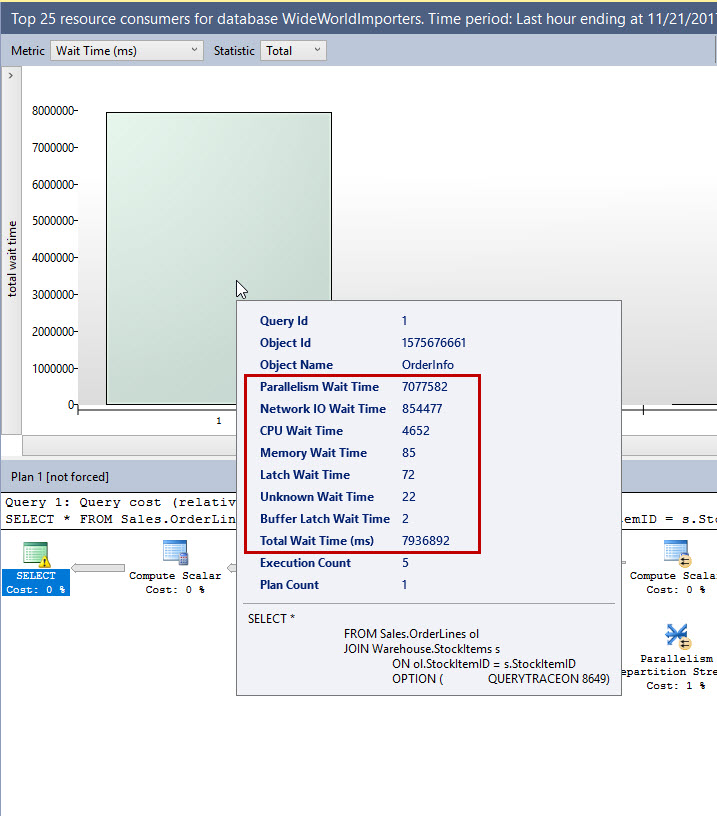 Wait information in the UI
Those of you that have worked with wait stats for a while will notice that the wait type descriptions are different. That is, instead of a CXPACKET wait type to indicate parallelism, you simply see “Parallelism Wait Type.” This is a fundamental difference in Query Store: The wait types are grouped into categories. There are over 900 different wait types in SQL Server at this point, and trying to track each one separately is extremely expensive. In addition, Query Store was designed with all data professionals in mind – whether you’re an expert at performance tuning or just getting started with understanding how SQL Server works, you should be able to use Query Store to easily find poor-performing queries. That also means making the wait information easier to understand. For a complete listing of wait categories and the wait types within, please visit the documentation for sys.query_store_wait_stats.
You can also view wait information using T-SQL. An example query is the one below, which includes the query, the plan_id(s) for that query, and wait statistics for a given interval of time:
SELECT TOP (10)
[ws].[wait_category_desc],
[ws].[avg_query_wait_time_ms],
[ws].[total_query_wait_time_ms],
[ws].[plan_id],
[qt].[query_sql_text],
[rsi].[start_time],
[rsi].[end_time]
FROM [sys].[query_store_query_text] [qt]
JOIN [sys].[query_store_query] [q]
ON [qt].[query_text_id] = [q].[query_text_id]
JOIN [sys].[query_store_plan] [qp]
ON [q].[query_id] = [qp].[query_id]
JOIN [sys].[query_store_runtime_stats] [rs]
ON [qp].[plan_id] = [rs].[plan_id]
JOIN [sys].[query_store_runtime_stats_interval] [rsi]
ON [rs].[runtime_stats_interval_id] = [rsi].[runtime_stats_interval_id]
JOIN [sys].[query_store_wait_stats] [ws]
ON [ws].[runtime_stats_interval_id] = [rs].[runtime_stats_interval_id]
AND [ws].[plan_id] = [qp].[plan_id]
WHERE [rsi].[end_time] > DATEADD(MINUTE, -5, GETUTCDATE())
AND [ws].[execution_type] = 0
ORDER BY [ws].[avg_query_wait_time_ms] DESC;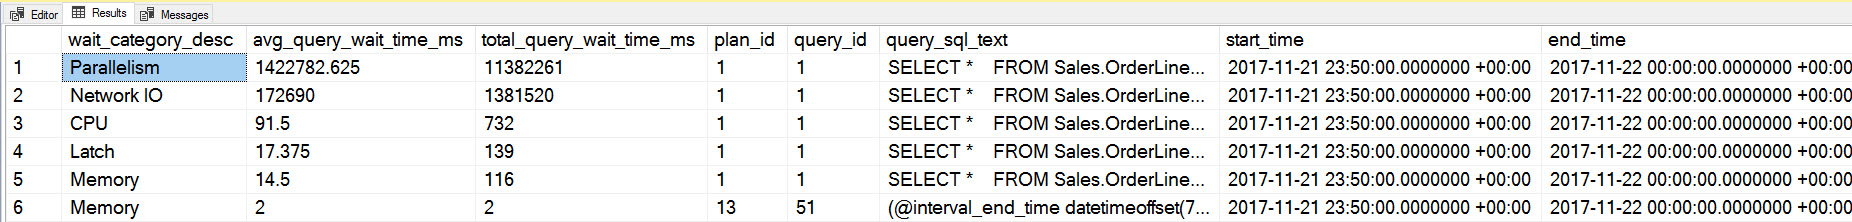 Query output
While you can now see all the waits for a given query and its plan, you will still have to dig further into performance to understand, for example, why a query is running in parallel (when perhaps you don’t want it to) or what might be blocking a query. Note that the wait statistics, just like the runtime statistics, are tied to the query plan over time. In this output, the interval length for Query Store is set for 10 minutes, so the wait statistics are for each plan for that 10-minute interval (11:50 PM on November 21, 2017 to midnight on November 22, 2017). By default the interval length when you enable Query Store is 60 minutes.
Summary
Wait statistics, combined with individual query plans, make Query Store an even more formidable tool when troubleshooting system and query performance. Query Store is the only feature which allows you to natively capture query, plan, performance metrics, and wait statistics all in one location. For those of you used to the myriad of wait types, adjusting to the categories used in Query Store should be seamless. For anyone new to wait statistics, the categories are a great place to start understand the resource for which a query is waiting.
3 thoughts on “Wait Statistics and Query Store”
Comments are closed.

Very clearly explained, thank you
Erin, That is really great information. I have tried to send you an e-mail asking if there is a way to use query store not only to capture query stats itself but also how a view that is used in that query affects performance and what wait time is actually a wait of the view to be created. Extra help is greatly appreciated.
Thank you.
Hi Alex-
I did get your email, I just don't have an answer for you yet :) As soon as I do (with regards to QS information for views and the related wait stats), I will reply and post here.
Thanks!
Erin