Parallelism
In part one of this series, I explained how the lock manager maintains a count of held locks per transaction, and individual access methods keep a separate lock count per HoBt for each plan operator performing data access.
Parallelism adds an extra layer of complexity because both lock counts are maintained per thread.
There are two underlying reasons for this:
- Each additional parallel worker thread operates inside a nested sub-transaction with the original transaction as its parent. A count of held locks is maintained per sub-transaction and so per-thread.
- Each worker in a parallel data-access operator has its own access method, meaning the per-HoBt counts are also separate.
Let’s look at a couple of examples to see what this means in practice.
Test 3—20,000 rows at DOP 4
This test reuses the procedure from part one with a modified test statement designed to produce a parallel plan:
-- Test statement(s)
DECLARE @i bigint;

SELECT
    @i = LT.i
FROM dbo.LockTest AS LT
    WITH (REPEATABLEREAD)
WHERE
    LT.i > (SELECT 0)
OPTION
(
    USE HINT ('ENABLE_PARALLEL_PLAN_PREFERENCE'),
    MAXDOP 4
);
-- End test statement(s)
Now run the test with 20,000 rows:
EXECUTE dbo.RunTest @Rows = 20000;
The post-execution (actual) plan is:
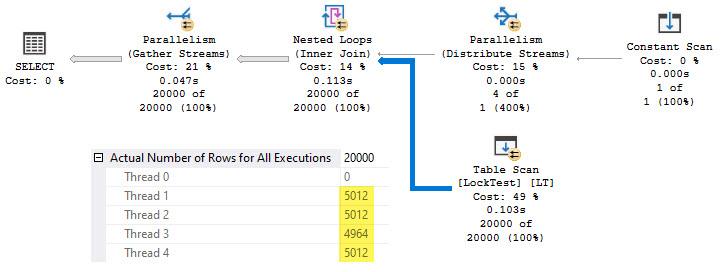
Example results:
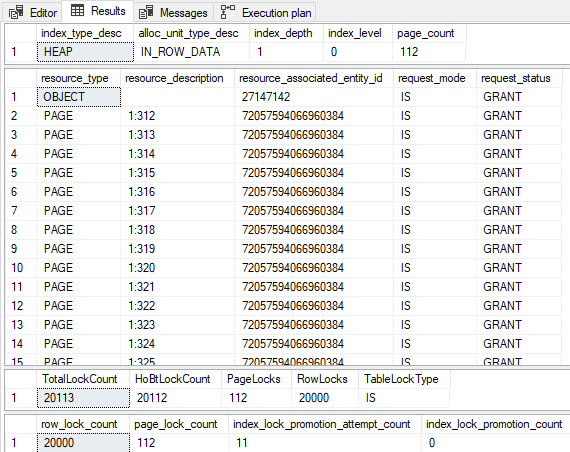
No lock escalation occurs despite a total of 20,113 locks being held. This is because the total held locks and HoBt checks are per-thread. None of the four threads has individually acquired 5000 or more HoBt locks when checks take place at 2500, 3750, and 5000 held locks per sub-transaction.
Remember, the HoBt lock count doesn’t include the table-level lock or the current lock being acquired. In this test run, three of the threads read more than 5000 rows, but each had an HoBt lock count of 4998 when the check at 5000 total locks occurred.
A total of 11 lock ‘promotion attempts’ are recorded in this run. Three threads passed checkpoints at 2500, 3750, and 5000 total held locks, accounting for nine checks between them. The remaining thread checked at 2500 and 3750 total locks, accounting for the two other checks.
None of these checks resulted in an escalation attempt because no thread had acquired 5000 HoBt locks at the time.
Test 4—24,000 rows at DOP 4
We’ll now increase the number of rows to 24,000:
EXECUTE dbo.RunTest @Rows = 24000;
A sample post-execution plan is:
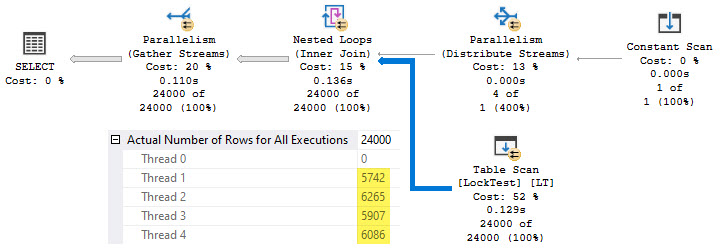
Example results:
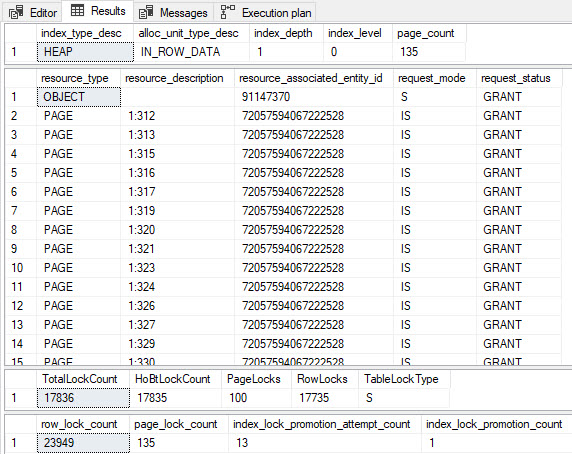
This time we do see a lock escalation, but there are still 17,836 locks held at the end of the test.
Thread two reached 6250 locks held (with 6248 on its access method), so its locks were escalated. None of the other threads reached the threshold, so their locks were not escalated.
The single escalation reduced the total number of locks held at the end of test four (17,836) compared with test three (20,113) despite the extra 4000 rows in the test table.
If you have a machine with more than four cores, you might like to try the tests with more rows and a higher degree of parallelism. You’ll find each thread considers lock escalation separately.
I’ll show one last example of the plan and test output running at DOP 12 on 64,000 rows, where three threads escalated:
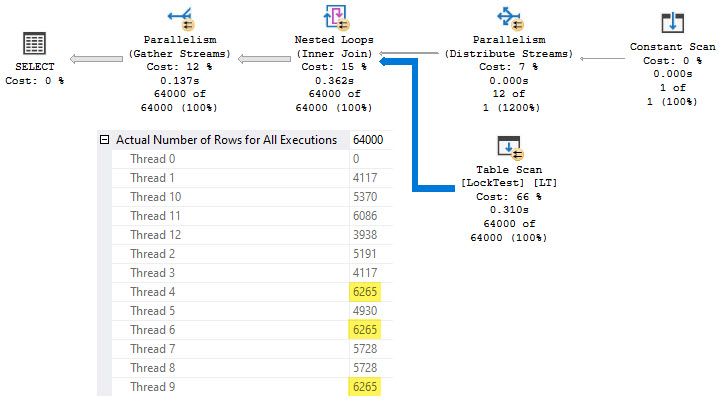
The results confirm three per-thread escalations, with 45,459 locks held at the end:
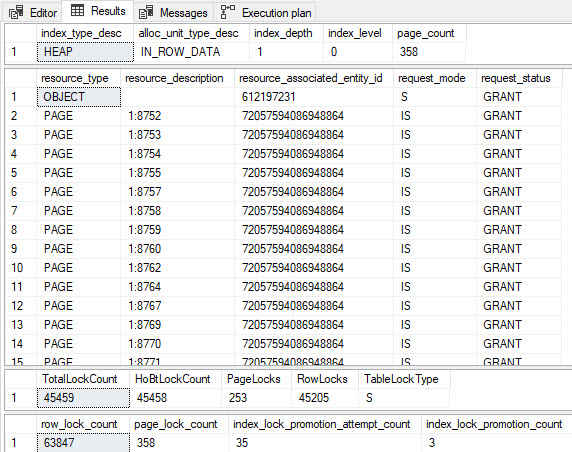
Interestingly, these tests show a single-table query holding a table-level shared lock while also holding intent-share locks on pages and shared locks on rows in the same table.
Promotion attempts
Let’s replace the test statement with:
-- Test statement(s)
DECLARE @i bigint;

SELECT
    @i = LT.i
FROM dbo.LockTest AS LT
    WITH (REPEATABLEREAD)
WHERE
    LT.i <= 2483;
-- End test statement(s)
Run the test procedure for 2685 rows in a heap table:
EXECUTE dbo.RunTest @Rows = 2685;
The execution plan couldn’t be more straightforward:

The results show 179 lock promotion attempts on a single serial scan of this 15-page table with no actual escalation:
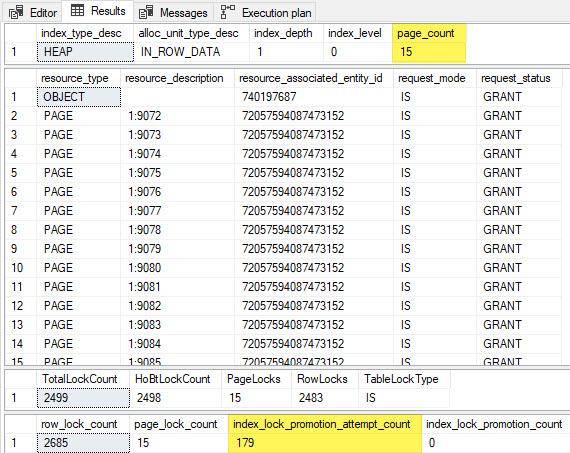
Of course, the test is engineered to produce this remarkable result, but why does it happen?
Explanation
The key observation is lock promotion tests happen whenever the total held lock count increases to become exactly divisible by 1250 (except for 1250 itself, as explained in part one).
The table scan happens to encounter rows in ascending order with respect to the column i. This is not guaranteed, but it’s likely in this case.
Each row is read and tested to see if it qualifies for the predicate LT.i <= 2483. The first 2483 rows encountered all qualify and are locked with a shared row lock. These rows appear on 14 different pages, each of which acquires an intent-share lock. Adding the intent-share lock on the table gives a total of 2483 + 14 + 1 = 2498 held locks at this point in the full table scan.
Not all rows on page 14 qualify, but they are still locked before being tested. This shared row lock is released when SQL Server determines the row doesn’t qualify. If this surprises you, remember repeatable read isolation only holds locks to the end of the transaction for qualifying rows.
Having scanned 14 pages so far, the table scan now moves to the last page in the table. Preparing to read the first row on that page, it acquires an intent-share lock, bringing the total held locks to 2499.
The scan next takes a shared lock on the first row on page 15 bringing the total held locks to 2500. This is divisible by 1250, so it triggers an escalation check and increments the poorly-named ‘promotion attempts’ counter. No escalation is attempted because the HoBt doesn’t hold at least 5000 locks.
The scan finds the current row doesn’t meet the query predicate, so it releases the shared row lock, bringing the total lock count back to 2499. Note the intent-share page lock is not released, despite no rows on page 15 qualifying.
The table’s row width means 179 rows fit on each 8K page. Each of the non-qualifying rows on page 15 is tested in the same way. This causes 179 escalation checks as the total held lock count briefly hits 2500 and then retreats to 2499 for each non-qualifying row.
Promotion attempts on a clustered table
If you’re (rightly) bothered by the idea of scanning a heap table in a predictable order, try the following test statement:
-- Test statement(s)
DECLARE @i bigint;

SELECT
    @i = LT.i
FROM dbo.LockTest AS LT
    WITH (REPEATABLEREAD)
WHERE
    LT.i <= 2483
ORDER BY
    LT.pk ASC;
-- End test statement(s)
Run the test procedure specifying a clustered table:
EXECUTE dbo.RunTest
    @Rows = 2685,
    @Clustered = 'true';
This produces a plan with the Ordered:True and Scan Direction: FORWARD attributes on the Clustered Index Scan. We know the columns i and pk have the same value in every row, so this is an acceptable guarantee of ordered processing.

The results are:
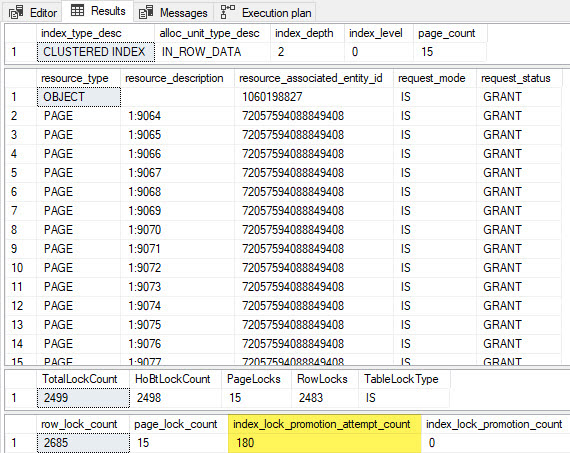
This shows one more than the 179 lock promotion attempts seen for the heap table example. The mechanism is exactly the same, aside from one minor locking implementation detail:
The heap scan is driven from IAM page(s) for the table, so each table page is fully processed in isolation. In particular, the shared lock on the last row of a page is released before moving to the next page.
This clustered index scan follows leaf-level forward and backward pointers since it doesn’t qualify for an allocation-order scan. The shared lock on the last row of a page is released after acquiring an intent-share lock on the next page but before acquiring the first shared row lock on the new page.
This slight difference means the held lock count reaches 2500 when the intent share lock is taken for page 15. The count returns to 2499 when the lock on the last row of page 14 is released, then hits 2500 again when the first row on page 15 is locked. This accounts for the one extra lock ‘promotion attempt.’
Avoiding lock promotions on the clustered table
The clustered example allows us to avoid lock ‘promotion attempts’ by scanning the index backward:
-- Test statement(s)
DECLARE @i bigint;

SELECT
    @i = LT.i
FROM dbo.LockTest AS LT
    WITH (REPEATABLEREAD)
WHERE
    LT.i <= 2483
ORDER BY
    LT.pk DESC; -- Now descending
-- End test statement(s)
Run the test as before:
EXECUTE dbo.RunTest
    @Rows = 2685,
    @Clustered = 'true';
The execution plan shows a BACKWARD scan of the index:

The results show no lock promotion attempts:
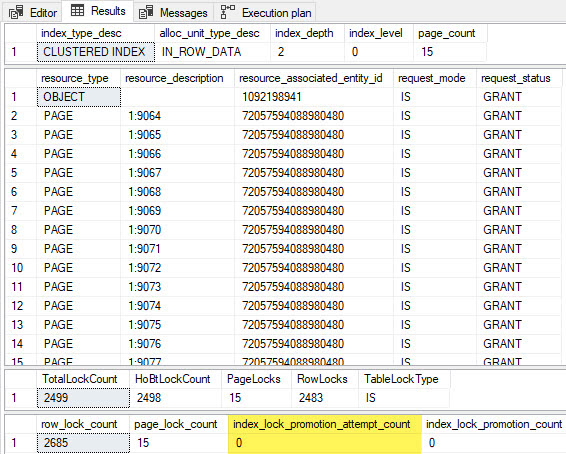
The backward scan ensures all non-qualifying rows are encountered before the qualifying ones. Locks on non-qualifying rows are released, so the 2500 first-check threshold is never hit. The highest held lock count hit during the scan is 2499, as shown in the third result set.
The final result set shows 2685 row locks because sys.dm_db_index_operational_stats counts all locks taken—it doesn’t decrement when a lock is released. All 2685 rows in the table were locked at some point, but only 2483 row-level locks were held on the qualifying rows.
End of part two
The final part of this series will cover lock lifetimes and further internal details about lock escalation.


