In the spirit of Grant Fritchey's recent rants, and Erin Stellato's efforts since I think before we met, I want to get on the bandwagon to trumpet and promote the idea of ditching trace in favor of Extended Events. When someone says trace, most people immediately think Profiler. While Profiler is its own special nightmare, today I wanted to talk about SQL Server's default trace.
In our environment, it is enabled on all 200+ production servers, and it collects a whole lot of garbage we're never going to investigate. So much garbage, in fact, that important events we might find useful for troubleshooting roll out of the trace files before we ever get the chance. So I started to consider the prospect of turning it off, because:
- it's not free (the observer overhead of the trace activity itself, the I/O involved with writing to the trace files, and the space they consume);
- on most servers, it's never looked at; on others, rarely; and,
- it's easy to turn back on for specific, isolated troubleshooting.
A couple of other things affect the value of the default trace. It is not configurable in any way — you can't change which events it collects, you can't add filters, and you can't control how many files it keeps (5), how big they can get (20 MB each), or where they are stored (SERVERPROPERTY('ErrorLogFileName')). So we are completely at the mercy of the workload — on any given server, we can't predict how far back the data might go (events with larger TextData values, for example, can take up a lot more space, and push out older events more quickly). Sometimes it can go back a week, other times it can go back just minutes.
Analyzing Current State
I ran the following code against 224 production instances, just to understand what kind of noise is filling up the default trace across our environment. This is probably more complicated than it needs to be, and isn't even as complex as the final query I used, but it's a decent starting point to analyze the breakdown of high-level event types that are currently being captured:
;WITH filesrc ([path]) AS
(
  SELECT REVERSE(SUBSTRING(p, CHARINDEX(N'\', p), 260)) + N'log.trc'
  FROM (SELECT REVERSE([path]) FROM sys.traces WHERE is_default = 1) s(p)
),
tracedata AS
(
  SELECT Context = CASE
    WHEN DDL = 1 THEN
      CASE WHEN LEFT(ObjectName,8) = N'_WA_SYS_'
                THEN 'AutoStat: ' + DBType
           WHEN LEFT(ObjectName,2) IN (N'PK', N'UQ', N'IX') AND ObjectName LIKE N'%[_#]%'
                THEN UPPER(LEFT(ObjectName,2)) + ': tempdb'
           WHEN ObjectType = 17747 AND ObjectName LIKE N'TELEMETRY%'
                THEN 'Telemetry'
                ELSE 'Other DDL in ' + DBType END
    WHEN EventClass = 116 THEN
      CASE WHEN TextData LIKE N'%checkdb%' THEN 'DBCC CHECKDB'
           -- several more of these ...
           ELSE UPPER(CONVERT(nchar(32), TextData)) END
    ELSE DBType END,
    EventName = CASE WHEN DDL = 1 THEN 'DDL' ELSE EventName END,
    EventSubClass,
    EventClass,
    StartTime
  FROM
  (
    SELECT DDL = CASE WHEN t.EventClass IN (46,47,164) THEN 1 ELSE 0 END,
      TextData = LOWER(CONVERT(nvarchar(512), t.TextData)),
      EventName = e.[name],
      t.EventClass,
      t.EventSubClass,
      ObjectName = UPPER(t.ObjectName),
      t.ObjectType,
      t.StartTime,
      DBType = CASE WHEN t.DatabaseID = 2 OR t.ObjectName LIKE N'#%' THEN 'tempdb'
                    WHEN t.DatabaseID IN (1,3,4)  THEN 'System database'
                    WHEN t.DatabaseID IS NOT NULL THEN 'User database' ELSE '?' END
    FROM filesrc CROSS APPLY sys.fn_trace_gettable(filesrc.[path], DEFAULT) AS t
    LEFT OUTER JOIN sys.trace_events AS e ON t.EventClass = e.trace_event_id
  ) AS src WHERE (EventSubClass IS NULL)
           OR (EventSubClass = CASE WHEN DDL = 1 THEN 1 ELSE EventSubClass END) -- ddl_phase
)
SELECT [Instance] = @@SERVERNAME,
       EventName,
       Context,
       EventCount = COUNT(*),
       FirstSeen  = MIN(StartTime),
       LastSeen   = MAX(StartTime)
INTO #t FROM tracedata
GROUP BY GROUPING SETS ((), (EventName, Context));
For a map of EventClass values, I listed them out in this answer on Stack Exchange.)
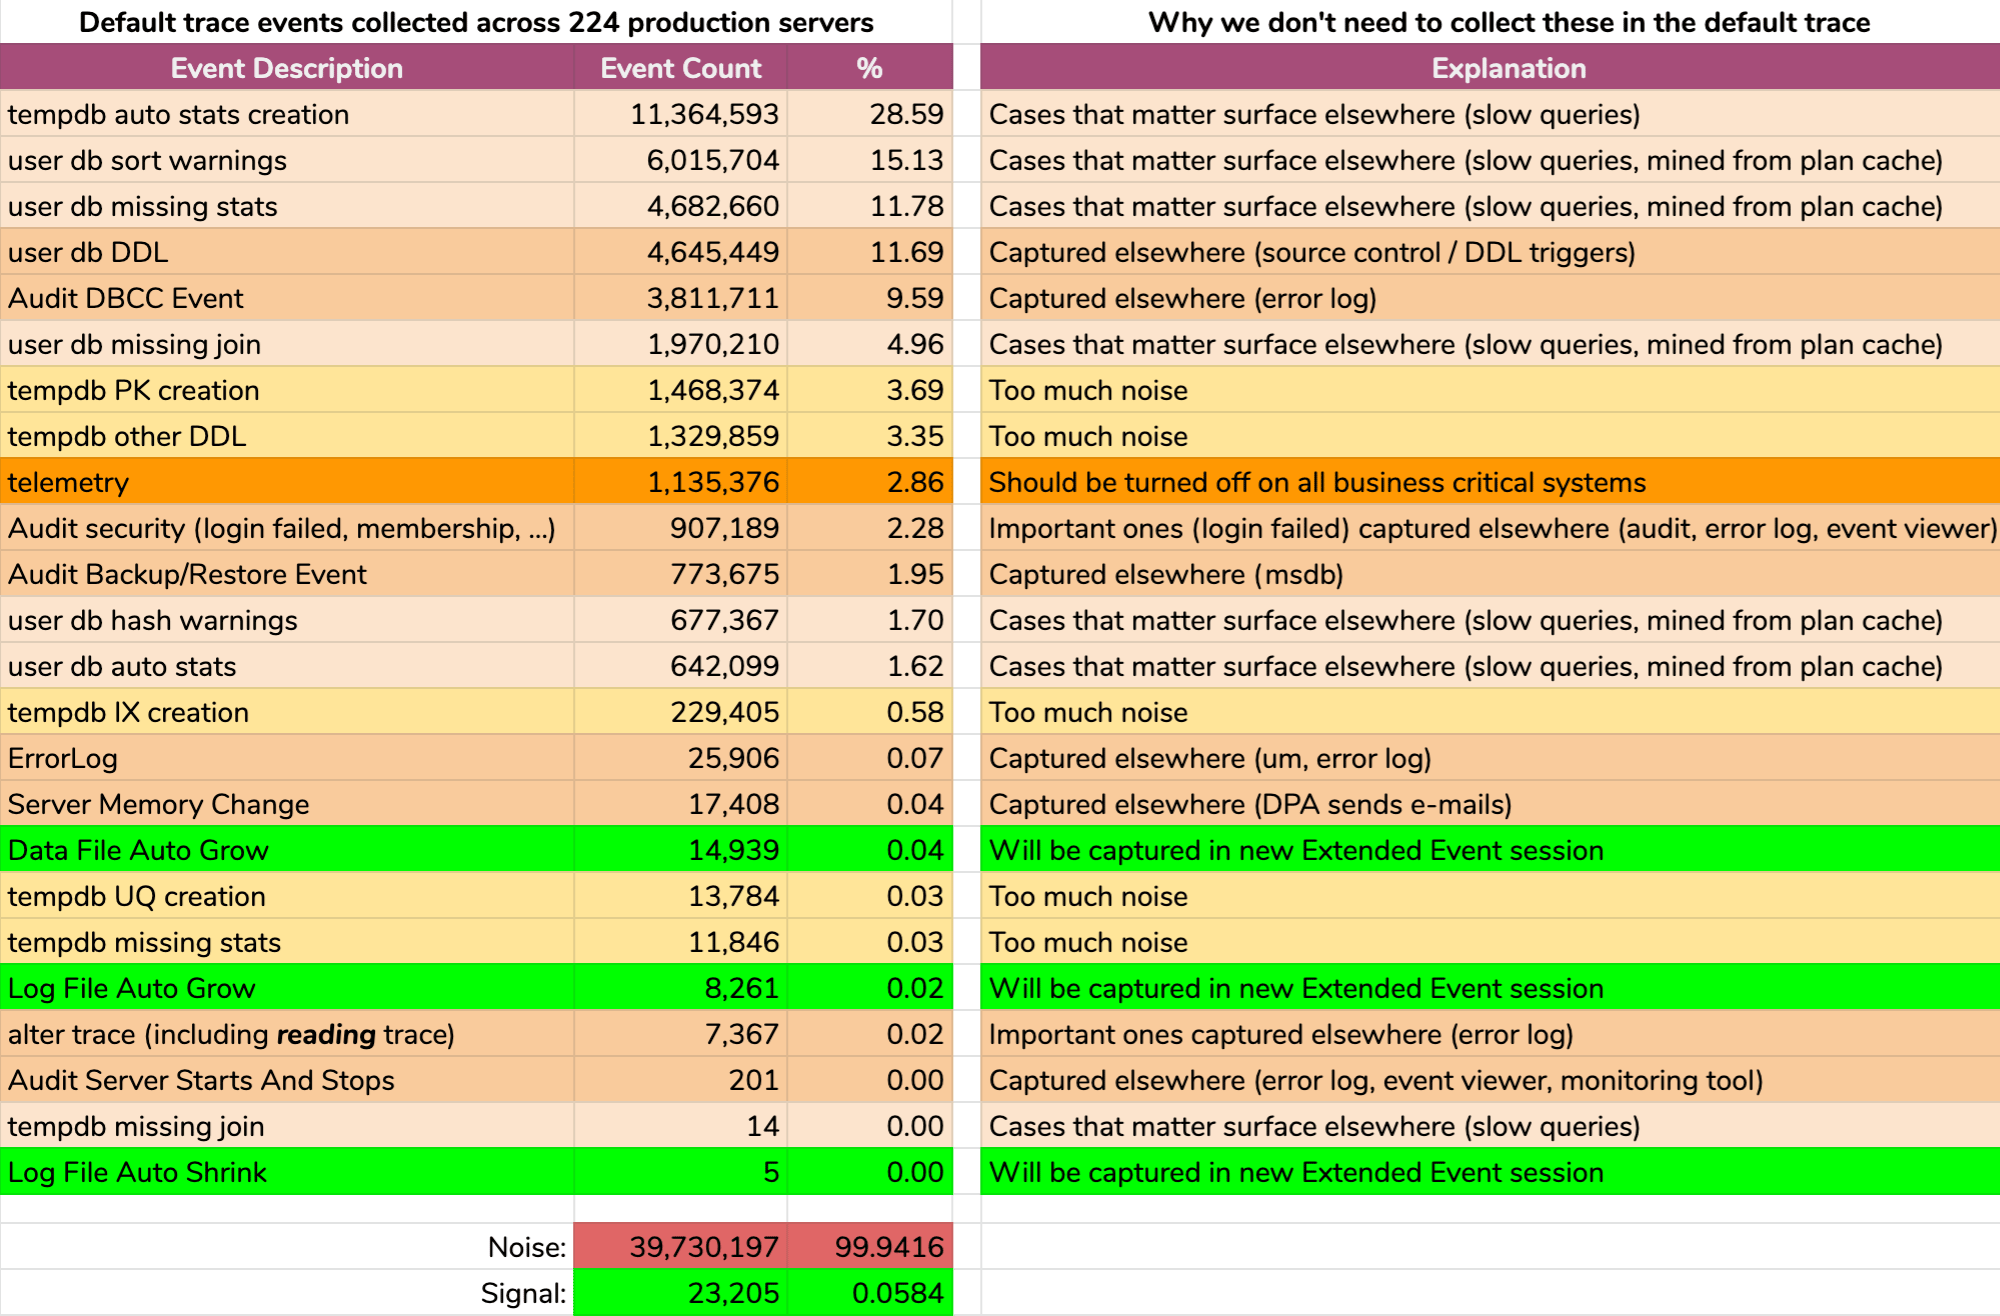
And the results are not pretty (typical results from a random server). The following doesn't represent the exact output of that query, but I spent some time aggregating the results into a more digestible format, to see how much of the data was useful and how much was noise (click to enlarge):
Almost all noise (99.94%). The only useful thing we ever needed from the default trace were file growth and shrink events, since they were the only thing we weren't capturing elsewhere in one way or another. But even that we aren't always able to rely on, because the data rolls away so quickly.
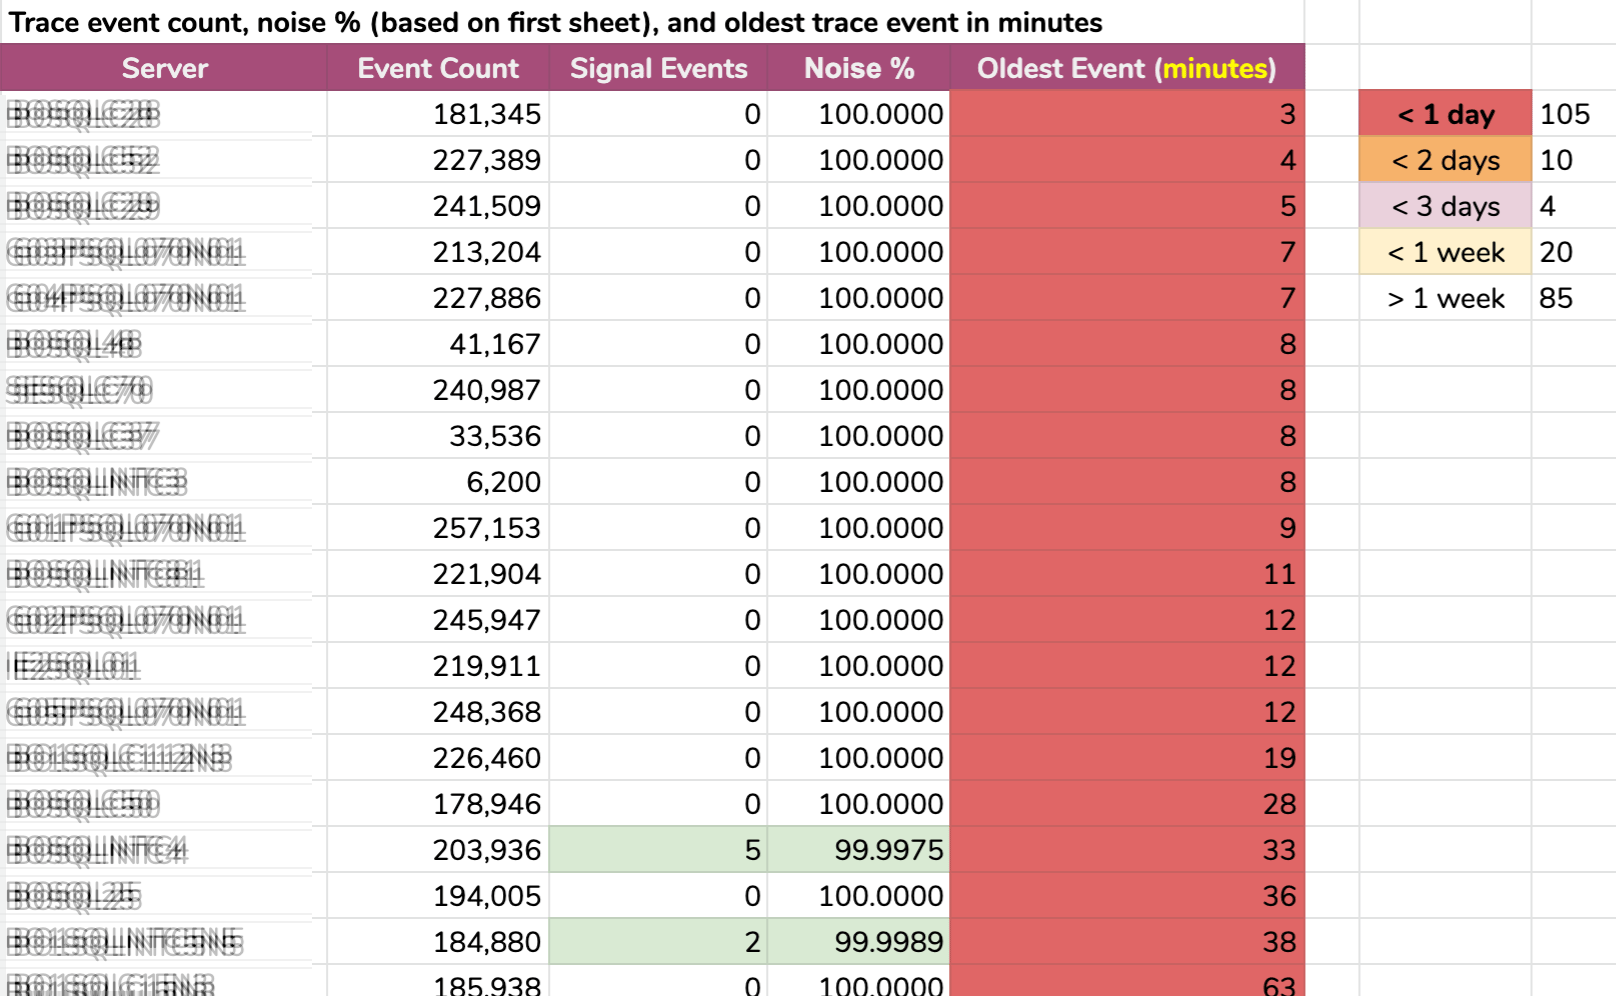
Another way I sliced the data: oldest event per instance. Some instances had so much noise that they couldn't hold onto default trace data for more than a few minutes! I blurred out the server names but this is real data (these are the 20 servers with the shortest history – click to enlarge):
Even if the trace were collecting only relevant info, and something interesting happened, we would have to act quickly to catch it, depending on the server. If it happened:
- 20 minutes ago, then it would already be gone on 15 instances.
- this time yesterday, it would be gone on 105 instances.
- two days ago, it would be gone on 115 instances.
- more than a week ago, it would be gone on 139 instances.
We had a handful of servers at the other end, too, but they're uninteresting in this context; those servers are that way simply because nothing interesting happens there (e.g. they're not busy or part of any critical workload).
On the plus side…
Investigating the default trace did reveal some misconfigurations on a few of our servers:
- Several servers still had telemetry enabled. I'm all for helping Microsoft in certain environments, but not at any overhead cost on business critical systems.
- Some background sync tasks were adding members to roles blindly, over and over, without checking if they were already in those roles. This isn't harmful per se, especially since these events will no longer fill up the default trace, but they are likely filling audits with noise too, and there are probably other blind re-apply operations happening in the same pattern.
- Someone had enabled autoshrink somewhere (good grief!), so this was something I wanted to track down and prevent from happening again (new XE will capture these events too).
This led to follow-up tasks to fix these issues and/or add conditions to existing automation already in place. So we can prevent recurrence without relying on just being lucky enough to happen upon them in some future default trace review, before they rolled out.
…but the problem remains
Otherwise, everything is either information we can't possibly act on or, as described in the graphic above, events we already capture elsewhere. And again, the only data I am interested in from the default trace that we don't already capture by other means are events relating to file growth and shrink (even though the default trace only captures the automatic variety).
But the bigger problem is not really the volume of noise. I can handle big massive trace files with a lot of garbage, since WHERE clauses were invented for exactly this purpose. The real problem is that important events were disappearing too quickly.
The Answer
The answer, in our scenario at least, was simple: disable the default trace, since it is not worth running if it can't be relied on.
But given the amount of noise above, what should replace it? Anything?
You might want an Extended Events session that captures everything the default trace captured. If so, Jonathan Kehayias has you covered. This would give you the same information, but with control over things like retention, where the data gets stored and, as you get more comfortable, the ability to remove some of the noisier or less useful events, gradually, over time.
My plan was a little more aggressive, and quickly became a "simple" process to perform the following on all servers in the environment (via CMS):
- develop an Extended Events session that only captures file change events (both manual and automatic)
- disable the default trace
- create a view to make it simple for our teams to consume target data
Note that I am not suggesting you blindly disable the default trace, just explaining why I chose to do so in our environment. In upcoming posts in this series, I'll show the new Extended Events session, the view that exposes the underlying data, the code I used to deploy these changes to all servers, and potential side effects you should keep in mind.


