SQL Server offers two methods of collecting diagnostic and troubleshooting data about the workload executed against the server: SQL Trace and Extended Events. Starting in SQL Server 2012, the Extended Events implementation provides comparable data collection capabilities to SQL Trace and can be used for comparisons of the overhead incurred by these two features. In this article we'll take a look at comparing the "observer overhead" that occurs when using SQL Trace and Extended Events in various configurations in order to determine the performance impact that data collection may have on our workload through the use of a replay workload capture and Distributed Replay.
The test environment
The test environment is comprised of six virtual machines, one domain controller, one SQL Server 2012 Enterprise edition server, and four client servers with the Distributed Replay client service installed on them. Different host configurations were tested for this article and similar results resulted from the three different configurations that were tested based on the ratio of impact. The SQL Server Enterprise edition server is configured with 4 vCPUs and 4GB of RAM. The remaining five servers are configured with 1 vCPU and 1GB RAM. The Distributed Replay controller service was run on the SQL Server 2012 Enterprise edition server because it requires an Enterprise license to use more than one client for replay.
Test workload
The test workload used for the replay capture is the AdventureWorks Books Online workload that I created last year for generating mock workloads against SQL Server. This workload uses the example queries from the Books Online against the AdventureWorks family of databases and is driven by PowerShell. The workload was setup on each of the four replay clients and run with four total connections to the SQL Server from each of the client servers to generate a 1GB replay trace capture. The replay trace was created using the TSQL_Replay template from SQL Server Profiler, exported to a script and configured as a server side trace to a file. Once the replay trace file was captured it was preprocessed for use with Distributed Replay and then the replay data was used as the replay workload for all of the tests.
Replay configuration
The replay operation was configured to use stress mode configuration to drive the maximum amount of load against the test SQL Server instance. Additionally, the configuration uses a reduced think and connect time scale, which adjust the ratio of time between the start of the replay trace and when an event actually occurred to when it is replayed during the replay operation, to allow the events to be replayed at maximum scale. The stress scale for the replay is also configured per spid. The details of the configuration file for the replay operation were as follows:
    SQL2K12-SVR1
    stress
    1
    1
    60
    3600
    255
    Yes
    spid


      No
      No
During each of the replay operations, performance counters were collected in five second intervals for the following counters:
- Processor\% Processor Time\_Total
- SQL Server\SQL Statistics\Batch Requests/sec
These counters will be used to measure the overall server load, and the throughput characteristics of each of the tests for comparison.
Test configurations
A total of seven different configurations were tested with Distributed Replay:
- Baseline
- Server-side Trace
- Profiler on server
- Profiler remotely
- Extended Events to event_file
- Extended Events to ring_buffer
- Extended Events to event_stream
Each test was repeated three times to ensure that the results were consistent across different tests and to provide an average set of results for comparison. For the initial baseline tests, no additional data collection was configured for the SQL Server instance, but the default data collections that ship with SQL Server 2012 were left enabled: the default trace and the system_health event session. This reflects the general configuration of most SQL Servers, since it is not generally recommended that the default trace or system_health session be disabled due to the benefits they provide to database administrators. This test was used to determine the overall baseline for comparison with the tests where additional data collection was being performed. The remaining tests are based on the TSQL_SPs template that ships with SQL Server Profiler and collects the following events:
- Security Audit\Audit Login
- Security Audit\Audit Logout
- Sessions\ExistingConnection
- Stored Procedures\RPC:Starting
- Stored Procedures\SP:Completed
- Stored Procedures\SP:Starting
- Stored Procedures\SP:StmtStarting
- TSQL\SQL:BatchStarting
This template was selected based on the workload used for the tests, which is primarily SQL batches that are captured by the SQL:BatchStarting event, and then a number of events using the various methods of hierarchyid, which are captured by the SP:Starting, SP:StmtStarting, and SP:Completed events. A server-side trace script was generated from the template using the export functionality in SQL Server Profiler, and the only changes made to the script were to set the maxfilesize parameter to 500MB, enable trace file rollover, and provide a filename to which the trace was written.
The third and fourth tests used SQL Server Profiler to collect the same events as the server-side trace to measure the performance overhead of tracing using the Profiler application. These tests were run using SQL Profiler locally on the SQL Server and remotely from a separate client to ascertain whether there was a difference in overhead by having Profiler running locally or remotely.
The final tests used Extended Events collected the same events, and the same columns based on an event session created using my Trace to Extended Events conversion script for SQL Server 2012. The tests included evaluating the event_file, ring_buffer, and new streaming provider in SQL Server 2012 separately to determine the overhead that each target might impose on the performance of the server. Additionally, the event session was configured with the default memory buffer options, but was changed to specify NO_EVENT_LOSS for the EVENT_RETENTION_MODE option for the event_file and ring_buffer tests to match the behavior of server-side Trace to a file, which also guarantees no event loss.
Results
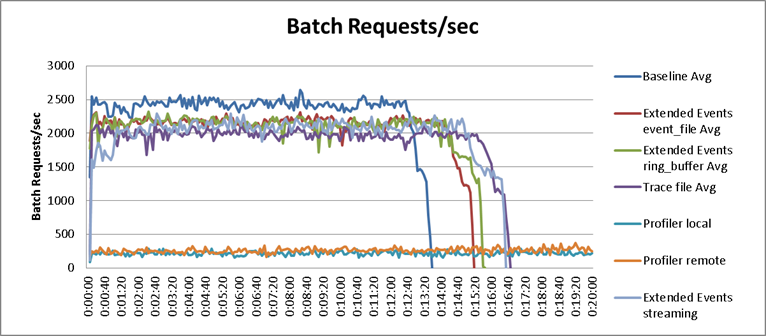
With one exception, the results of the tests were not surprising. The baseline test was able to perform the replay workload in thirteen minutes and thirty-five seconds, and averaged 2345 batch requests per second during the tests. With the server-side Trace running, the replay operation completed in 16 minutes and 40 seconds, which is an 18.1% degradation to performance. The Profiler Traces had the worst performers overall, and required 149 minutes when Profiler was run locally on the server, and 123 minutes and 20 seconds when Profiler was run remotely, yielding 90.8% and 87.6% degradation in performance respectively. The Extended Events tests were the best performers, taking 15 minutes and 15 seconds for the event_file and 15 minutes and 40 seconds for the ring_buffer target, resulting in a 10.4% and 11.6% degradation in performance. The average results for all tests are displayed in Table 1 and charted in Figure 2:

Table 1 – Average results of all tests
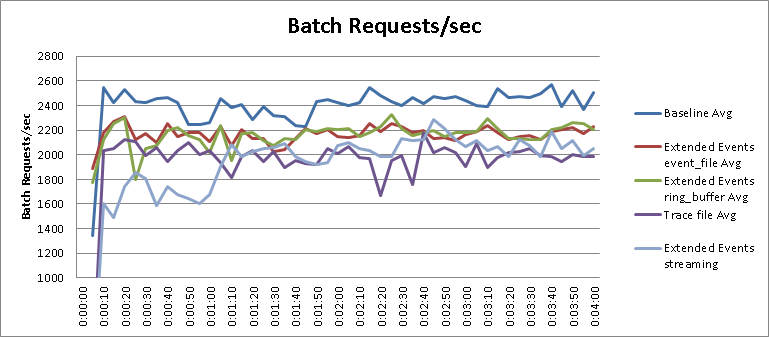
The Extended Events streaming test is not quite a fair result in the context of the tests that were run and requires a bit more explanation to understand the result. From the table results we can see that the streaming tests for Extended Events completed in sixteen minutes and thirty-five seconds, equating to 34.1% degradation in performance. However, if we zoom into the chart and change its scale, as shown in Figure 3, we'll see that the streaming had a much greater impact to the performance initially and then began to perform in a manner similar to the other Extended Events tests:
The explanation for this is found in the design of the new Extended Events streaming target in SQL Server 2012. If the internal memory buffers for the event_stream fill up and are not consumed by the client application fast enough, the Database Engine will force a disconnect of the event_stream to prevent severely impacting the server performance. This results in an error being raised in SQL Server 2012 Management Studio similar to the error in Figure 4:

Figure 4 – event_stream disconnected by server
(Microsoft.SqlServer.XEvent.Linq)
Error 25726, severity 17, state 0 was raised, but no message with that error number was found in sys.messages. If error is larger than 50000, make sure the user-defined message is added using sp_addmessage.
(Microsoft SQL Server, Error: 18054)
Conclusions
All of the methods of collecting diagnostics data from SQL Server have "observer overhead" associated with them and can impact the performance of a workload under heavy load. For systems running on SQL Server 2012, Extended Events provide the least amount of overhead and provide similar capabilities for events and columns as SQL Trace (some events in SQL Trace are rolled up into other events in Extended Events). Should SQL Trace be necessary for capturing event data – which may be the case until third-party tools are recoded to leverage Extended Events data – a server-side Trace to a file will yield the least amount of performance overhead. SQL Server Profiler is a tool to be avoided on busy production servers, as shown by the tenfold increase in duration and significant reduction in throughput for the replay.
While the results would seem to favor running SQL Server Profiler remotely when Profiler must be used, this conclusion cannot be definitively drawn based on the specific tests that were run in this scenario. Additional testing and data collection would have to be performed to determine if the remote Profiler results were the result of lower context switching on the SQL Server instance, or if networking between VMs played a factor in the lower performance impact to the remote collection. The point in these tests was to show the significant overhead that Profiler incurs, regardless of where Profiler was being run. Finally, the live event stream in Extended Events also has a high overhead when it is actually connected in collecting data, but as shown in the tests, the Database Engine will disconnect a live stream if it falls behind on the events to prevent severely impacting the performance of the server.


I was wondering when we'd see an article like this. Thanks. Now I have something to point to when asked about the impact of XEvents.
We are having a debate at work as to whether this new feature in 2012 allows me to distribute 1 or more traces to 2 or more machines (IN ITS ENTIRETY) for execution against a single database server (This would enable some form of "linear scaling") . The other interpretation of Distributed Replay is that it splits a single trace into parts for replay on > 1 machine (This would enable noting more than distributing the replay load across > 1 machine).
Which is it?
Lorrin,
Distributed Replay allows you to take a replay trace captured from a production SQL Server instance, and then replay that workload using 1-16 clients against a single target SQL Server. It is designed to allow you to simulate your production workload for testing, benchmarking, performance tuning, upgrade validations for regressions, or whatever else you want to do that requires a workload to perform.
I have no idea what world Microsoft is living in these days. Our processors are not the problem anymore. Most of our machines run with less than 20% of CPU power used during peak times. Server side traces are a bettor solution other than the minor CPU cost that means nothing in today's world. How about implementing some tools we need rather than replacing those that already work.
To play devil's advocate, what about all of those folks who *do* have high-throughput systems where trace (and especially Profiler) can have a *very* dramatic and noticeable impact on the workload?
That is based on edition, right? Developer allows only 1 client, if I remember correctly from one of your modules delivered. I though it is worth mentioning.
Very well thought out, written and helpful article. Thanks for sharing!