Have you ever contacted Microsoft or a Microsoft partner and discussed with them what it would cost to move to the cloud? If so, you may have heard about the Azure SQL Database DTU calculator, and you may have also read about how it has been reverse engineered by Andy Mallon. The DTU calculator is a free tool you can use to upload performance metrics from your server, and use the data to determine the appropriate service tier if you were to migrate that server to an Azure SQL Database (or to a SQL Database elastic pool).
In order to do this, you must either schedule or manually run a script (command line or Powershell, available for download on the DTU calculator website) during a period of a typical production workload.
If you're trying to analyze a large environment, or want to analyze data from specific points in time, this can become a chore. In a lot of cases, many DBAs have some flavor of monitoring tool that is already capturing performance data for them. In many cases, it is probably either already capturing the metrics needed, or can easily be configured to capture the data you need. Today, we're going to look at how to take advantage of SentryOne so we can provide the appropriate data to the DTU calculator.
To start, let's look at the information pulled by the command line utility and PowerShell script available on the DTU calculator website; there are 4 performance monitor counters that it captures:
- Processor – % Processor Time
- Logical Disk – Disk Reads/sec
- Logical Disk – Disk Writes/sec
- Database – Log Bytes Flushed/sec
The first step is determining if these metrics are already captured as part of data collection in SQL Sentry. For discovery, I suggest reading this blog post by Jason Hall, where he talks through how the data is laid out and how you can query it. I am not going to go through each step of this here, but encourage you to read and bookmark that entire blog series.
When I looked through the SentryOne database, I found that 3 of the 4 counters were already being captured by default. The only one that was missing was [Database – Log Bytes Flushed/sec], so I needed to be able to turn that on. There was another blog post by Justin Randall that explains how to do that.
In short, you can query the [PerformanceAnalysisCounter] table.
SELECT ID,
PerformanceAnalysisCounterCategoryID,
PerformanceAnalysisSampleIntervalID,
CounterResourceName,
CounterName
FROM dbo.PerformanceAnalysisCounter
WHERE CounterResourceName = N'LOG_BYTES_FLUSHED_PER_SEC';
You will notice that by default the [PerformanceAnalysisSampleIntervalID] is set to 0 – this means it is disabled. You will need to run the following command to enable this. Just pull the ID from the SELECT query you just ran and use it in this UPDATE:
UPDATE dbo.PerformanceAnalysisCounter
SET PerformanceAnalysisSampleIntervalID = 1
WHERE ID = 166;
After running the update, you will need to restart the SentryOne monitoring service(s) relevant to this target, so that the new counter data can be collected.
Note that I set the [PerformanceAnalysisSampleIntervalID] to 1 so that the data is captured every 10 seconds, however, you could capture this data less often to minimize the size of collected data at the cost of less accuracy. See the [PerformanceAnalysisSampleInterval] table for a list of values that you can use.
Do not expect the data to start flowing into the tables immediately; this will take time to make its way through the system. You can check for population with the following query:
SELECT TOP (100) *
FROM dbo.PerformanceAnalysisDataDatabaseCounter
WHERE PerformanceAnalysisCounterID = 166;
Once you confirm the data is showing up, you should have data for each of the metrics required by the DTU calculator, though you may want to wait top extract it until you have a representative sample from a full workload or business cycle.
If you read through Jason’s blog post, you will see that the data is stored in various rollup tables, and that each of these rollup tables have varying retention rates. Many of these are lower than what I would want if I am analyzing workloads over a period of time. While it may be possible to change these, it may not be the wisest. Because what I am showing you is unsupported, you may want to avoid tinkering too much with SentryOne settings since it could have a negative impact on performance, growth, or both.
In order to compensate for this, I created a script that allows me to extract the data I need for the various rollup tables and stores that data in its own location, so I could control my own retention and not interfere with SentryOne functionality.
TABLE: dbo.AzureDatabaseDTUData
I created a table called [AzureDatabaseDTUData] and stored it in the SentryOne database. The procedure I created will automatically generate this table if it does not exist, so there is no need to do this manually unless you want to customize where it is stored. You can store this in a separate database if you like, you would just need to edit the script in order to do so. The table looks like this:
CREATE TABLE dbo.AzureDatabaseDTUdata
(
ID bigint identity(1,1) not null,
DeviceID smallint not null,
[TimeStamp] datetime not null,
CounterName nvarchar(256) not null,
[Value] float not null,
InstanceName nvarchar(256) not null,
CONSTRAINT PK_AzureDatabaseDTUdata PRIMARY KEY (ID)
);
Procedure: dbo.Custom_CollectDTUDataForDevice
This is the stored procedure that you can use to pull all of the DTU-specific data at one time (provided you have been collecting the log bytes counter for a sufficient amount of time), or schedule it to periodically add to the collected data until you are ready to submit the output to the DTU calculator. Like the table above, the procedure is created in the SentryOne database, but you could easily create it elsewhere, just add three- or four-part names to object references. The interface to the procedure is as follows:
CREATE PROCEDURE [dbo].[Custom_CollectDTUDataForDevice]
@DeviceID smallint = -1,
@DaysToPurge smallint = 14,
-- These define the CounterIDs in case they ever change.
@ProcessorCounterID smallint = 1858, -- Processor (Default)
@DiskReadCounterID smallint = 64, -- Disk Read/Sec (DiskCounter)
@DiskWritesCounterID smallint = 67, -- Disk Writes/Sec (Diskcounter)
@LogBytesFlushCounterID smallint = 166, -- Log Bytes Flushed/Sec (DatabaseCounter)
AS
...
Note: The entire procedure is a little long, so it is attached to this post (dbo.Custom_CollectDTUDataForDevice.sql_.zip).
There are a couple of parameters you can use. Each has a default value, so you do not have to specify them if you are fine with the default values.
- @DeviceID – This allows you to specify if you want to collect data for a specific SQL Server or everything. The default is -1, which means copy all watched SQL Servers. If you only want to export information for a specific instance, then find the
DeviceIDcorresponding to the host in the[dbo].[Device]table, and pass that value. You can only pass one@DeviceIDat a time, so if you want to pass through a set of servers, you can call the procedure multiple times, or you can modify the procedure to support a set of devices. - @DaysToPurge – This represents the age at which you want to remove data. The default is 14 days, meaning that you will only pull data up to 14 days old, and any data older than 14 days in your custom table will be deleted.
The other four parameters are there for future-proofing, in case the SentryOne enums for counter IDs ever changes.
A couple of notes on the script:
- When the data is pulled, it takes the max value from the truncated minute and exports that. This means there is one value per metric per minute, but it is the max value captured. This is important because of the way the data needs to be presented to the DTU calculator.
- The first time you run the export, it may take a little longer. This is because it pulls all the data it can based on your parameter values. Each additional run, the only data extracted is whatever is new since the last run, so should be much faster.
- You will need to schedule this procedure to run on a time schedule that stays ahead of the SentryOne purge process. What I have done is just created a SQL Agent Job to run nightly that collects all the new data since the night before.
- Because the purge process in SentryOne can vary based on metric, you could end up with rows in your copy that do not contain all 4 counters for a time period. You may want to only start analyzing your data from the time you start your extraction process.
- I used a block of code from existing SentryOne procedures to determine the rollup table for each counter. I could have hard-coded the current names of the tables, however, by using the SentryOne method, it should be forward compatible with any changes to the built-in rollup processes.
Once your data is being moved into a standalone table, you can use a PIVOT query to transform it into the form that the DTU calculator expects.
Procedure: dbo.Custom_ExportDataForDTUCalculator
I created another procedure to extract the data into CSV format. The code for this procedure is also attached (dbo.Custom_ExportDataForDTUCalculator.sql_.zip).
There are three parameters:
- @DeviceID – Smallint corresponding to one of the devices you are collecting and that you want to submit to the calculator.
- @BeginTime – Datetime representing the start time, in local time; for example,
'2018-12-04 05:47:00.000'. The procedure will translate to UTC. If omitted, it will collect from the earliest value in the table. - @EndTime – Datetime representing the end time, again in local time; for example,
'2018-12-06 12:54:00.000'. If omitted, it will collect up to the latest value in the table.
An example execution, to get all the data collected for SQLInstanceA between December 4th at 5:47 AM and December 6th at 12:54 PM.
EXEC SentryOne.dbo.custom_ExportDataForDTUCalculator
@DeviceID = 12,
@BeginTime = '2018-12-04 05:47:00.000',
@EndTime = '2018-12-06 12:54:00.000';
The data will need to be exported to a CSV file. Do not be concerned about the data itself; I made sure to output results so that there is no identifying information about your server in the csv file, just dates and metrics.
If you run the query in SSMS, you can right-click and export results; however, you have limited options here and you will have to manipulate the output to get the format expected by the DTU calculator. (Feel free to try and let me know if you find a way to do this.)
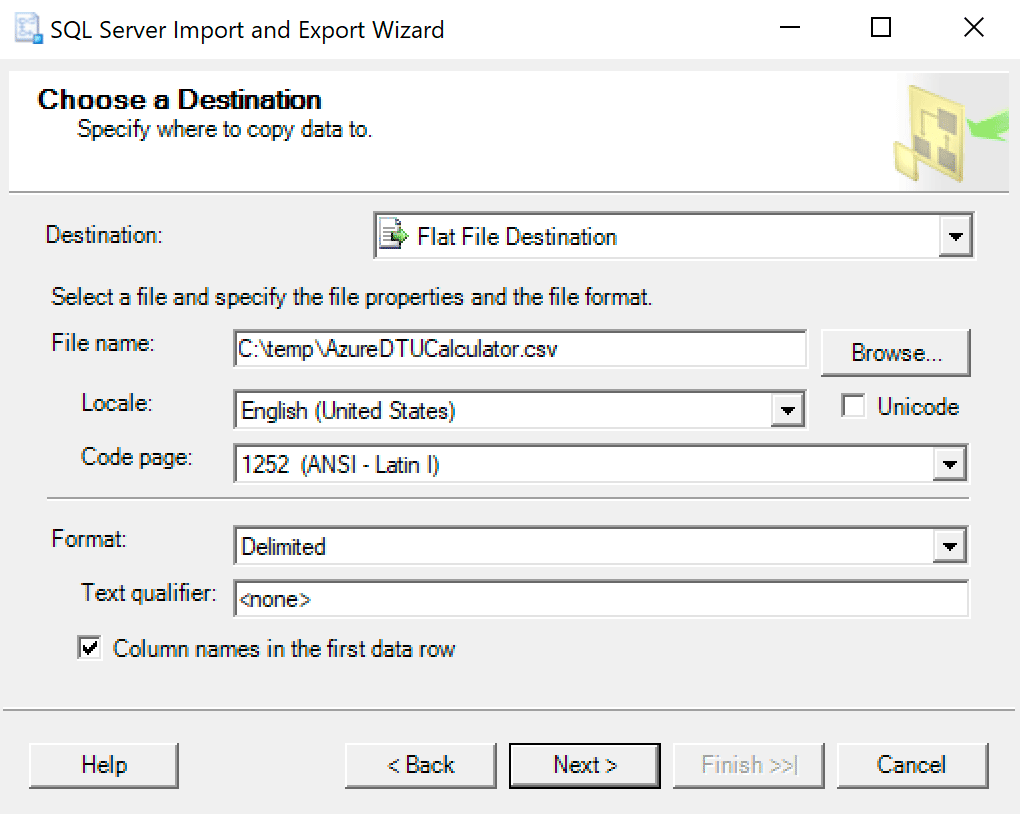
I recommend just using the export wizard baked into SSMS. Right-click on the database and go to Tasks -> Export Data. For your Data Source use “SQL Server Native Client” and point it at your SentryOne database (or wherever you have your copy of the data stored). For your destination, you will want to select “Flat File Destination.” Browse to a location, give the file a name, and save the file as a CSV.
Take care to leave the code page alone; some may return errors. I know that 1252 works fine. The rest of the values leave as default.
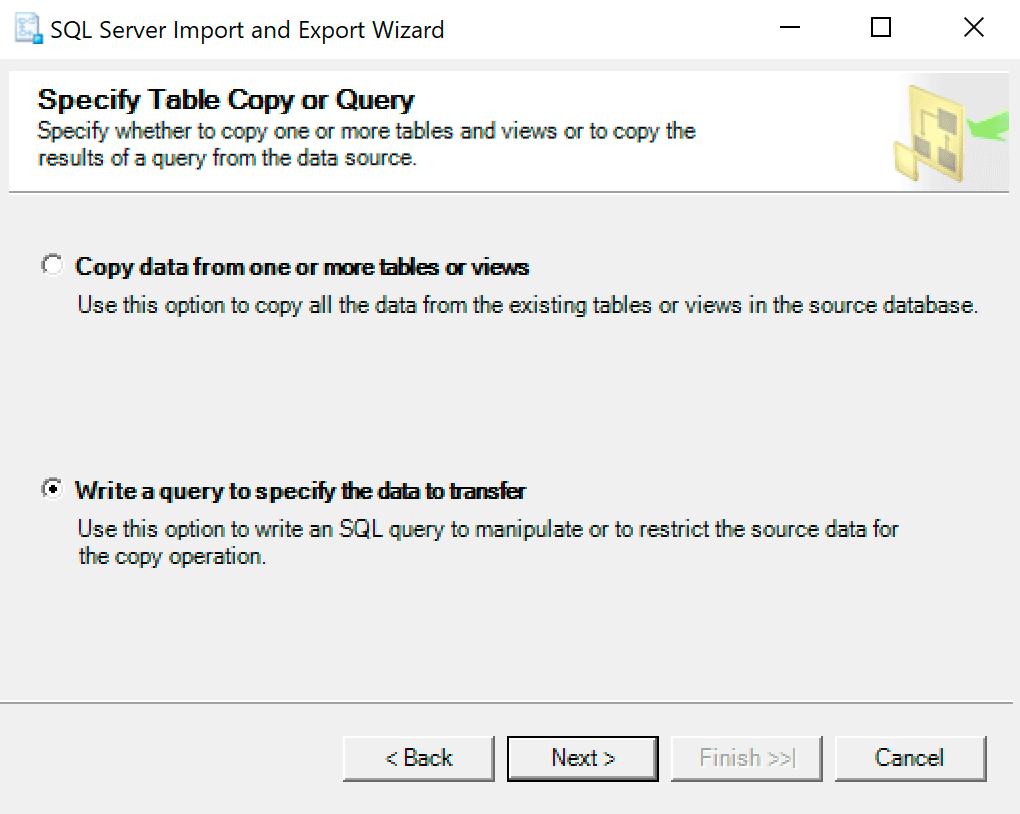
On the next screen, select the option Write a query to specify the data to transfer.
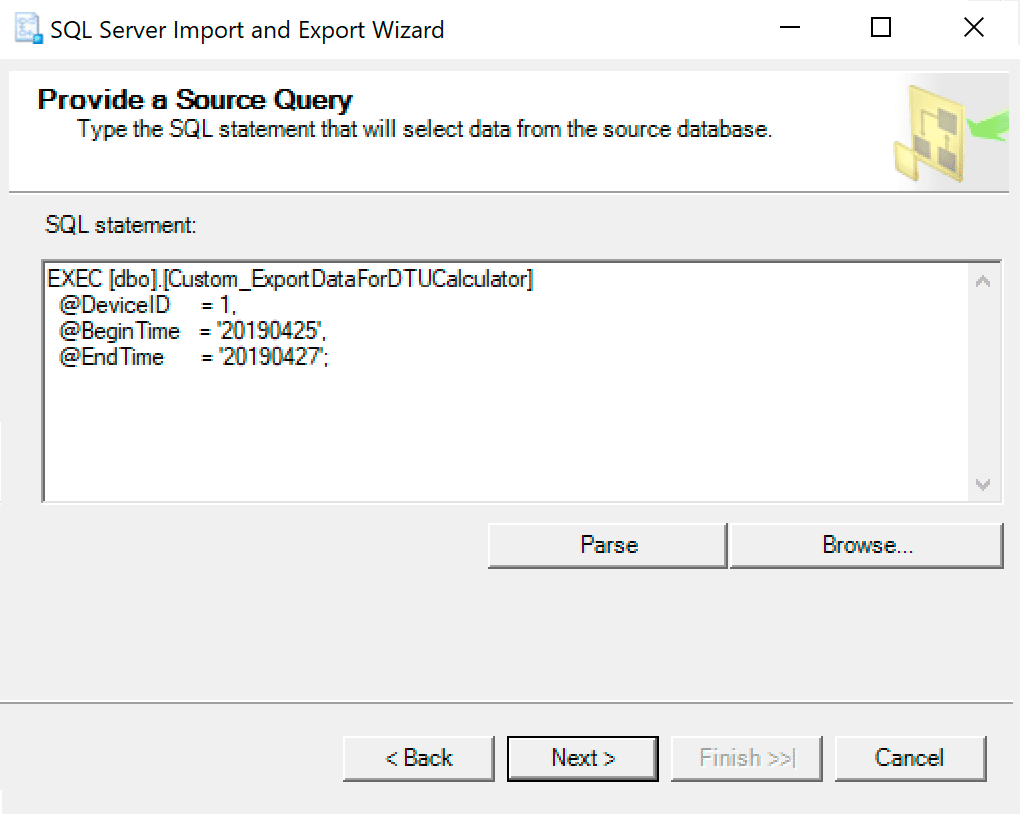
In the next window, copy the procedure call with your parameters set into it. Hit next.
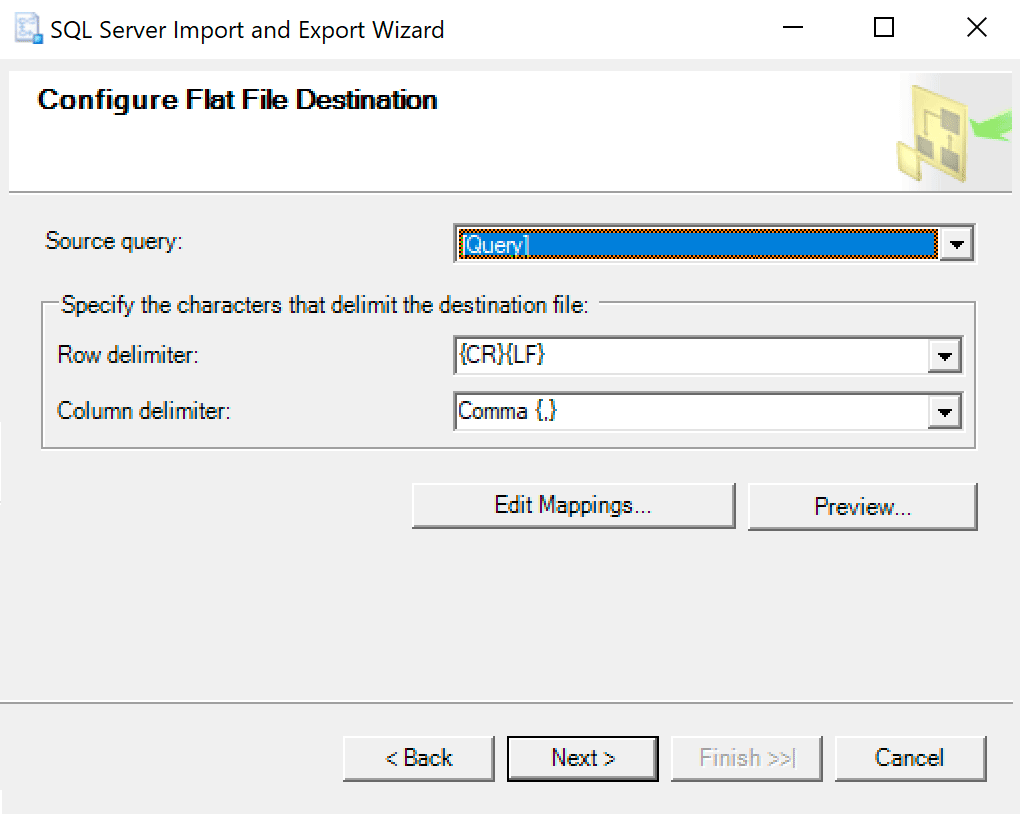
When you get to the Configure Flat File Destination, I leave the options as default. Here is a screenshot in case yours are different:
Hit next and run immediately. A file will be created that you will use on the last step.
NOTE: You could create a SSIS package to use for this and then pass through your parameter values to the SSIS package if you are going to be doing this a lot. This would prevent you from having to go through the wizard each time.
Navigate to the location where you saved the file and verify it is there. When you open it, it should look something like this:
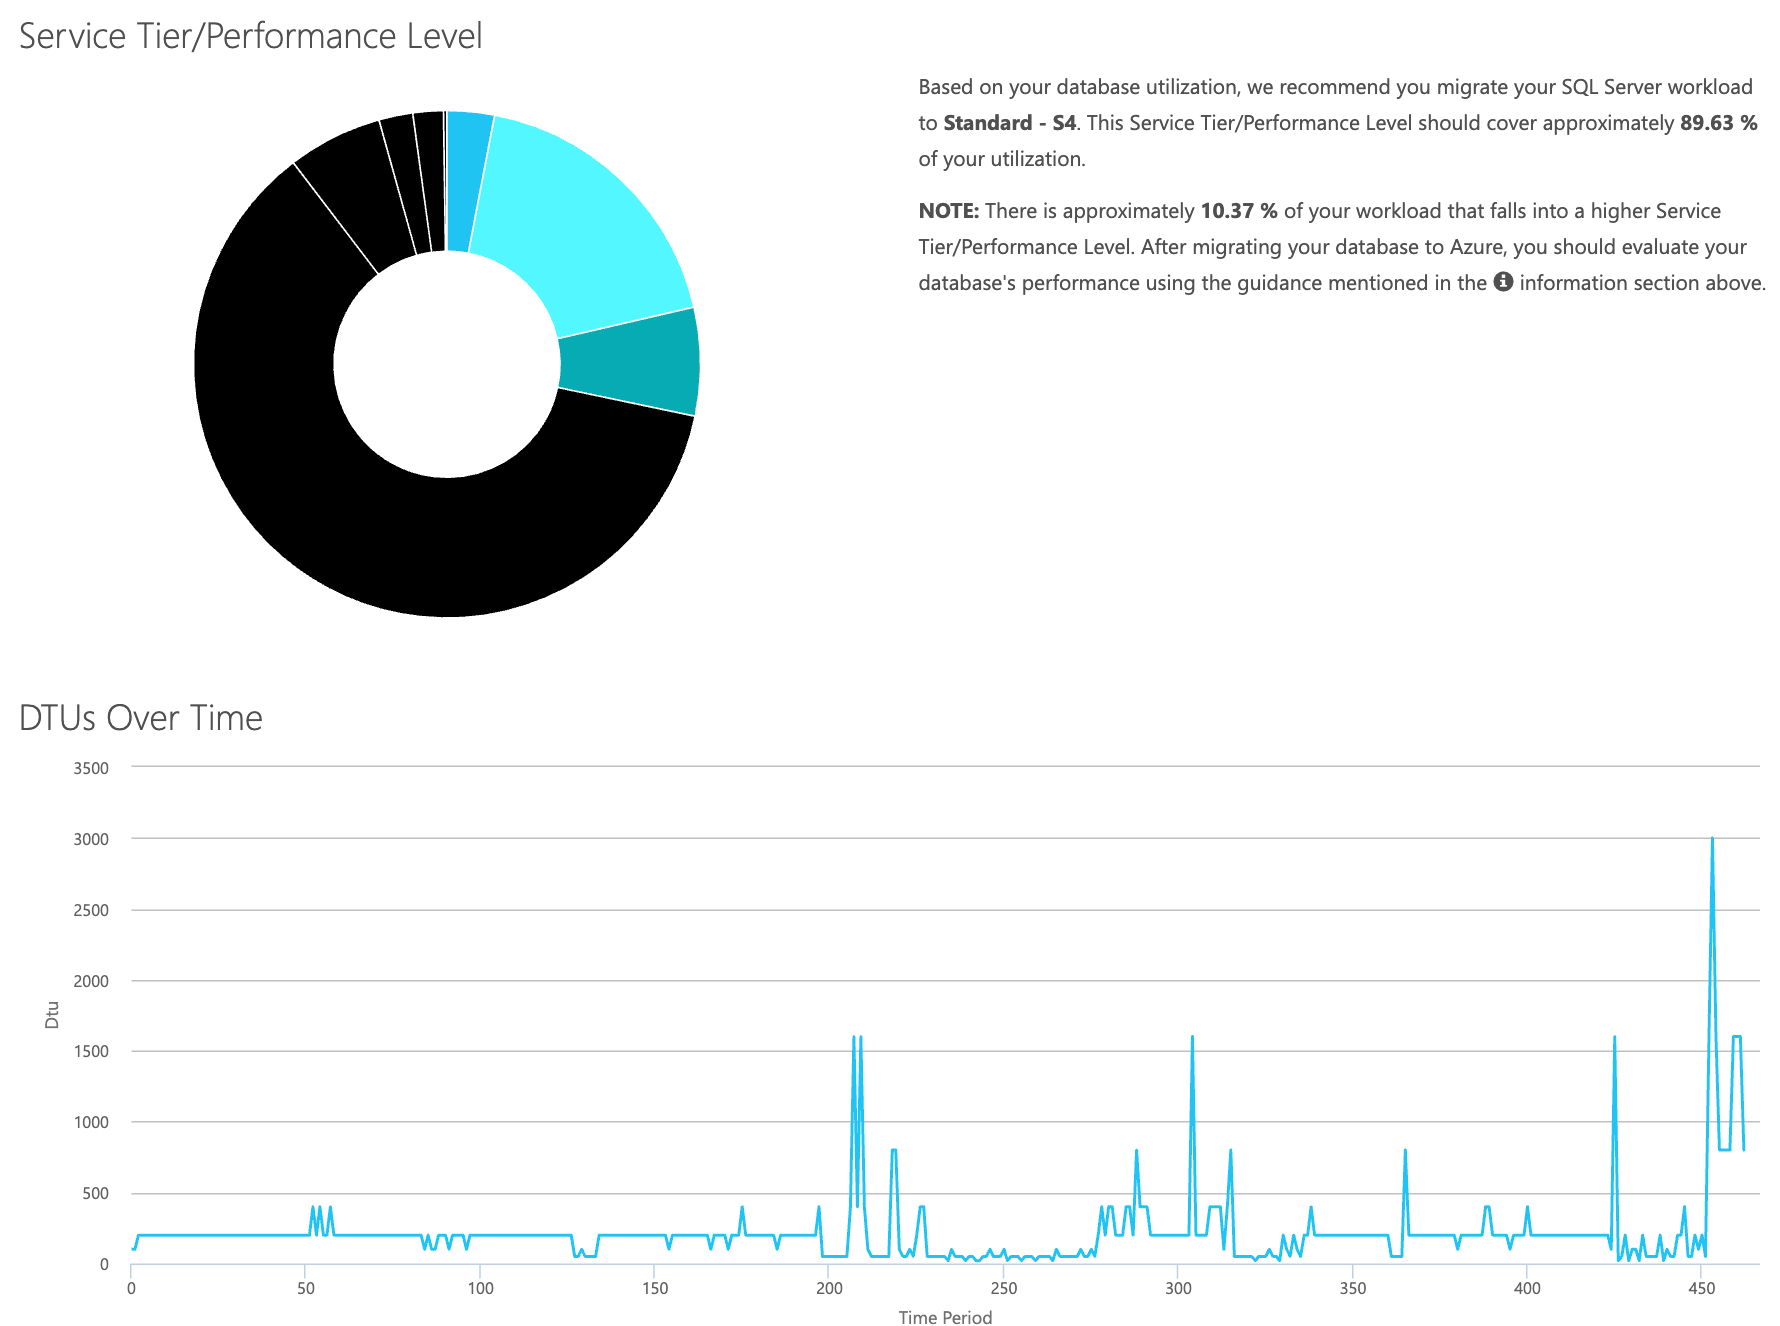
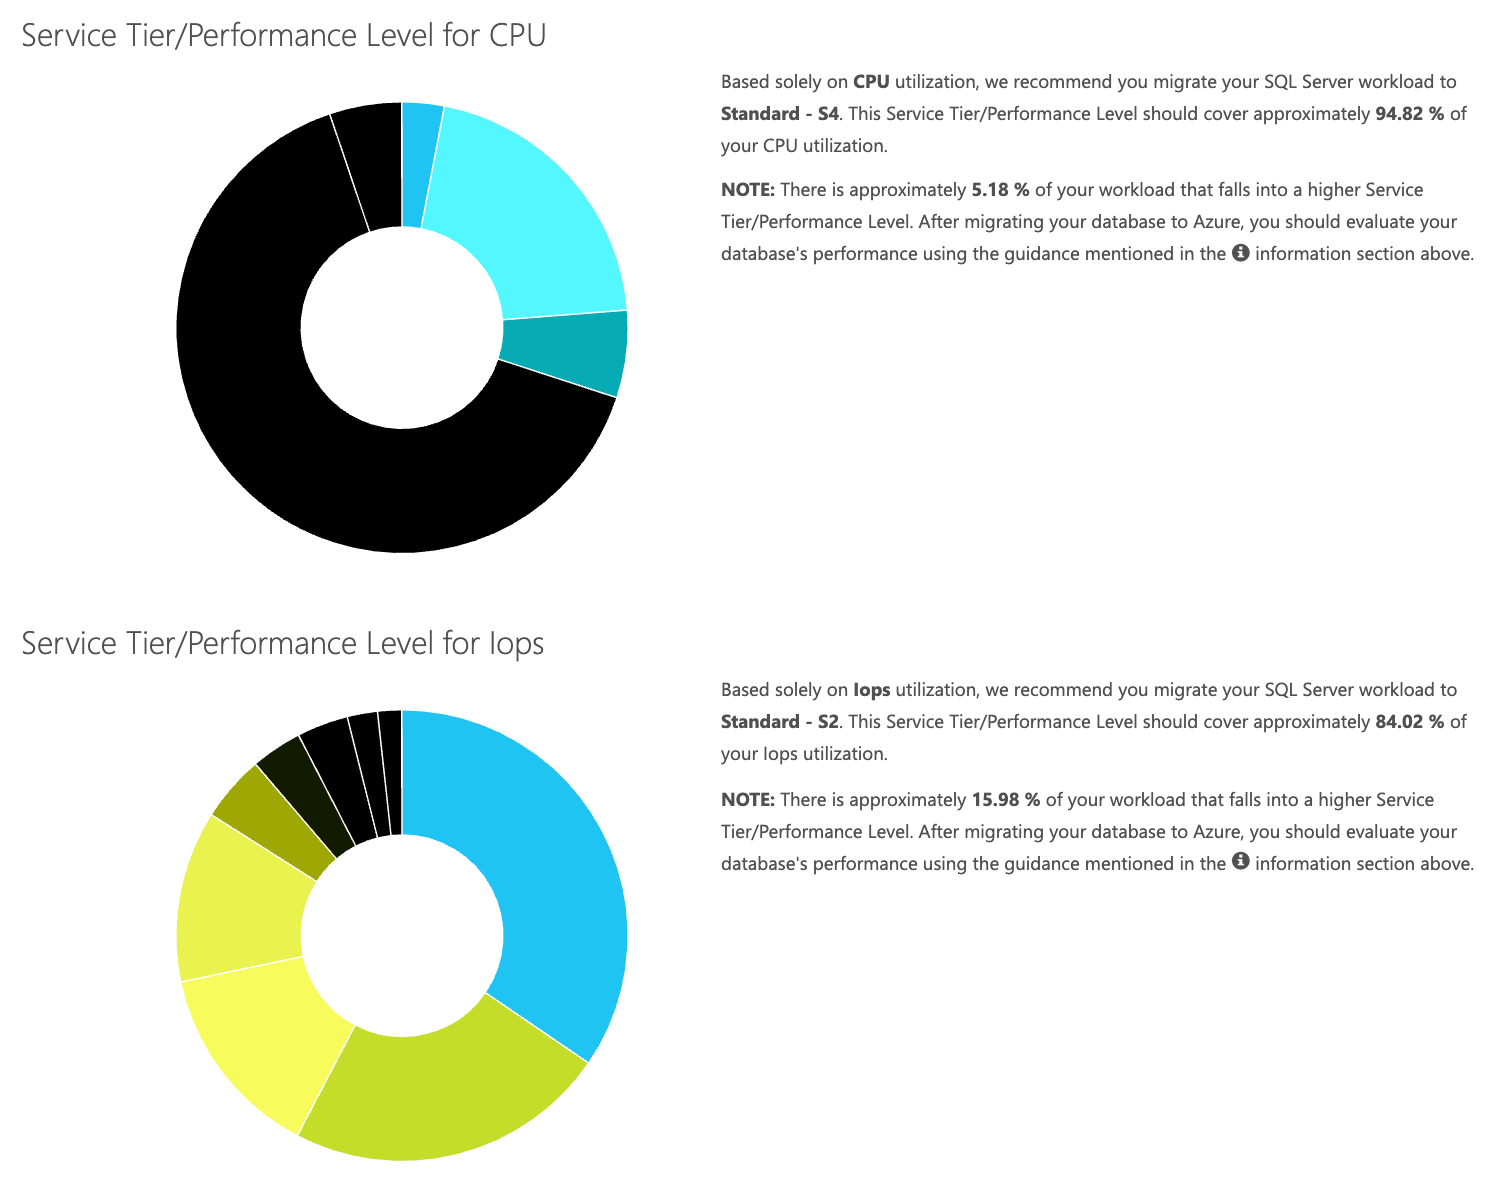
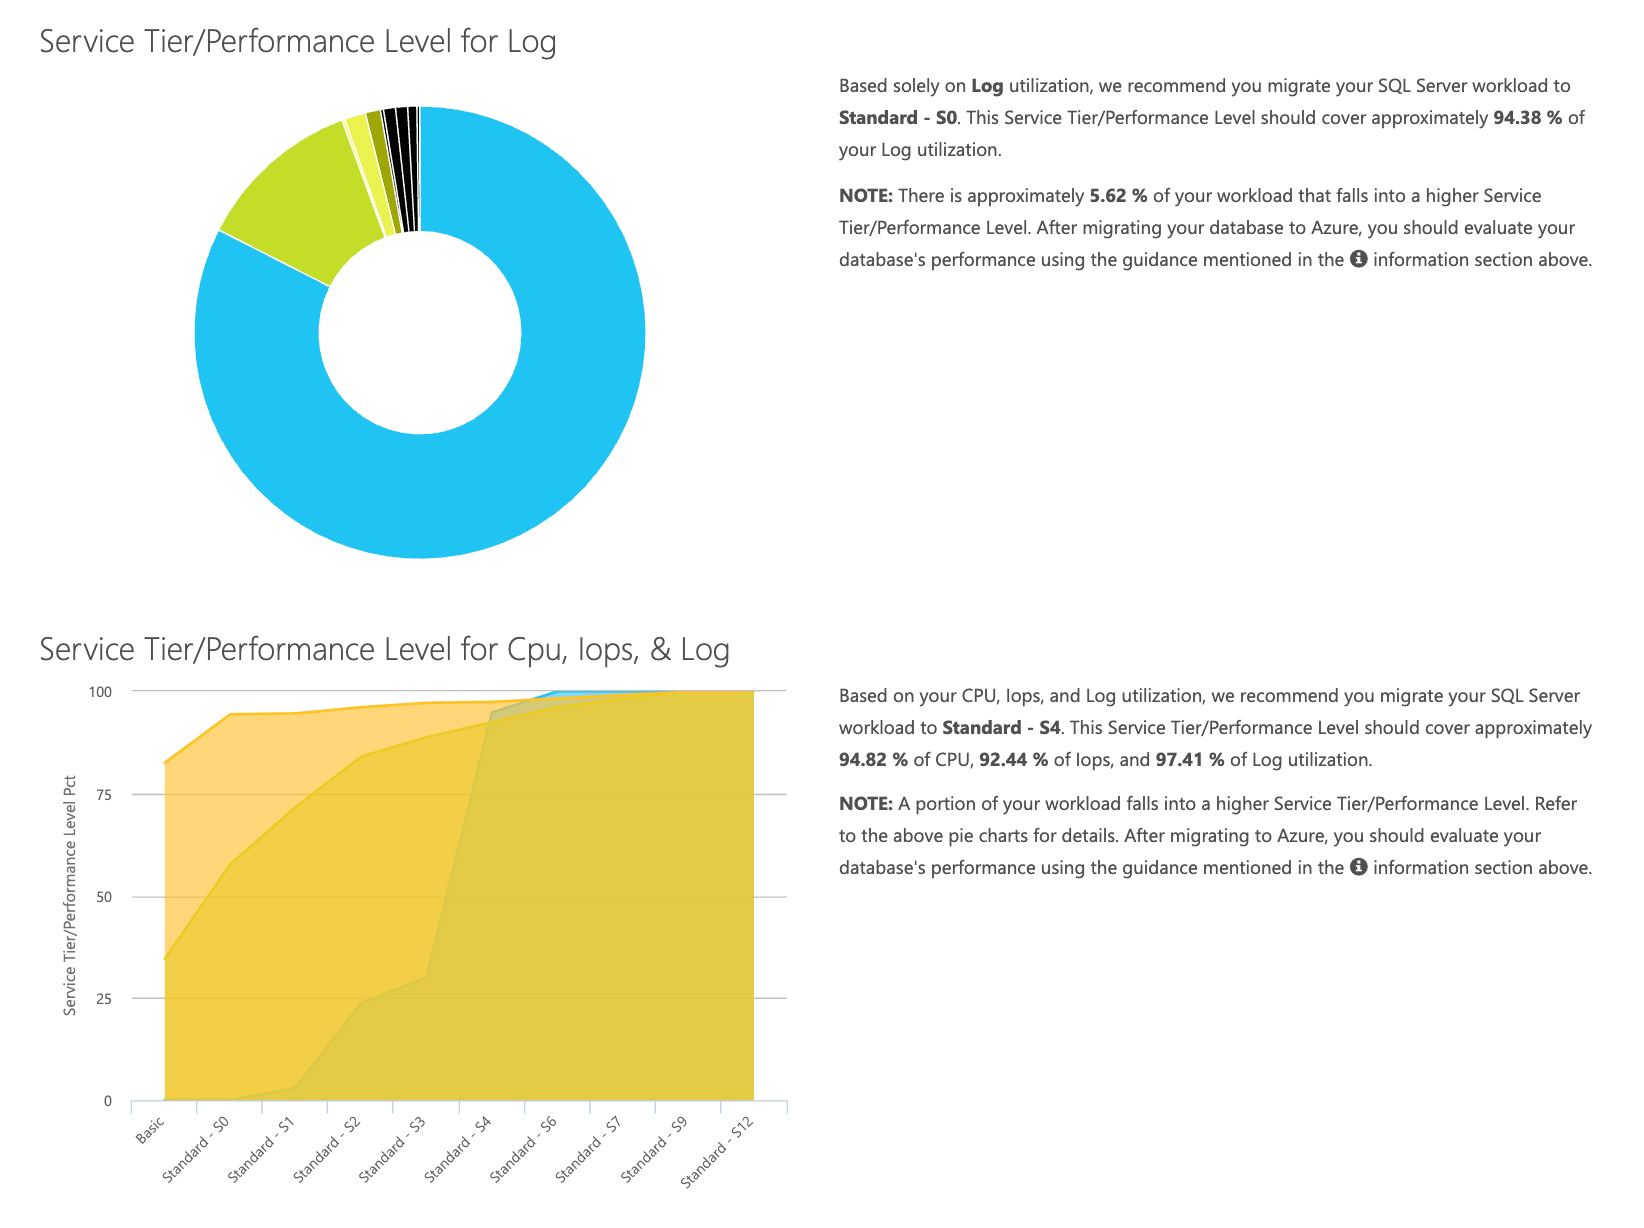
Open the DTU calculator web site, and scroll down to the portion that says, “Upload the CSV file and Calculate.” Enter the number of Cores that the server has, upload the CSV file, and click Calculate. You'll get a set of results like this (click any image to zoom):
Since you have the data being stored separately, you can analyze workloads from varying times, and you can do this without having to manually run\schedule the command utility\powershell script for any server you are already using SentryOne to monitor.
To briefly recap the steps, here is what needs to be done:
- Enable the [Database – Log Bytes Flushed/sec] counter, and verify the data is being collected
- Copy the data from the SentryOne tables into your own table (and schedule that where appropriate).
- Export the data from new table in the right format for the DTU calculator
- Upload the CSV to the DTU Calculator
For any server/instance you are considering migrating to the cloud, and that you are currently monitoring with SQL Sentry, this is a relatively pain-free way to estimate both what type of service tier you'll need and how much that will cost. You'll still need to monitor it once it's up there though; for that, check out SentryOne DB Sentry.
About the Author
 Dustin Dorsey is currently the Managing Database Engineer for LifePoint Health in which he leads a team responsible for managing and engineering solutions in database technologies for 90 hospitals. He has been working with and supporting SQL Server predominantly in healthcare since 2008 in an administration, architecture, development, and BI capacity. He is passionate about finding ways to solve problems that plague the everyday DBA and loves sharing this with others. He can be found speaking at SQL community events, as well as blogging at DustinDorsey.com.


