
What the heck is a DTU?

Guest Author : Andy Mallon (@AMtwo)
No, seriously. What is a DTU?
When you're deploying any application, one of the first questions that comes up is "What will this cost?" Most of us have gone through this sort of exercise for sizing a SQL Server installation at some point, but what if you're deploying to the cloud? With Azure IaaS deployments, not much has changed–you're still building a server based on CPU count, some amount of memory, and configuring storage to give you enough IOPS for your workload. However, when you make the jump to PaaS, Azure SQL Database is sized with different service tiers, where performance is measured in DTUs. What the heck is a DTU?
I know what a BTU is. Perhaps DTU stands for Database Thermal Unit? Is it the amount of processing power needed to raise the temperature of the data center by one degree? Instead of guessing, let's check the documentation, and see what Microsoft has to say:
OK, that was my second guess–but what is the "blended measure"? How can I translate what I know about sizing a server into sizing an Azure SQL Database? Unfortunately, there's no straightforward way to translate "2 CPU cores, and 4GB memory" into a DTU measurement.
Isn't there a DTU Calculator?
Yes! Microsoft does give us a DTU Calculator to estimate the proper service tier of Azure SQL Database. To use it, you download and run a PowerShell script (sql-perfmon.ps1) on the server while running a workload in SQL Server. The script outputs a CSV which contains four perfmon counters: (1) total % processor time, (2) total disk reads/second, (3) total disk writes per second, and (4) total log bytes flushed/second. This CSV output is then uploaded to the DTU Calculator, which estimates what service tier will best meet your needs. The only data that the DTU Calculator takes in addition to the CSV is the number of CPU cores on the server that generated the file. The DTU Calculator is still a bit of a black box–it's not easy to map what we know from our on-premises databases into Azure.
I'd like to point out that the definition of a DTU is that it's "a blended measure of CPU, memory, and data I/O and transaction log I/O…" None of the perfmon counters used by the DTU Calculator take memory into account, but it is clearly listed in the definition as being part of the calculation. This isn't necessarily a problem, but it is evidence that the DTU Calculator isn't going to be perfect.
I'll upload some synthetic load into the DTU Calculator, and see if I can figure out how that black box works. In fact, I'll fabricate the CSVs completely so that I can totally control the perfmon numbers that we load into the DTU Calculator. Let's step through one metric at a time. For each metric, we'll upload 25 minutes (1500 seconds–I like round numbers) worth of fabricated data, and see how that perfmon data is converted to DTUs.
CPU
I'm going to create a CSV that simulates a 16-core server, slowly ramping up CPU utilization until it's pegged at 100%. Since I am going to simulate the ramp-up on a 16-core server, I'll create my CSV to step up 1/16th at a time–essentially simulating one core maxing out, then a second maxing out, then the third, etc. All the while, the CSV will show zero reads, writes and log flushes. A server would never actually generate a workload like this–but that's the point. I'm isolating the CPU utilization completely so that I can see how CPU affects DTUs.
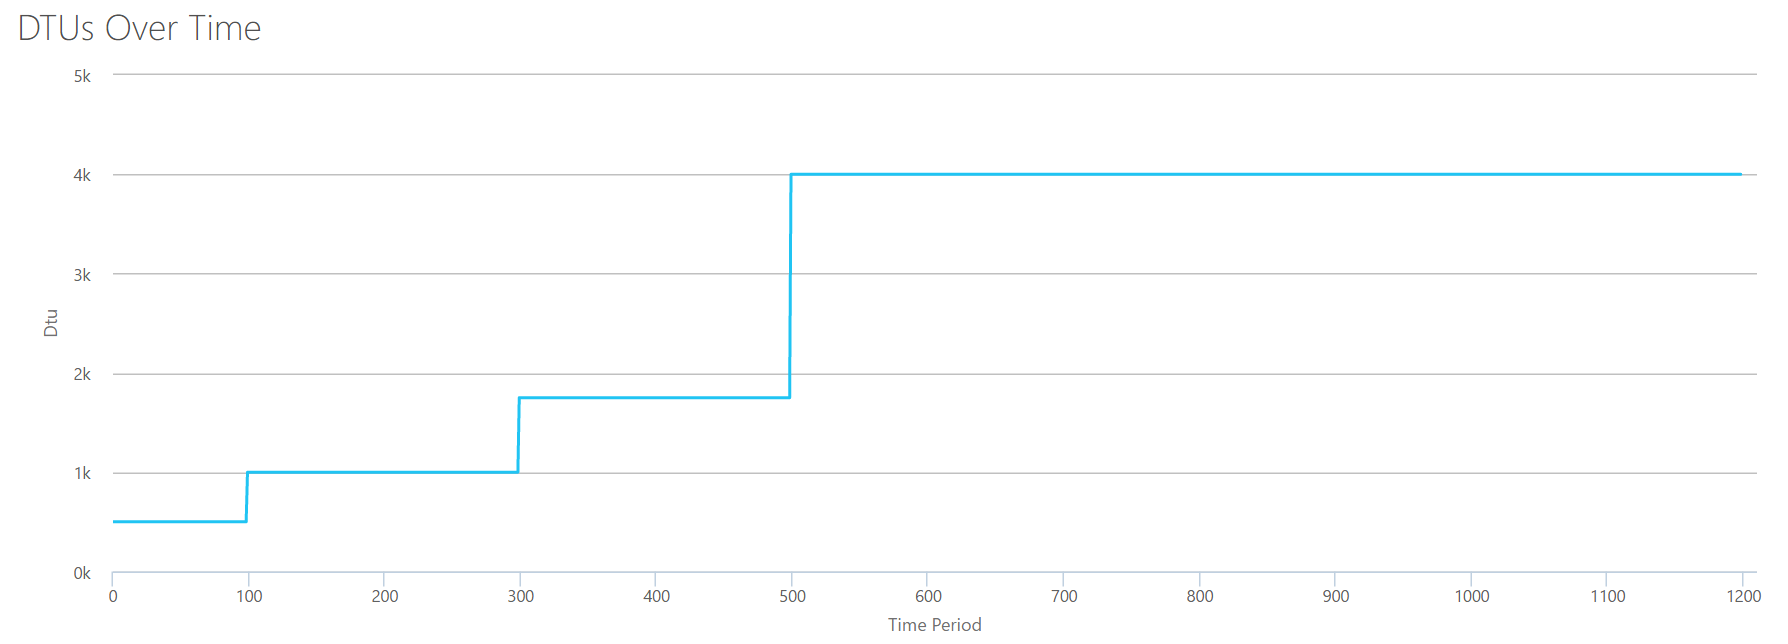
I'll create a CSV file that has one row per second, and every 94 seconds, I'll increase the Total % processor time counter by ~6%. The other three counters will be zero in all cases. Now, I upload this file to the DTU Calculator (and tell the DTU Calculator to consider 16 cores), and here's the output:
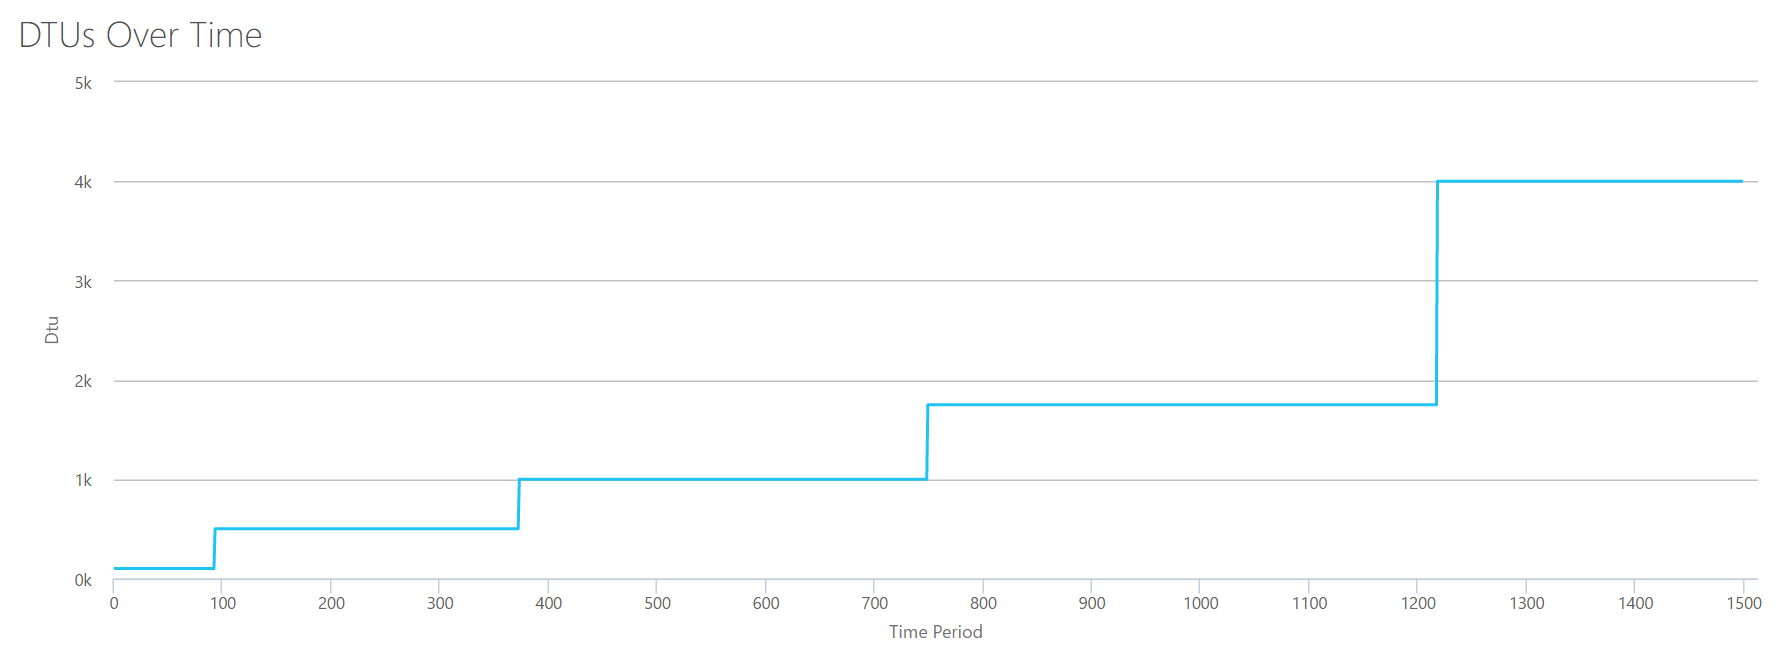
Wait? Didn't I step up CPU utilization in 16 even steps? This DTU graph only shows five steps. I must have messed up. Nope–my CSV had 16 even steps, but that (apparently) doesn't translate evenly into DTUs. At least not according to the DTU Calculator. Based on our maxed-out CPU test, our CPU-to-DTU-to-Service Tier mapping would look like this:
| Number Cores | DTUs | Service Tier |
|---|---|---|
| 1 | 100 | Standard – S3 |
| 2-4 | 500 | Premium – P4 |
| 5-8 | 1000 | Premium – P6 |
| 9-13 | 1750 | Premium – P11 |
| 14-16 | 4000 | Premium – P15 |
Looking at this data tells us a few things:
- One CPU core, 100% utilized equals 100 DTUs.
- DTUs increase kinda linearly as CPU increases, but seemingly in fits and spurts.
- The Basic and Standard service tiers are equal to less than a single CPU core.
- Any Multi-core server would translate to some size within the Premium service tier.
Reads
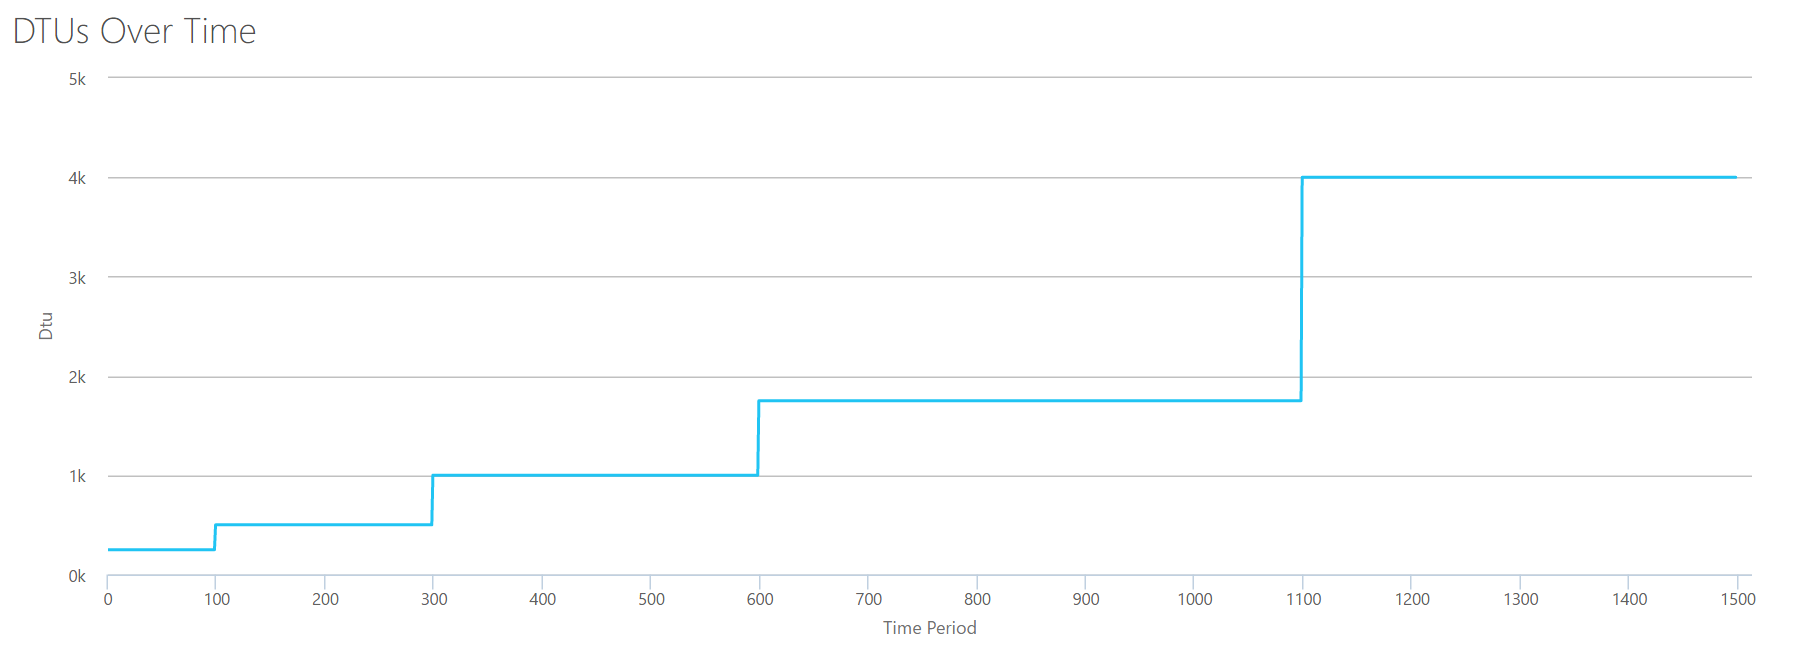
This time, I am going to use the same methodology. I will generate a CSV with increasing numbers for the reads/second counter, with the other perfmon counters at zero. I will slowly step up the number over time. This time, lets step up in chunks of 2000, every 100 seconds, until we hit 30000. This gives us the same 25-minute total time–however, this time I have 15 steps instead of 16. (I like round numbers.)
When we upload this CSV to the DTU calculator, it gives us this DTU graph:

Wait a second…that looks pretty similar to the first graph. Again, it's stepping up in 5 uneven increments, even though I had 15 even steps in my file. Let's look at it in a tabular format:
| Reads/sec | DTUs | Service Tier |
|---|---|---|
| 2000 | 250 | Premium – P2 |
| 4000-6000 | 500 | Premium – P4 |
| 8000-12000 | 1000 | Premium – P6 |
| 14000-22000 | 1750 | Premium – P11 |
| 24000-30000 | 4000 | Premium – P15 |
Again, we see that the Basic & Standard tiers are jumped over pretty quickly (less than 2000 reads/sec), but then the Premium tier is pretty wide, spanning 2000 to 30000 reads per second. In the above table, the "Reads/sec" could probably be thought of as "IOPS" … Or, technically, just "OPS" since there are no writes to constitute the "input" part of IOPS.
Writes
If we create a CSV using the same formula that we used for Reads, and upload that CSV to the DTU Calculator, we'll get a graph that is identical to the graph for Reads:
IOPS are IOPS, so whether it's a read or a write, it looks like the DTU calculation considers it equally. Everything we know (or think we know) about reads seem to apply equally to writes.
Log bytes flushed
We're up to the last perfmon counter: log bytes flushed per second. This is another measure of IO, but specific to the SQL Server transaction log. In case you haven't caught on by now, I'm creating these CSVs so that the high values will be calculated as a P15 Azure DB, then simply dividing the value to break it into even steps. This time, we're going to step from 5 million to 75 million, in steps of 5 million. As we did on all prior tests, the other perfmon counters will be zero. Since this perfmon counter is in bytes per second, and we're measuring in millions, we can think of this in the unit we're more comfortable with: Megabytes per second.
We upload this CSV to the DTU calculator, and we get the following graph:
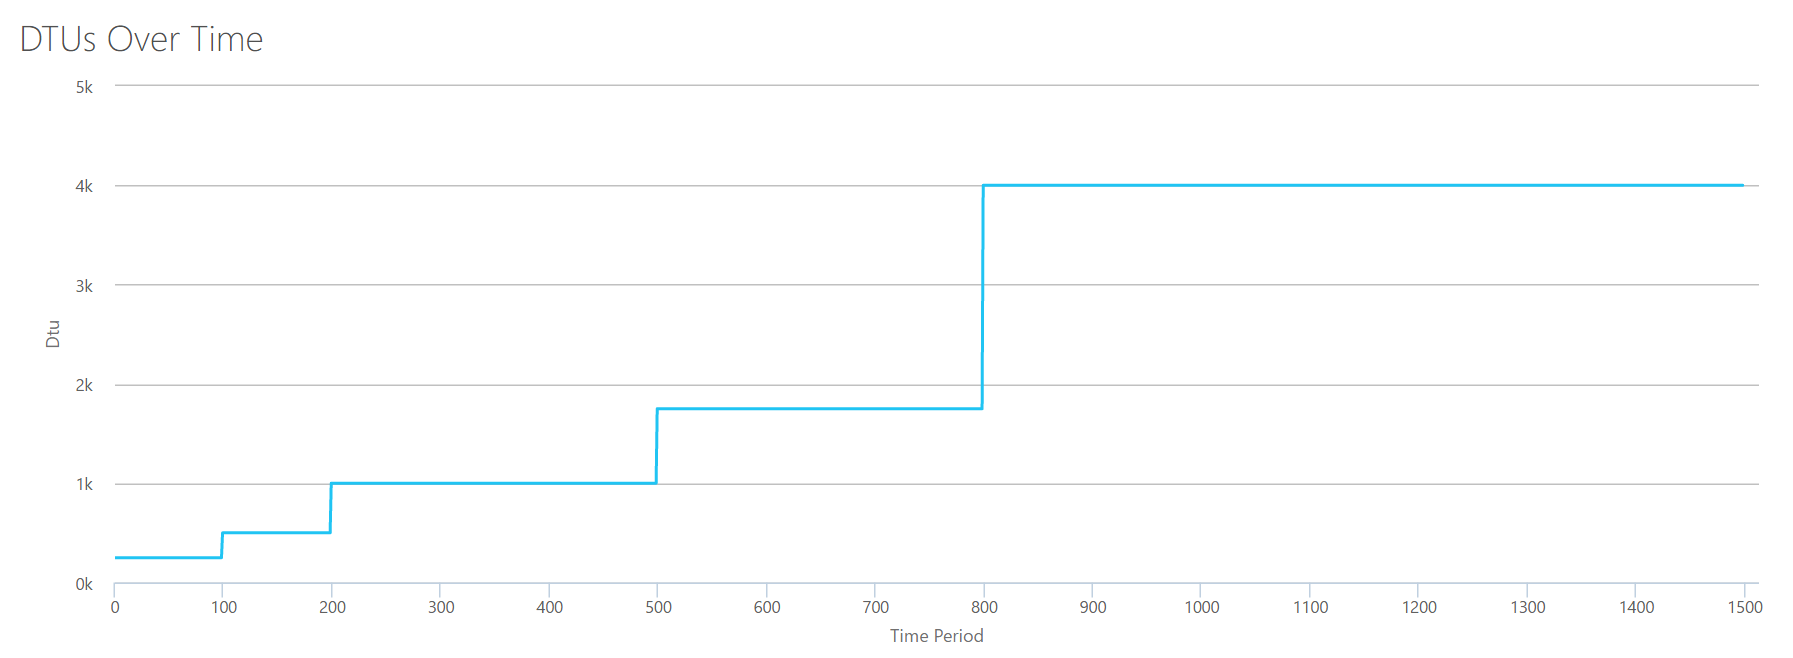
| Log Megabytes flushed/sec | DTUs | Service Tier |
|---|---|---|
| 5 | 250 | Premium – P2 |
| 10 | 500 | Premium – P4 |
| 15-25 | 1000 | Premium – P6 |
| 30-40 | 1750 | Premium – P11 |
| 45-75 | 4000 | Premium – P15 |
The shape of this graph is getting pretty predictable. Except this time, we step up through the tiers a little bit faster, hitting P15 after only 8 steps (compared to 11 for IO and 12 for CPU). This might lead you to think, "This is going to be my narrowest bottleneck!" but I wouldn't be so sure of that. How often are you generating 75MB of log in a second? That's 4.5GB per minute. That's a lot of database activity. My synthetic workload isn't necessarily a realistic workload.
Combining everything
OK, now that we've seen where some of the upper limits are in isolation, I'm going to combine the data and see how they compare when CPU, I/O, and transaction log IO are all happening at once–after all, isn't that how things actually happen?
To build this CSV, I simply took the the existing values we used for each individual test above, and combined those values into a single CSV, which yields this lovely graph:
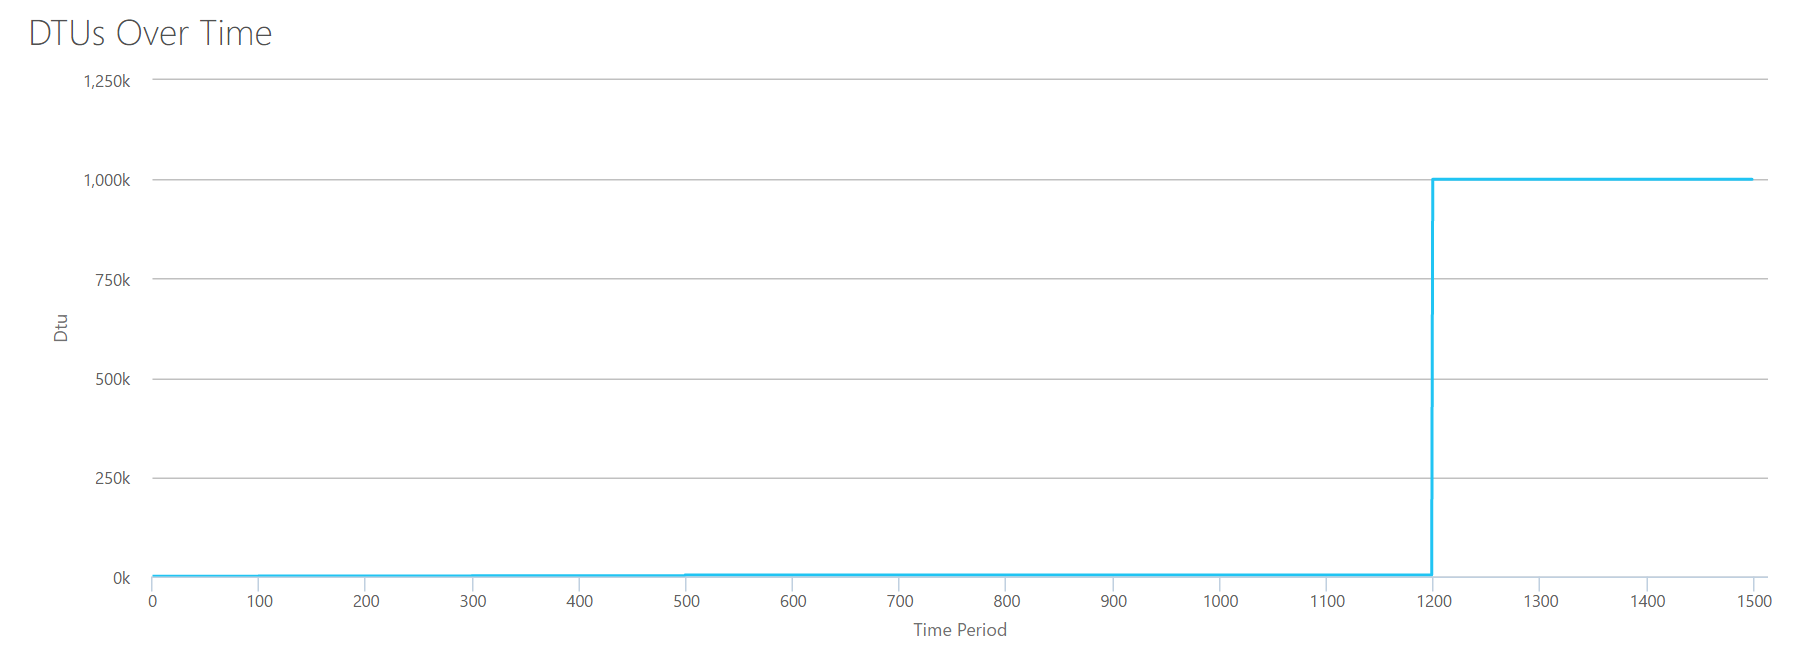
It also yields the message:
If you look at the Y-axis, you'll see we hit "1,000k" (ie 1 million) DTUs at the 1200 second mark. That seems…uhh…wrong? If we look at the above tests, the 1200 second mark was when all 4 individual metrics hit the mark for 4000 DTU, P15 tier. It makes sense that we would be out of range, but the shape of the graph doesn't quite make sense to me–I think the DTU calculator just threw up it's hands and said, "Whatever, Andy. It's a lot. It's too much. It's a bajillion DTUs. This workload doesn't fit for Azure SQL Database."
OK, so what happens before the 1200 second mark? Lets cut down the CSV and resubmit it to the calculator with only the first 1200 seconds. The max values for each column are: 81% CPU (or apx 13 cores at 100%), 24000 reads/sec, 24000 writes/sec, and 60MB log flushed/sec.
Hello, old friend… That familiar shape is back again. Here's a summary of the data from the CSV, and what the DTU Calculator estimates for total DTU Usage and service tier.
| Number Cores | Reads/sec | Writes/sec | Log Megabytes flushed/sec | DTUs | Service Tier |
|---|---|---|---|---|---|
| 1 | 2000 | 2000 | 5 | 500 | Premium – P4 |
| 2-3 | 4000-6000 | 4000-6000 | 10 | 1000 | Premium – P6 |
| 4-5 | 8000-10000 | 8000-10000 | 15-25 | 1750 | Premium – P11 |
| 6-13 | 12000-24000 | 12000-24000 | 30-40 | 4000 | Premium – P15 |
Now, let's look at how the individual DTU calculations (when we evaluated them in isolation) compare to the DTU calculations from this most recent check:
| CPU DTUs | Read DTUs | Write DTUs | Log flush DTUs | Sum Total DTUs | DTU Calculator estimate | Service Tier |
|---|---|---|---|---|---|---|
| 100 | 250 | 250 | 250 | 850 | 500 | Premium – P4 |
| 500 | 500 | 500 | 500 | 2000 | 1000 | Premium – P6 |
| 500-1000 | 1000 | 1000 | 1000 | 3500-4000 | 1750 | Premium – P11 |
| 1000-1750 | 1000-1750 | 1000-1750 | 1750 | 4750-7000 | 4000 | Premium – P15 |
You'll notice that the DTU calculation isn't as simple as adding up your separate DTUs. As the definition I quoted at the start states, it is a "blended measure" of those separate metrics. The formula used for "blending" is complicated, and we don't actually have that formula. What we can see is that the DTU Calculator estimates are lower than the sum of the separate DTU calculations.
Mapping DTUs to traditional hardware
Let's take the data from the DTU Calculator, and try to put together some guesses for how traditional hardware might map to some Azure SQL Database tiers.
First, let's assume that "reads/sec" and "writes/sec" translate to IOPS directly, with no translation needed. Second, let's assume that adding these two counters will give us our total IOPS. Third, let's admit we have no idea what memory usage is, and we have no way to make any conclusions on that front.
While I'm estimating hardware specs, I'll also pick a possible Azure VM size that would fit each hardware configuration. There are many similar Azure VM sizes, each optimized for different performance metrics, but I've gone ahead and limited my picks to the A-Series and DSv2-Series.
| Number Cores | IOPS | Memory | DTUs | Service Tier | Comparable Azure VM Size |
|---|---|---|---|---|---|
| 1 core, 5% utilization | 10 | ??? | 5 | Basic | Standard_A0, barely used |
| <1 core | 150 | ??? | 100 | Standard S0-S3 | Standard_A0, not fully utilized |
| 1 core | up to 4000 | ??? | 500 | Premium – P4 | Standard_DS1_v2 |
| 2-3 cores | up to 12000 | ??? | 1000 | Premium – P6 | Standard_DS3_v2 |
| 4-5 cores | up to 20000 | ??? | 1750 | Premium – P11 | Standard_DS4_v2 |
| 6-13 | up to 48000 | ??? | 4000 | Premium – P15 | Standard_DS5_v2 |
The Basic tier is incredibly limited. It's good for occasional/casual use, and it's a cheap way to "park" your database when you aren't using it. But if you're running any real application, the Basic tier isn't going to work for you.
The Standard Tier is pretty limited, too, but for small applications, it's capable of meeting your needs. If you have a 2-core server running a handful of databases, then those databases individually might fit into the Standard tier. Similarly, if you have a server with only one database, running 1 CPU core at 100% (or 2 cores running at 50%), it is probably just enough horsepower to tip the scale into the Premium-P1 service tier.
If you would be using a multi-core server in an on-premises (or IaaS), then you would be looking within the Premium service tier on Azure SQL Database. It's just a matter of determining how much CPU & I/O horsepower you need for your workload. Your 2-core, 4GB server probably lands you somewhere around a P6 Azure SQL DB. In a pure CPU workload (with zero I/O), a P15 database could handle 16 cores worth of processing, but once you add IO to the mix, anything larger than ~12 cores doesn't fit into Azure SQL Database.
Next time, I'll take some actual workloads, and compare performance across service tiers. Will the DTU Calculator's estimates be accurate? We'll find out.
About the Author
 Andy Mallon is a SQL Server DBA and Microsoft Data Platform MVP that has managed databases in the healthcare, finance, e-commerce, and non-profit sectors. Since 2003, Andy has been supporting high-volume, highly-available OLTP environments with demanding performance needs. Andy is the founder of BostonSQL, co-organizer of SQLSaturday Boston, and blogs at am2.co.
16 thoughts on “What the heck is a DTU?”
Comments are closed.

Nice article.Microsoft should provide the chart you derived ,instead of those confusing DTUs
Nice one. I was thinking about doing this for my company. The supplier we are using seems to have no clue on how to estimate DTUs for the app we are migrating. Great work.
The biggest problem with the DTU calculator is that the script makes the massive assumption that the server you are running it against only runs a single database, and its that single database you wish to migrate
Nice article. I appreciate the effort and level of details. As a trainer I'll point out your article tho my students.
There is one catch, though: the performance counters are for the server, not for just a database. If you have multiple DBs in the same insurance your DTU estimations will account for the hole server.
Although an Azure SQL database can handle multiple DBs, one had the option of creating multiple servers and spread out the work load. It would be more expensive, though. Granted.
This is definitely a limitation of the DTU Calculator. It uses server-level perfmon counters. As pointed out in another comment, the DTU Calculator assumes that your server is running only SQL Server, and that the workload is all geared towards a single database. And it doesn't take memory utilization into account at all. This all goes back to the fact that the DTU Calculator is just a rough estimate of what service tier you might need to run your database.
Typo corrention: not insurance but instance.
Don't write long texts on cellphone. :)
I think it's worth pointing out that Microsoft does NOT provide the DTU Calculator per se, but by a Solutions Arch that works for them (Justin Henriksen). At least that's how it appears.
I have just found this when searching for a comparative explanation of DTUs – pure gold. Thank you!
awesome work!! thanks.
So, here is a real kicker. Customer of ours wants to move an Access database from a local shared resource, to SQL in the cloud. How the heck are we supposed to measure for this?
Forget the cloud for a second. If you are moving from Access to SQL Server, how do you estimate your hardware needs? There's no magic formula for that either.
Andy,
Great work! You mentioned at the end you were going to follow this up by benchmarking some actual workloads. Has that work been completed?
Hi, I'm new with azure and I have a doubt:
If your calculations(and my interpretation) are correct, why someone will pay 3.000 $/month for a PremiumP6, instead of the equivalent Virtual Machine "Standard_DS3_v2" that costs 400 euros?
Thanks for the article and help.
Great article , i think this article should be sent to Microsoft and ask for their comments. Thanks for sharing this.
Using the dtucalculator with the following csv file with CPU at 99%, I have a different result, 32 cores returns P15 recommendation and 33 cores are out of range. Do I missing something?
Interval,% Processor Time,Disk Reads/sec,Disk Writes/sec,Log Bytes Flushed/sec
12/4/2017 20:04,99,0,0,0
12/4/2017 20:04,99,0,0,0
12/4/2017 20:04,99,0,0,0
Probably this is obvious to most, but for this article, when you say 1 traditional cpu core, should we assume that hyperthreading is disabled such that 1 cpu core is presented as 1 logical processor to Sql Server?
Do most people leave HT enabled for Sql Server as the end of this article (Dan Guzman, 2015) seems to suggest?
http://www.dbdelta.com/sql-server-and-hyper-threading/