
Impact of Fragmentation on Execution Plans
Index fragmentation removal and prevention has long been a part of normal database maintenance operations, not only in SQL Server, but across many platforms. Index fragmentation affects performance for a lot of reasons, and most people talk about the effects of random small blocks of I/O that can happen physically to disk based storage as something to be avoided. The general concern around index fragmentation is that it affects the performance of scans through limiting the size of read-ahead I/Os. It’s based on this limited understanding of the problems that index fragmentation cause that some people have begun circulating the idea that index fragmentation doesn’t matter with Solid State Storage devices (SSDs) and that you can just ignore index fragmentation going forward.
However, that is not the case for a number of reasons. This article will explain and demonstrate one of those reasons: that index fragmentation can adversely impact execution plan choice for queries. This occurs because index fragmentation generally leads to an index having more pages (these extra pages come from page split operations, as described in this post on this site), and so the use of that index is deemed to have a higher cost by SQL Server’s query optimizer.
Let’s look at an example.
The first thing that we need to do is build an appropriate test database and data set to use for examining how index fragmentation can impact query plan choice in SQL Server. The following script will create a database with two tables with identical data, one heavily fragmented and one minimally fragmented.
USE master;
GO

DROP DATABASE FragmentationTest;
GO

CREATE DATABASE FragmentationTest;
GO

USE FragmentationTest;
GO

CREATE TABLE GuidHighFragmentation
(
  UniqueID UNIQUEIDENTIFIER DEFAULT NEWID() PRIMARY KEY,
  FirstName nvarchar(50) NOT NULL,
  LastName nvarchar(50) NOT NULL
);
GO

CREATE NONCLUSTERED INDEX IX_GuidHighFragmentation_LastName
  ON GuidHighFragmentation(LastName);
GO

CREATE TABLE GuidLowFragmentation
(
  UniqueID UNIQUEIDENTIFIER DEFAULT NEWSEQUENTIALID() PRIMARY KEY,
  FirstName nvarchar(50) NOT NULL,
  LastName nvarchar(50) NOT NULL
);
GO

CREATE NONCLUSTERED INDEX IX_GuidLowFragmentation_LastName
  ON GuidLowFragmentation(LastName);
GO

INSERT INTO GuidHighFragmentation (FirstName, LastName)
  SELECT TOP 100000      a.name, b.name
  FROM master.dbo.spt_values AS a
  CROSS JOIN master.dbo.spt_values AS b
  WHERE a.name IS NOT NULL
    AND b.name IS NOT NULL
  ORDER BY NEWID();
GO 70

INSERT INTO GuidLowFragmentation (UniqueID, FirstName, LastName)
  SELECT UniqueID, FirstName, LastName
  FROM GuidHighFragmentation;
GO

ALTER INDEX ALL ON GuidLowFragmentation REBUILD;
GO
After rebuilding the index, we can look at the fragmentation levels with the following query:
SELECT
      OBJECT_NAME(ps.object_id) AS table_name,
      i.name AS index_name,
      ps.index_id,
      ps.index_depth,
      avg_fragmentation_in_percent,
      fragment_count,
      page_count,
      avg_page_space_used_in_percent,
      record_count
  FROM sys.dm_db_index_physical_stats(
      DB_ID(),
      NULL,
      NULL,
      NULL,
      'DETAILED') AS ps
  JOIN sys.indexes AS i
      ON ps.object_id = i.object_id
      AND ps.index_id = i.index_id
  WHERE index_level = 0;
  GO
Results:

Here we can see that our GuidHighFragmentation table is 99% fragmented and uses 31% more page space than the GuidLowFragmentation table in the database, despite them having the same 7,000,000 rows of data. If we do perform a basic aggregation query against each of the tables and compare the execution plans on a default installation (with default configuration options and values) of SQL Server using SentryOne Plan Explorer:
-- Aggregate the data from both tables
SELECT LastName, COUNT(*)
  FROM GuidLowFragmentation
  GROUP BY LastName;
  GO

SELECT LastName, COUNT(*)
  FROM GuidHighFragmentation
  GROUP BY LastName;
GO 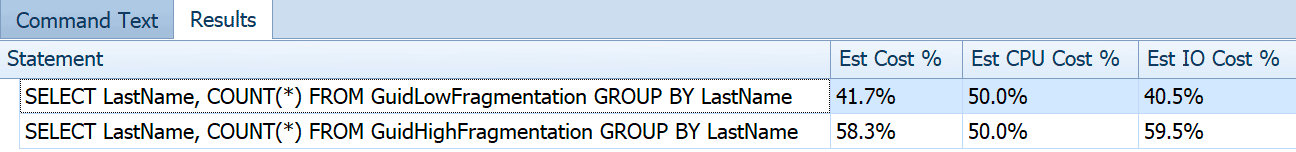
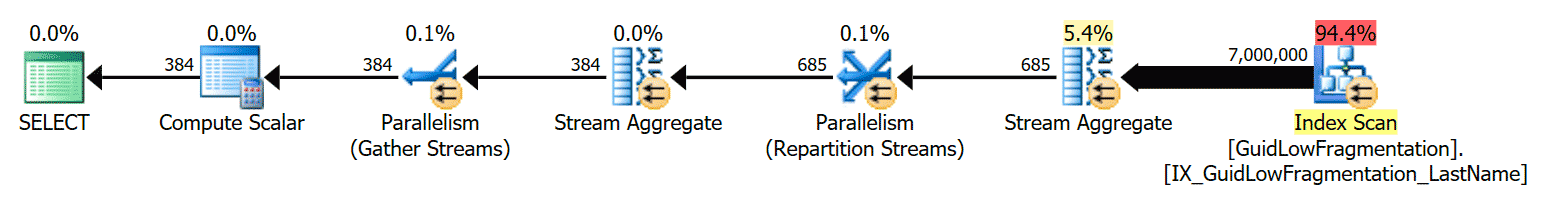
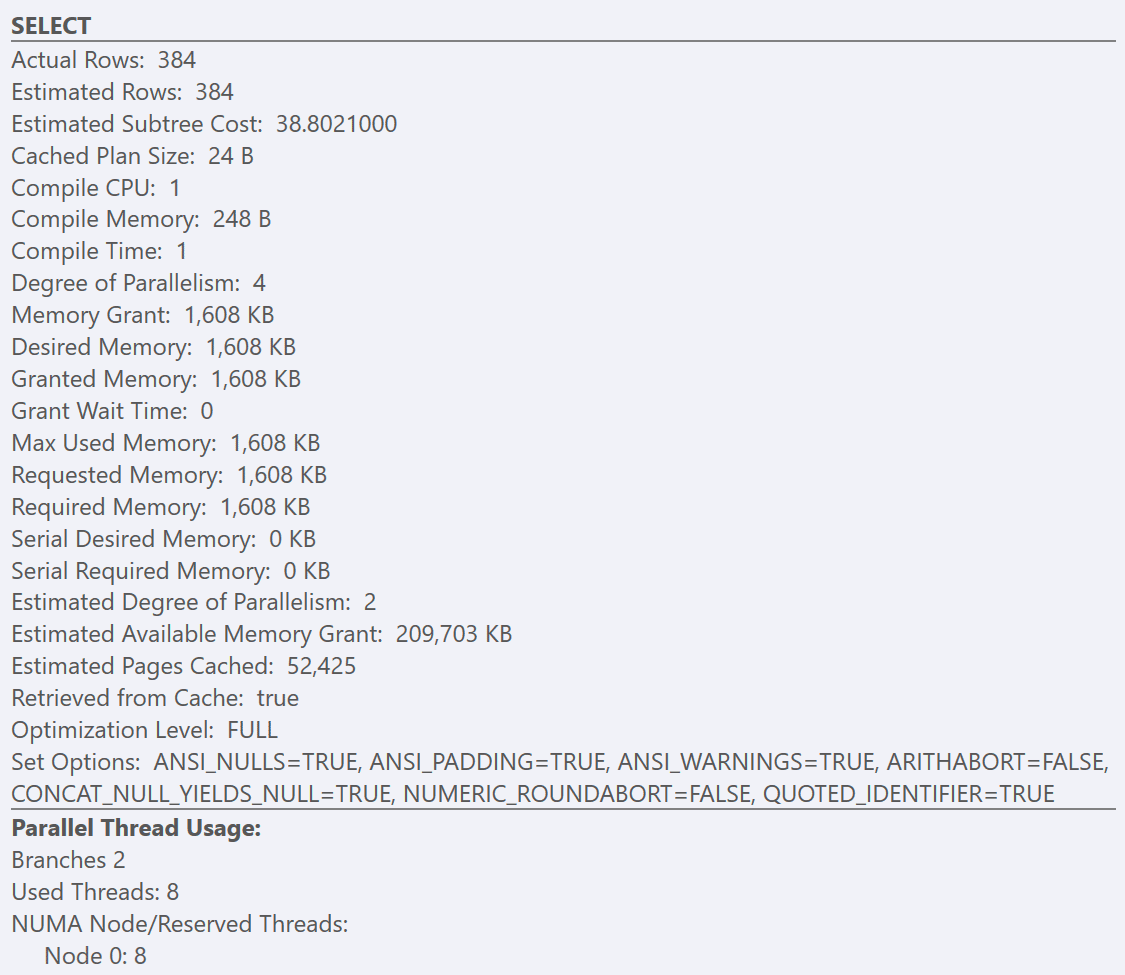

If we look at the tooltips from the SELECT operator for each plan, the plan for the GuidLowFragmentation table has a query cost of 38.80 (the third-line down from the top of the tooltip) versus a query cost of 54.14 for the plan for the GuidHighFragmentation plan.
Under a default configuration for SQL Server, both of these queries end up generating a parallel execution plan since the estimated query cost is higher than the ‘cost threshold for parallelism’ sp_configure option default of 5. This is because the query optimizer first produces a serial plan (that can only be executed by a single thread) when compiling the plan for a query. If the estimated cost of that serial plan exceeds the configured ‘cost threshold for parallelism’ value, then a parallel plan is generated and cached instead.
However, what if the 'cost threshold for parallelism' sp_configure option isn’t set to the default of 5 and is set higher? It’s a best practice (and a correct one) to increase this option from the low default of 5 to anywhere from 25 to 50 (or even much higher) to prevent small queries from incurring the additional overhead of going parallel.
EXEC sys.sp_configure N'show advanced options', N'1';
RECONFIGURE;
GO
EXEC sys.sp_configure N'cost threshold for parallelism', N'50';
RECONFIGURE;
GO
EXEC sys.sp_configure N'show advanced options', N'0';
RECONFIGURE;
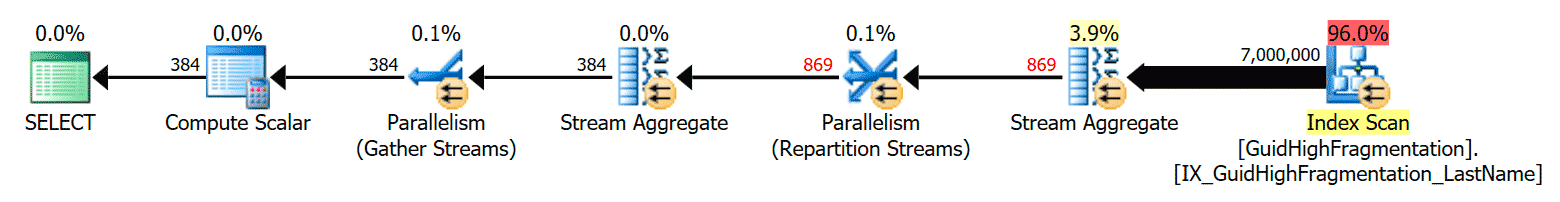
GOAfter following the best-practice guidelines and increasing the ‘cost threshold for parallelism’ to 50, re-running the queries results in the same execution plan for the GuidHighFragmentation table, but the GuidLowFragmentation query serial cost, 44.68, is now below the ‘cost threshold for parallelism’ value (remember its estimated parallel cost was 38.80), so we get a serial execution plan:
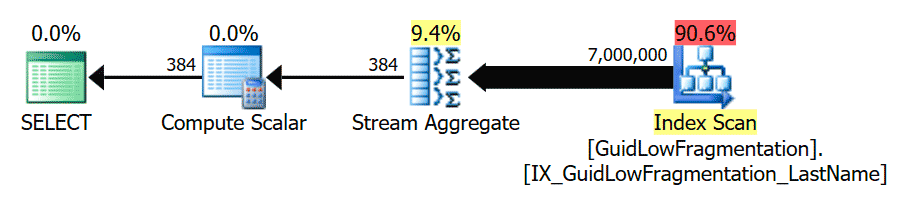
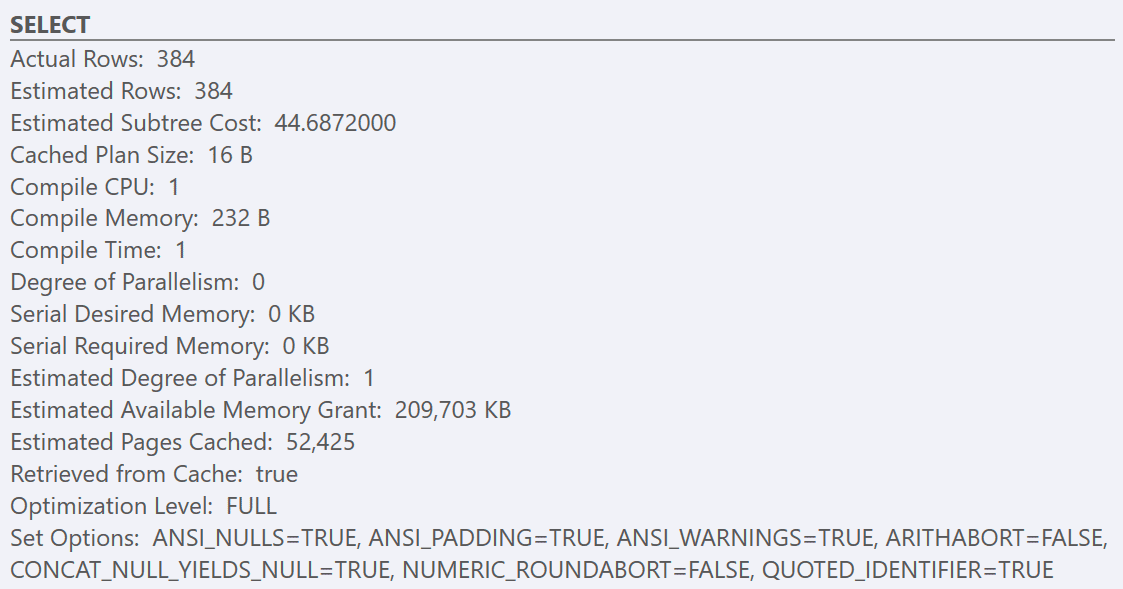
The additional page space in the GuidHighFragmentation clustered index kept the cost above the best-practice setting for ‘cost threshold for parallelism’ and resulted in a parallel plan.
Now imagine that this was a system where you followed the best-practice guidance and initially configured 'cost threshold for parallelism' at a value of 50. Then later you followed the misguided advice of just ignoring index fragmentation altogether.
Instead of this being a basic query, it’s more complex, but if it also gets executed very frequently on your system, and as a result of index fragmentation, the page count tips the cost over to a parallel plan, it will use more CPU and impact overall workload performance as a result.
What do you do? Do you increase 'cost threshold for parallelism' so the query maintains a serial execution plan? Do you hint the query with OPTION(MAXDOP 1) and just force it to a serial execution plan?
Keep in mind that index fragmentation is likely not just affecting one table in your database, now that you’re ignoring it entirely; it’s likely that many clustered and non-clustered indexes are fragmented and have a higher-than-necessary count of pages, so the costs of many I/O operations are increasing as a result of the widespread index fragmentation, leading to potentially many inefficient query plans.
Summary
You can’t just ignore index fragmentation entirely as some might want you to believe. Among other downsides from doing this, the accumulated costs of query execution will catch up to you, with query plan shifts because the query optimizer is a cost-based optimizer and so rightly deems those fragmented indexes as more expensive to utilize.
The queries and scenario here are obviously contrived, but we’ve seen execution plan changes caused by fragmentation in real life on client systems.
You need to make sure that you’re addressing index fragmentation for those indexes where fragmentation causes workload performance problems, no matter what hardware you’re using.
16 thoughts on “Impact of Fragmentation on Execution Plans”
Comments are closed.

Just to make sure I'm seeing the same results you are – the fragmented query runs FASTER, not slower, since it's above the CTFP. (I went through the demo scripts, and the fragmented table finishes in ~500ms whereas the "better" table finishes in 2 seconds.)
Your mileage may vary based on the randomness of the data that gets loaded by the repro script, it's not exactly the same each time, and on my VM the difference isn't quite as significant for duration. The parallel query completes faster, which would be expected, but it also uses more CPU time than the serial query. If you reduce the CTFP, the "better" table uses less CPU and runs FASTER than the fragmented table. The point of the post is that fragmentation just simply can't be ignored based on the hardware you are using, there are other side effects like plan changes that happen if you follow that bad advice.
Gotcha. Just wanted to double check before blogging about how the post shows that fragmentation can make your query runs faster. That coin has two sides, ya know.
Parallelism makes the query go faster, fragmentation makes the plan in this simplified case opt for parallelism, but that isn't the only type of plan change that can happen based on costing by the optimizer. I've seen plans with entirely different shapes and operators where the plan selected is not faster at all, but reproducing those scenarios isn't trivial when you have to fake data, the query and make it something someone else can verify from your article. If your take away from the post is that fragmented indexes make your query faster from this simplified example of a problem, by all means blog about it.
I thought optimizer is not aware of fragmentation. the reasoning is optimizer chooses plan based on stats where stats has nothing to do with fragmentation. fragmentation is physical concept. A valid test would be fragmenting existing tables then test. Correct me if I am wrong.
By the way, of course fragmentation could cause poor performance but would not affect execution plan. that's my point.
Pei – rather than guess, why not test? You can use Jonathan's excellent demo code above to work up an experiment for yourself.
One thing to keep in mind – if you do further inserts after the first round, the two tables have slightly different primary key definitions, so that can also affect testing. It doesn't affect this test though.
Hi Pei – correct – the optimizer (nor any other part of SQL Server) knows nothing about fragmentation, but it does know about the number of pages comprising the various indexes. And fragmentation usually causes the number of pages in an index to increase, which can lead to the optimizer making different plan choices or not using the optimal index for a query. So yes, fragmentation can affect plan choice. One more thing to consider when deciding which indexes to include in your index maintenance. Thanks
See my comment above – thanks
Hi Paul it makes sense that optimizer knows number of pages comprising the various indexes(or sort of knows internal page fragmentation via pfs etc) which leads to choose different plan due to internal fragmentation. I understand now how fragmentation could affect exec plans. Thanks a lot.
On the other hand what if there is no internal fragmentation but just external fragmentation for the indexes, in such case plan should be same with same costs. test case is possible to generate by insert whole page of data each time. Thank you again Paul and Brent.
So can page fullness and fill factor/padding also come into play?
Are you referring to OS level fragmentation? If so, yes, it does affect the speed of the query as the IO sub system has to make the call to X blocks of data on the container.
I do not believe it is part of the equation that is used within SQL Server for the Query Optimizer, as SQL Server would be required to maintain a running OS level fragmentation.
We did had the exactly the same issue in our environment year ago. Our nightly job running very very slow and the execution plan shown that we were using single thread. We lowered down cost threshold for parallelism a few times until we triggered paralleled process.
@Glix: Yes, as they will affect the number of pages created for the index. The lower the fill factor, the greater number of pages and thus an increase in the IO Cost and in the overall cost of the plan.
I compared the two plans and there were differences in cardinality estimates, which as we all know steers the decisions made by the optimizer and thus affects overall cost of the plan. To eliminate this difference, I added additional step to the above test, which was to update statistics (listed below, full scan as index rebuilds produce full scan statistics) for the dbo.GuidHighFragmentation table.
At this point, the only difference that can be accounted for is fragmentation. After the statistics were updated the cardinality estimates were the same, but the cost for the fragmented index query was still higher, naturally, as the IO for it is greater.
It now makes sense that fragmentation can make a difference in plan decisions because of the IO (the number of pages) for indexes, which can then affect the cardinality estimate of the plan operator, which then steers the optimizer.
Thank you for posting this article. Pushing back the boundary of knowledge feels good!
UPDATE STATISTICS dbo.GuidHighFragmentation WITH ALL, FULLSCAN;
And one more test!
I added second index on last name for the high fragmentation table; now there are indexes, identical in structure with the same statistics but one with higher fragmentation than the other. As expected, the optimizer chose the one with lower IO cost.
CREATE NONCLUSTERED INDEX IX_which_index
ON GuidHighFragmentation(LastName);
GO