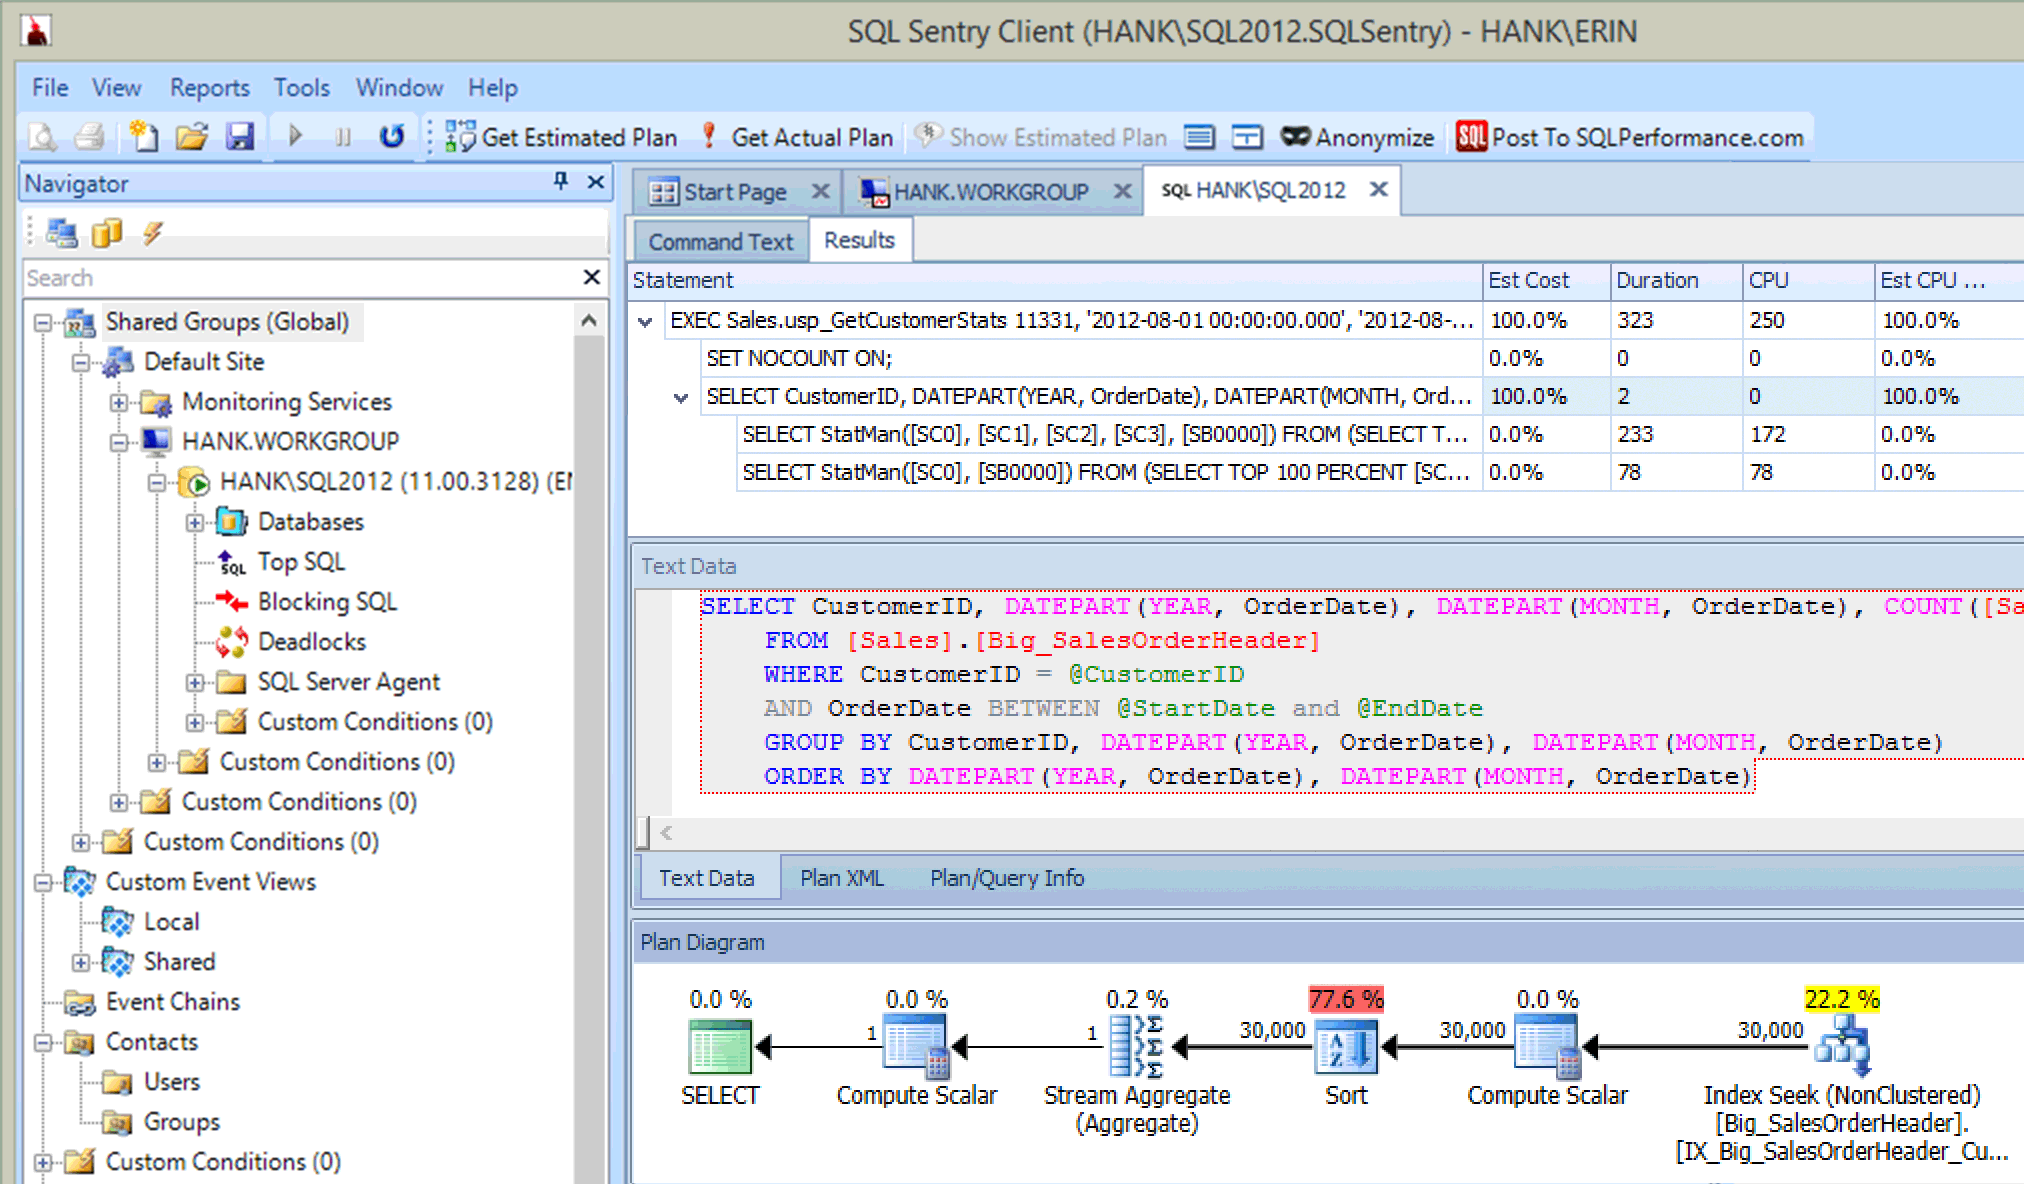
Back in April I wrote about some native methods within SQL Server that can be used to track automatic updates to statistics. The three options I provided were SQL Trace, Extended Events, and snapshots of sys.dm_db_stats_properties. While these three options remain viable (even in SQL Server 2014, though my top recommendation is still XE), an additional option I noticed when running some tests recently is SQL Sentry Plan Explorer.
Many of you use Plan Explorer simply for reading executing plans, which is great. It has numerous benefits over Management Studio when it comes to reviewing plans – from the little things, like being able to sort on top operators and easily see cardinality estimate issues, to bigger benefits, like handling complex and large plans and being able to select one statement within a batch for easier plan review. But behind the visuals that make it easier to dissect plans, Plan Explorer also offers the ability to execute a query and view the actual plan (rather than running it in Management Studio and saving it off). And on top of that, when you run the plan from PE, there is additional information captured that can be useful.
Let's start with the demo that I used in my recent post, How Automatic Updates to Statistics Can Affect Query Performance. I started with the AdventureWorks2012 database, and I created a copy of the SalesOrderHeader table with over 200 million rows. The table has a clustered index on SalesOrderID, and a nonclustered index on CustomerID, OrderDate, SubTotal. [Again: if you are going to do repeated tests, take a backup of this database at this point to save yourself some time.] I first verified the current number of rows in the table, and the number of rows that would need to change to invoke an automatic update:
SELECT
OBJECT_NAME([p].[object_id]) [TableName],
[si].[name] [IndexName],
[au].[type_desc] [Type],
[p].[rows] [RowCount],
([p].[rows]*.20) + 500 [UpdateThreshold],
[au].total_pages [PageCount],
(([au].[total_pages]*8)/1024)/1024 [TotalGB]
FROM [sys].[partitions] [p]
JOIN [sys].[allocation_units] [au] ON [p].[partition_id] = [au].[container_id]
JOIN [sys].[indexes] [si] on [p].[object_id] = [si].object_id and [p].[index_id] = [si].[index_id]
WHERE [p].[object_id] = OBJECT_ID(N'Sales.Big_SalesOrderHeader');

Big_SalesOrderHeader CIX and NCI Information
I also verified the current statistics header for the index:
DBCC SHOW_STATISTICS ('Sales.Big_SalesOrderHeader',[IX_Big_SalesOrderHeader_CustomerID_OrderDate_SubTotal]);
The stored procedure that I use for testing was already created, but for completeness the code is listed below:
CREATE PROCEDURE Sales.usp_GetCustomerStats
@CustomerID INT,
@StartDate DATETIME,
@EndDate DATETIME
AS
BEGIN
  SET NOCOUNT ON;

  SELECT CustomerID, DATEPART(YEAR, OrderDate), DATEPART(MONTH, OrderDate), COUNT([SalesOrderID]) as Computed
    FROM [Sales].[Big_SalesOrderHeader]
    WHERE CustomerID = @CustomerID
    AND OrderDate BETWEEN @StartDate and @EndDate
    GROUP BY CustomerID, DATEPART(YEAR, OrderDate), DATEPART(MONTH, OrderDate)
    ORDER BY DATEPART(YEAR, OrderDate), DATEPART(MONTH, OrderDate);
END
Previously, I either started a Trace or Extended Events session, or set up my method to snapshot sys.dm_db_stats_properties to a table. For this example, I just ran the above stored procedure a few times:
EXEC Sales.usp_GetCustomerStats 11331, '2012-08-01 00:00:00.000', '2012-08-31 23:59:59.997'
GO
EXEC Sales.usp_GetCustomerStats 11330, '2013-01-01 00:00:00.000', '2013-01-31 23:59:59.997'
GO
EXEC Sales.usp_GetCustomerStats 11506, '2012-11-01 00:00:00.000', '2012-11-30 23:59:59.997'
GO
EXEC Sales.usp_GetCustomerStats 17061, '2013-01-01 00:00:00.000', '2013-01-31 23:59:59.997'
GO
EXEC Sales.usp_GetCustomerStats 11711, '2013-03-01 00:00:00.000', '2013-03-31 23:59:59.997'
GO
EXEC Sales.usp_GetCustomerStats 15131, '2013-02-01 00:00:00.000', '2013-02-28 23:59:59.997'
GO
EXEC Sales.usp_GetCustomerStats 29837, '2012-10-01 00:00:00.000', '2012-10-31 23:59:59.997'
GO
EXEC Sales.usp_GetCustomerStats 15750, '2013-03-01 00:00:00.000', '2013-03-31 23:59:59.997'
GO
I then checked the procedure cache to verify the execution count, and also verified the plan that was cached:
SELECT
OBJECT_NAME([st].[objectid]),
[st].[text],
[qs].[execution_count],
[qs].[creation_time],
[qs].[last_execution_time],
[qs].[min_worker_time],
[qs].[max_worker_time],
[qs].[min_logical_reads],
[qs].[max_logical_reads],
[qs].[min_elapsed_time],
[qs].[max_elapsed_time],
[qp].[query_plan]
FROM [sys].[dm_exec_query_stats] [qs]
CROSS APPLY [sys].[dm_exec_sql_text]([qs].plan_handle) [st]
CROSS APPLY [sys].[dm_exec_query_plan]([qs].plan_handle) [qp]
WHERE [st].[text] LIKE '%usp_GetCustomerStats%'
AND OBJECT_NAME([st].[objectid]) IS NOT NULL;

Plan Cache Info for the SP: At Start

Query Plan for Stored Procedure, using SQL Sentry Plan Explorer
The plan was created at 2014-09-29 23:23.01.
Next I added 61 million rows to the table to invalidate the current statistics, and once the insert completed, I checked the row counts:

Big_SalesOrderHeader CIX and NCI Information: After insert of 61 million rows
Before running the stored procedure again, I verified that the execution count had not changed, that the creation_time was still 2014-09-29 23:23.01 for the plan, and that statistics hadn't updated:

Plan Cache Info for the SP: Immediately After Insert
Now, in the previous blog post, I ran the statement in Management Studio, but this time, I ran the query directly from Plan Explorer, and captured the Actual Plan via PE (option circled in red in the image below).

Execute Stored Procedure from Plan Explorer
When you execute a statement from PE, you have to enter the instance and database to which you want to connect, and then you are notified that the query will run and the actual plan will be returned, but results will not be returned. Note that this is different than Management Studio, where you do see the results.
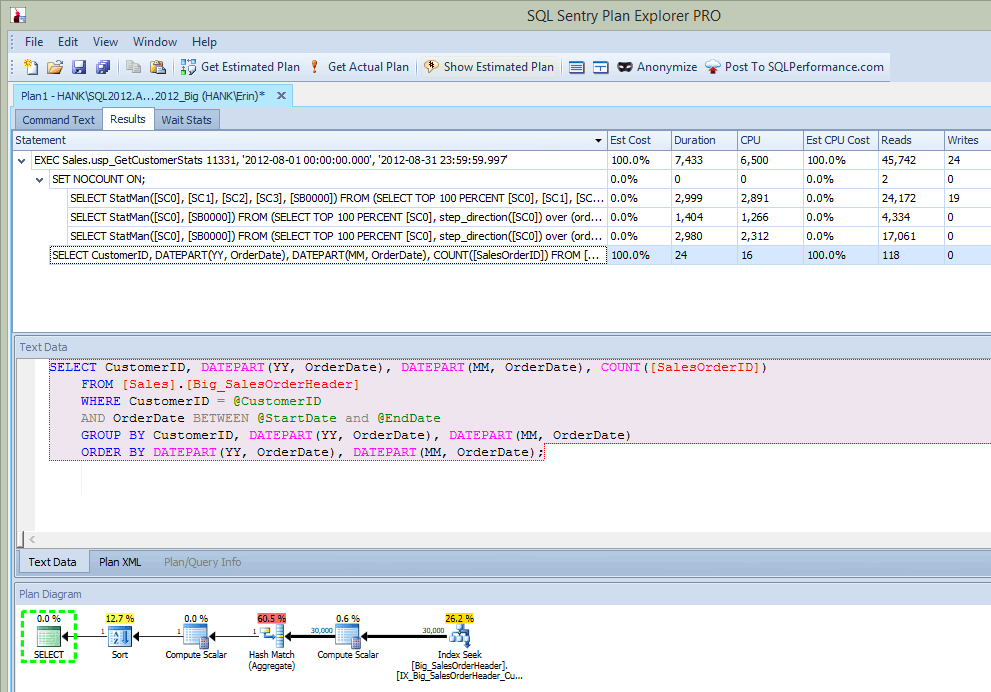
After I ran the stored procedure, in the output I not only get the plan, but I see what statements were executed:

Plan Explorer output after execution SP (after insert)
This is pretty cool…in addition to seeing the statement executed in the stored procedure, I also see the updates to statistics, just as I did when I captured updates using Extended Events or SQL Trace. Along with the statement execution, we can also see CPU, duration, and IO information. Now – the caveat here is that I can see this information if I run the statement that invokes the statistics update from Plan Explorer. That probably won't happen often in your production environment, but you may see this when you're doing testing (because hopefully your testing doesn't just involve running SELECT queries, but also involves INSERT/UPDATE/DELETE queries just like you would see in a normal workload). However, if you're monitoring your environment with a tool like SQL Sentry, you might see these updates in Top SQL as long as they exceed the Top SQL collection threshold. SQL Sentry has default thresholds that queries must exceed before they are captured as Top SQL (e.g. duration must exceed five (5) seconds), but you can change those and add other thresholds such as reads. In this example, for testing purposes only, I changed my Top SQL minimum duration threshold to 10 milliseconds and my read threshold to 500, and SQL Sentry was able to capture some of the statistics updates:

Statistics updates captured by SQL Sentry
That said, whether monitoring can capture these events will ultimately depend on system resources and the amount of data that has to be read to update the statistic. Your statistics updates may not exceed these thresholds, so you may have to do more proactive digging to find them.
Summary
I always encourage DBAs to proactively manage statistics – which means that a job is in place to update statistics on a regular basis. However, even if that job runs every night (which I'm not necessarily recommending), it's still quite possible that updates to statistics occur automatically throughout the day, because some tables are more volatile than others and have a high number of modifications. This is not abnormal, and depending on the size of the table and the amount of modifications, the automatic updates may not interfere significantly with user queries. But the only way to know is to monitor those updates – whether you're using native tools or third-party tools – so that you can stay ahead of potential issues and address them before they escalate.


Great post.
This is sample code I use to find if stats were updated on any column/index.
SELECT [schema_name] = SCHEMA_NAME(T.[schema_id]), table_name = T.name, T.type_desc, index_or_statistics_name = S.name, is_auto_stats = S.auto_created, user_created = S.user_created, last_updated = STATS_DATE(T.[object_id], S.stats_id) , cast(0 as bigint) as ROW_count into #tmptest FROM sys.tables T JOIN sys.stats S ON S.[object_id] = T.[object_id] --where STATS_DATE(T.[object_id], S.stats_id) between '03/25/2011 23:30:00' and '03/26/2011 00:55:00' where STATS_DATE(T.[object_id], S.stats_id) >= GETDATE() - 1 ORDER BY T.[schema_id], T.name, S.stats_id; update #tmptest set ROW_count = (select a.rows from (SELECT OBJECT_NAME(P.object_id) AS [Name], sum(P.rows) as rows FROM sys.indexes I INNER JOIN sys.partitions P ON P.object_id = I.object_id AND P.index_id = I.index_id WHERE I.index_id = DATEADD(mi,-15,getdate()) and row_count > 1 order by last_updated;I do not know if it's just me or if perhaps everybody else experiencing
problems with your blog. It appears like some of the text within your content are running off the screen. Can somebody
else please provide feedback and let me know if this is happening to
them too? This may be a issue with my internet browser
because I've had this happen before. Cheers
Can you let us know what browser you're using, and version? Thanks!
And platform as well as screen or window size please.
Hello! I've been reading your website for a while now and finally
got the courage to go ahead and give you a shout out from Kingwood Tx!
Just wanted to mention keep up the great work!