In my previous post, I explored different methods to track automatic updates to statistics to determine if they were affecting query performance. In the latter half of the post I included options, one of which was to enable the Auto Update Statistics Asynchronously database setting. In this post, I want to look at how query performance changes when the automatic update does occur prior to query execution, and what happens to performance if the update is asynchronous.
The Set Up
I started with a copy of the AdventureWorks2012 database, and then created a copy of the SalesOrderHeader table with over 200 million rows using this script. The table has a clustered index on SalesOrderID, and a nonclustered index on CustomerID, OrderDate, SubTotal. [Note: if you are going to do repeated tests, take a backup of this database at this point to save yourself some time]. After loading the data and creating the nonclustered index, I verified row count and calculated how many rows (approximately) would need to be modified to invoke an automatic update.
SELECT
OBJECT_NAME([p].[object_id]) [TableName],
[si].[name] [IndexName],
[au].[type_desc] [Type],
[p].[rows] [RowCount],
([p].[rows]*.20) + 500 [UpdateThreshold],
[au].total_pages [PageCount],
(([au].[total_pages]*8)/1024)/1024 [TotalGB]
FROM [sys].[partitions] [p]
JOIN [sys].[allocation_units] [au] ON [p].[partition_id] = [au].[container_id]
JOIN [sys].[indexes] [si] on [p].[object_id] = [si].object_id and [p].[index_id] = [si].[index_id]
WHERE [p].[object_id] = OBJECT_ID(N'Sales.Big_SalesOrderHeader');

Big_SalesOrderHeader CIX and NCI Information
I also verified the current statistics header for the index:
DBCC SHOW_STATISTICS ('Sales.Big_SalesOrderHeader',[IX_Big_SalesOrderHeader_CustomerID_OrderDate_SubTotal]);
I then created the stored procedure that I would use for testing. It’s a straightforward procedure that queries Sales.Big_SalesOrderHeader, and aggregates sales data by CustomerID and OrderDate for analysis:
CREATE PROCEDURE Sales.usp_GetCustomerStats
@CustomerID INT,
@StartDate DATETIME,
@EndDate DATETIME
AS
BEGIN
  SET NOCOUNT ON;

  SELECT CustomerID, DATEPART(YEAR, OrderDate), DATEPART(MONTH, OrderDate), COUNT([SalesOrderID]) as Computed
    FROM [Sales].[Big_SalesOrderHeader]
    WHERE CustomerID = @CustomerID
    AND OrderDate BETWEEN @StartDate and @EndDate
    GROUP BY CustomerID, DATEPART(YEAR, OrderDate), DATEPART(MONTH, OrderDate)
    ORDER BY DATEPART(YEAR, OrderDate), DATEPART(MONTH, OrderDate);
END
Finally, before executing the stored procedure, I created an Extended Events session so I could track query duration using sp_statement_starting and sp_statement_completed. I also added the auto_stats event, because even though I did not expect an update to occur, I wanted to use this same session definition later.
CREATE EVENT SESSION [StatsUpdate_QueryPerf]
ON SERVER
ADD EVENT sqlserver.auto_stats,
ADD EVENT sqlserver.sp_statement_completed(
SET collect_statement=(1)
),
ADD EVENT sqlserver.sp_statement_starting
ADD TARGET package0.event_file(
SET filename=N'C:\temp\StatsUpdate_QueryPerf.xel'
)
WITH (MAX_MEMORY=4096 KB,EVENT_RETENTION_MODE=ALLOW_SINGLE_EVENT_LOSS,MAX_DISPATCH_LATENCY=30 SECONDS,
MAX_EVENT_SIZE=0 KB,MEMORY_PARTITION_MODE=NONE,TRACK_CAUSALITY=ON,STARTUP_STATE=OFF);
GO
The Test
I started the Extended Events session, and then executed the stored procedure multiple times, using different CustomerIDs:
ALTER EVENT SESSION [StatsUpdate_QueryPerf]
ON SERVER
STATE = START;
GO

EXEC Sales.usp_GetCustomerStats 11331, '2012-08-01 00:00:00.000', '2012-08-31 23:59:59.997'
GO
EXEC Sales.usp_GetCustomerStats 11330, '2013-01-01 00:00:00.000', '2013-01-31 23:59:59.997'
GO
EXEC Sales.usp_GetCustomerStats 11506, '2012-11-01 00:00:00.000', '2012-11-30 23:59:59.997'
GO
EXEC Sales.usp_GetCustomerStats 17061, '2013-01-01 00:00:00.000', '2013-01-31 23:59:59.997'
GO
EXEC Sales.usp_GetCustomerStats 11711, '2013-03-01 00:00:00.000', '2013-03-31 23:59:59.997'
GO
EXEC Sales.usp_GetCustomerStats 15131, '2013-02-01 00:00:00.000', '2013-02-28 23:59:59.997'
GO
EXEC Sales.usp_GetCustomerStats 29837, '2012-10-01 00:00:00.000', '2012-10-31 23:59:59.997'
GO
EXEC Sales.usp_GetCustomerStats 15750, '2013-03-01 00:00:00.000', '2013-03-31 23:59:59.997'
GO
I verified the execution count, and the plan, by querying the procedure cache:
SELECT
OBJECT_NAME([st].[objectid]),
[st].[text],
[qs].[execution_count],
[qs].[creation_time],
[qs].[last_execution_time],
[qs].[min_worker_time],
[qs].[max_worker_time],
[qs].[min_logical_reads],
[qs].[max_logical_reads],
[qs].[min_elapsed_time],
[qs].[max_elapsed_time],
[qp].[query_plan]
FROM [sys].[dm_exec_query_stats] [qs]
CROSS APPLY [sys].[dm_exec_sql_text]([qs].plan_handle) [st]
CROSS APPLY [sys].[dm_exec_query_plan]([qs].plan_handle) [qp]
WHERE [st].[text] LIKE '%usp_GetCustomerStats%'
AND OBJECT_NAME([st].[objectid]) IS NOT NULL;

Query Plan for Stored Procedure, using SQL Sentry Plan Explorer
I could see that the plan was created at 2014-04-08 18:59:39.850. With the plan in cache, I stopped the Extended Events session:
ALTER EVENT SESSION [StatsUpdate_QueryPerf]
ON SERVER
STATE = STOP;
Next I added about 47 million rows of data to the table using this script, well over the threshold necessary to invalidate the current statistics. After adding the data, I verified the number of rows in the table:

Big_SalesOrderHeader CI: After Data Load
Before I re-ran my stored procedure, I checked the plan cache to make sure nothing had changed, and verified that statistics had not yet updated. Remember, even though the statistics were invalidated at this point, they will not update until a query that uses the statistic is executed (for reference: Understanding When Statistics Will Automatically Update). For the final step, I started the Extended Events session again, and then ran the stored procedure multiple times. After those executions, I checked the plan cache again:
The execution_count is 8 again, and if we look at the create_time of the plan, we can see it’s changed to 2014-04-08 19:32:52.913. If we check the plan, we can see that it is the same, even though the plan was recompiled:

Query Plan for Stored Procedure, using SQL Sentry Plan Explorer
Analysis of Extended Events Output
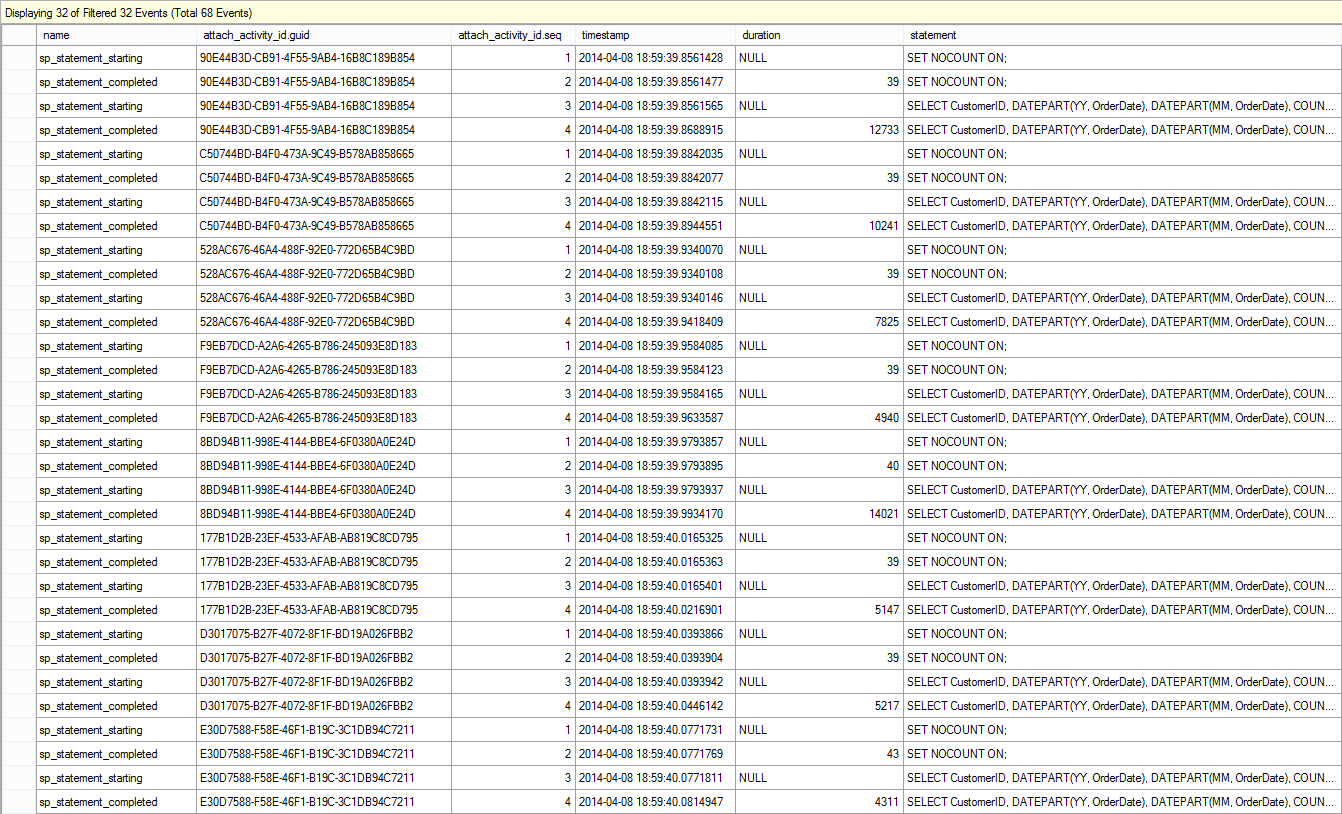
I took the first Extended Events file – before data was loaded – and opened it in SSMS, then applied a filter so that only statements from the stored procedure were listed:

Extended Events Output: After Initial SP Execution
You can see that there are eight (8) executions of the stored procedure, with query durations that vary slightly.
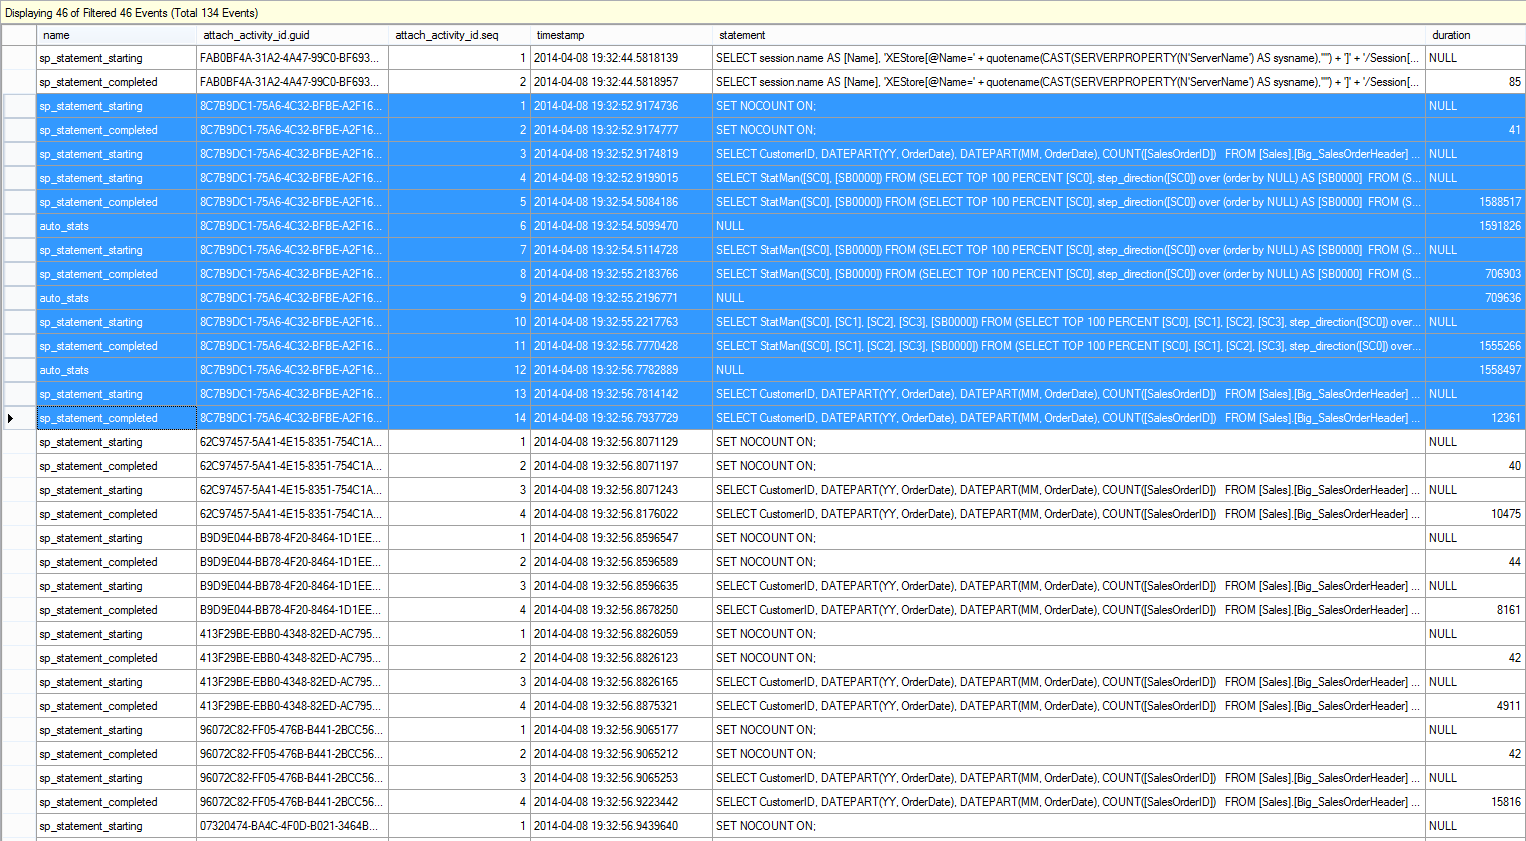
I took the second Extended Events file – after data was loaded – opened it SSMS, and filtered again so that only statements from the stored procedure, as well as auto_stats events, were listed:

Extended Events Output: SP Execution After Data Load
The output is truncated, as it is not all needed to show the main result. The blue highlighted entries represent the first execution of the stored procedure, and note that there are multiple steps – the update to statistics is part of the execution. The SELECT statement starts (attach_activity_id.seq = 3), and the updates to statistics then execute. In our example, we actually have updates to three statistics. Once the last update completes (attach_activity_id.seq = 11), then the stored procedure starts and completes (attach_activity_id.seq = 13 and attach_activity_id.seq = 14). Interestingly enough, there is a second sp_statement_starting event for the stored procedure (presumably the first one is disregarded), so the total duration for the stored procedure is calculated without the update to statistics.
In this scenario, having statistics automatically update immediately – that is, when a query that uses invalidated statistics executes – causes the query to run longer, even though query duration based on the sp_statement_completed event is still less than 14000. The end result is that there is no benefit to query performance, as the plan is exactly same before and after the statistics update. In this scenario, the query plan and execution duration do not change after more data is added to the table, so the update to statistics only hinders its performance. Now let’s see what happens when we enable the Auto Update Statistics Asynchronously option.
The Test, Version 2
We start by restoring to the backup that I took before we started the first test. I recreated the stored procedure and then changed the database option to update statistics asynchronously:
USE [master];
GO
ALTER DATABASE [AdventureWorks2012_Big] SET AUTO_UPDATE_STATISTICS_ASYNC ON WITH NO_WAIT
GO
I started the Extended Events session, and again executed the stored procedure multiple times, using different CustomerIDs:
ALTER EVENT SESSION [StatsUpdate_QueryPerf]
ON SERVER
STATE = START;
GO

EXEC Sales.usp_GetCustomerStats11331, '2012-08-01 00:00:00.000', '2012-08-31 23:59:59.997'
GO
EXEC Sales.usp_GetCustomerStats11330, '2013-01-01 00:00:00.000', '2013-01-31 23:59:59.997'
GO
EXEC Sales.usp_GetCustomerStats11506, '2012-11-01 00:00:00.000', '2012-11-30 23:59:59.997'
GO
EXEC Sales.usp_GetCustomerStats17061, '2013-01-01 00:00:00.000', '2013-01-31 23:59:59.997'
GO
EXEC Sales.usp_GetCustomerStats11711, '2013-03-01 00:00:00.000', '2013-03-31 23:59:59.997'
GO
EXEC Sales.usp_GetCustomerStats15131, '2013-02-01 00:00:00.000', '2013-02-28 23:59:59.997'
GO
EXEC Sales.usp_GetCustomerStats29837, '2012-10-01 00:00:00.000', '2012-10-31 23:59:59.997'
GO
EXEC Sales.usp_GetCustomerStats15750, '2013-03-01 00:00:00.000', '2013-03-31 23:59:59.997'
GO
I verified the execution count, and the plan, by querying the procedure cache:

Query Plan for Stored Procedure, using SQL Sentry Plan Explorer
For this test, the plan was created at 2014-04-08 21:15:55.490. I stopped the Extended Events session and again added about 47 million rows of data to the table, using the same query as before.
Once the data had been added, I checked the plan cache to make sure nothing had changed, and verified that statistics had not yet updated. Finally, I started the Extended Events session again, and then ran the stored procedure eight more times. A final peek into the plan cache showed execution_count at 16 and a create_time of 2014-04-08 21:15:55.490. The execution_count and create_time demonstrate that statistics have not updated, as the plan hasn't been flushed from cache yet (if it had, we would have a later create_time and an execution_count of 8).

Plan Cache: After Data Load, Test 2
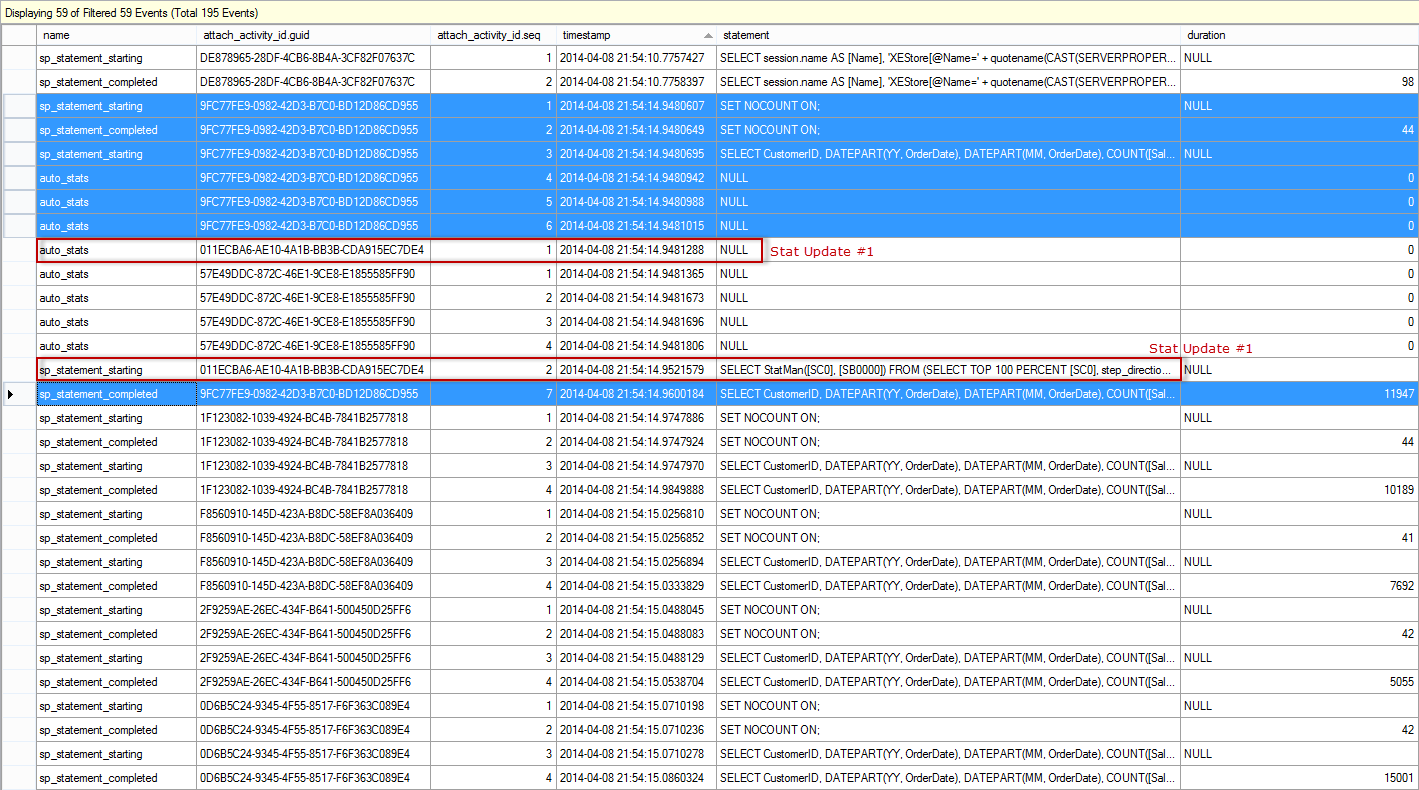
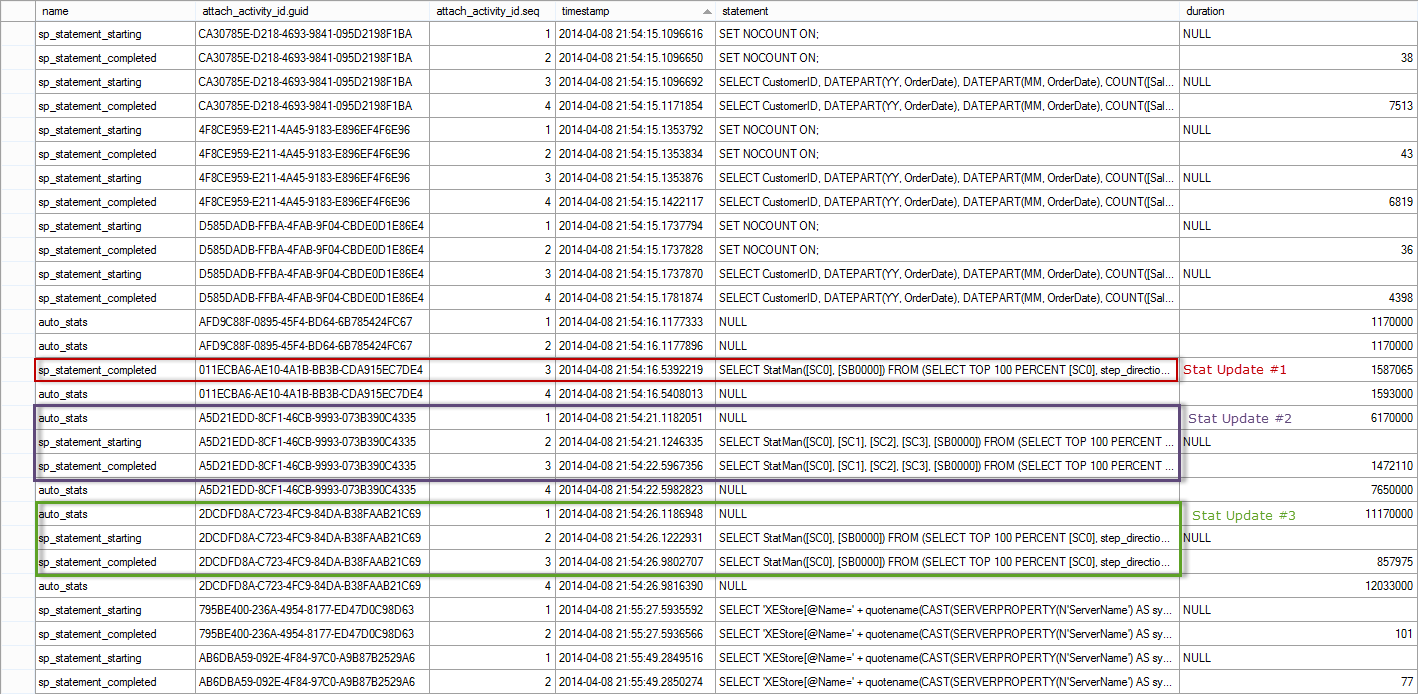
If we open the Extended Events output from after the data load in SSMS, and again filter so we only see statements from the stored procedure, as well as auto_stats events, we find this (note that the output is broken into two screen shots):

Extended Events Output: Test 2, SP Execution After Data Load, part I

Extended Events Output: Test 2, SP Execution After Data Load, part II
The events for the execution of the first call of the stored procedure are highlighted in blue – they start at 2014-04-08 21:54:14.9480607 and there are seven (7) events. Note that there are three (3) auto_stats events, but none of them actually complete, as we saw when the Auto Update Statistics Asynchronously option was disabled. You'll notice that the automatic update does start for one of the statistics almost immediately (2014-04-08 21:54:14.9481288), and it's three events have the red text 'Stat Update #1' next to them. That statistics update finishes at 2014-04-08 21:54:16.5392219, just under two seconds after it starts, but after all other executions of the procedure have completed. This is why the execution_count from sys.dm_exec_query_stats shows 16. From the XE output, we can see that the other statistics updates then complete (Stat Update #2 and Stat Update #3). All of the updates are asynchronous to the initial stored procedure's execution.
Summary
As you can see, automatic updates to statistics have the potential to negatively affect query performance. The degree of impact will depend on the amount of data that has to be read to update the statistic, and the system resources. In some cases, query performance only increases by milliseconds and is most likely imperceptible to users. Other times, the duration can increase dramatically, which then affects end-user experience. In the case where the query plan does not change after an update to statistics, it is well worth considering enabling the Auto Update Statistics Asynchronously option, to mitigate the impact on query performance.


Great post! I feel like it needs just a wee bit of a disclaimer though.
If you've got a 200mm row table and you add/update 40mm rows without statistics being updated, that means one of two things:
1 – The data changes happened over the period of a week or more, and the DBA wasn't running regular update stats jobs. In this case, the fix isn't to enable async stats – it's to start updating the stats proactively on a regular basis. That way, the IO hit occurs outside of business hours. (Even with updating stats async, it's gonna hit during business hours if it's triggered by an end user query.) Or…
2 – The data changes happened in a big batch job, and the ETL process isn't selecting any data. This is a fairly unusual case – usually ETL processes at least have some kind of check to query how many rows got changed last night or fire off some kind of a report. However, if you're in that edge case, isn't a better fix to fire off the stats updates at the end of your ETL processes? Where I've done this kind of workflow (dump in over 5% of the table at once), I've had a lot of success adding an update stats script in the job based on the ETL job's logic. The ETL job knows which tables it touched and how many rows it added, so it's trivial to build in logic to say, "If over X% of the table was changed, go update stats." Again, that way the IO hits after hours, not business hours.
Either way, even the first query after the data change will get a great plan, which is even better than enabling async stats.
Good post though!
Brent-
Belated reply. Thank you for the comment. Yes, valid point about 200mm row table. I should have noted that I used a 200mm row table because I was trying to create a noticeable difference (e.g. > 5 seconds) in query execution time when stats updated automatically. However, I couldn't make it happen on my machine because of the SSDs, and I had other issues with my external drive. So, I just left it at 200mm for the post, and didn't consider that people might wonder "Gee, how would 40mm rows of data change without stats getting updated by a job?!" Your points are correct, and I always encourage DBAs to manually manage statistics, and relay on Auto Update as a safety (whether the tables are 200K rows or 200mm rows).
Thanks for helping to clarify the point!
Erin
Great post Indeed.
It shows when there is less on no activity only then asynchronous stats update takes place. Is it right?. If no, is there any requirement to meet for stats update asynchronous to occur.
If there is gap of 2-3 more sec between call of SP, will stats update asynchronous occur?
Hi-
I'm not clear how you're determining that the asynch update takes place only when there is less or no activity. The update starts after the statement has started executing, and it continues running in the background while other statements complete (versus in the first test, where the update completed and THEN the other statements completed). In order to statistics to update automatically (and asynchronously, if that option is enabled), the stats have to have been invalidated. If there is a gap between the SP call, yes, stats will still update asynchronously.