It has long been established that table variables with a large number of rows can be problematic, since the optimizer always sees them as having one row. Without a recompile after the table variable has been populated (since before that it is empty), there is no cardinality for the table, and automatic recompiles don't happen because table variables aren't even subject to a recompile threshold. Plans, therefore, are based on a table cardinality of zero, not one, but the minimum is increased to one as Paul White (@SQL_Kiwi) describes in this dba.stackexchange answer.
The way we might typically work around this problem is to add OPTION (RECOMPILE) to the query referencing the table variable, forcing the optimizer to inspect the cardinality of the table variable after it has been populated. To avoid the need to go and manually change every query to add an explicit recompile hint, a new trace flag (2453) has been introduced in SQL Server 2012 Service Pack 2 and SQL Server 2014 Cumulative Update #3:
When trace flag 2453 is active, the optimizer can obtain an accurate picture of table cardinality after the table variable has been created. This can be A Good Thing™ for a lot of queries, but probably not all, and you should be aware of how it works differently from OPTION (RECOMPILE). Most notably, the parameter embedding optimization Paul White talks about in this post occurs under OPTION (RECOMPILE), but not under this new trace flag.
A Simple Test
My initial test consisted of just populating a table variable and selecting from it; this yielded the all-too-familiar estimated row count of 1. Here is the test I ran (and I added the recompile hint to compare):
DBCC TRACEON(2453);

DECLARE @t TABLE(id INT PRIMARY KEY, name SYSNAME NOT NULL UNIQUE);

INSERT @t SELECT TOP (1000) [object_id], name FROM sys.all_objects;

SELECT t.id, t.name
  FROM @t AS t;

SELECT t.id, t.name
  FROM @t AS t OPTION (RECOMPILE);

DBCC TRACEOFF(2453);
Using SQL Sentry Plan Explorer, we can see that the graphical plan for both queries in this case is identical, probably at least in part because this is quite literally a trivial plan:

Graphical plan for a trivial index scan against @t
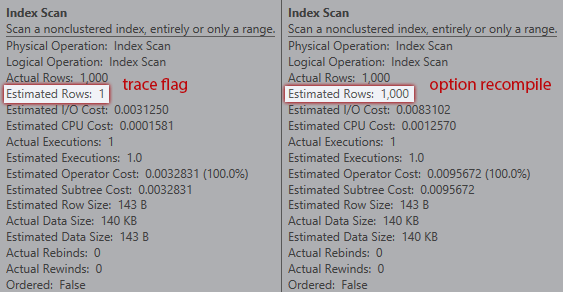
However, the estimates are not the same. Even though the trace flag is enabled, we still get an estimate of 1 coming out of the index scan if we don't use the recompile hint:

Comparing estimates for a trivial plan in the statements grid

Comparing estimates between trace flag (left) and recompile (right)
If you've ever been around me in person, you can probably picture the face I made at this point. I thought for sure that either the KB article listed the wrong trace flag number, or that I needed some other setting enabled for it to truly be active.
Benjamin Nevarez (@BenjaminNevarez) quickly pointed out to me that I needed to look closer at the "Bugs that are fixed in SQL Server 2012 Service Pack 2" KB article. While they've obscured the text behind a hidden bullet under Highlights > Relational Engine, the fix list article does a slightly better job at describing the behavior of the trace flag than the original article (emphasis mine):
So it would appear from this description that the trace flag is only meant to address the issue when the table variable participates in a join. (Why that distinction isn't made in the original article, I have no idea.) But it also works if we make the queries do a little more work – the above query is deemed trivial by the optimizer, and the trace flag doesn't even try to do anything in that case. But it will kick in if cost-based optimization is performed, even without a join; the trace flag simply has no effect on trivial plans. Here is an example of a non-trivial plan that does not involve a join:
DBCC TRACEON(2453);

DECLARE @t TABLE(id INT PRIMARY KEY, name SYSNAME NOT NULL UNIQUE);

INSERT @t SELECT TOP (1000) [object_id], name FROM sys.all_objects;

SELECT TOP (100) t.id, t.name
  FROM @t AS t ORDER BY NEWID();

SELECT TOP (100) t.id, t.name
  FROM @t AS t ORDER BY NEWID() OPTION (RECOMPILE);

DBCC TRACEOFF(2453);
This plan is no longer trivial; optimization is marked as full. The bulk of the cost is moved to a sort operator:
And the estimates line up for both queries (I'll save you the tool tips this time around, but I can assure you they're the same):

Statements grid for less trivial plans with and without the recompile hint
So it seems that the KB article isn't exactly accurate – I was able to coerce the behavior expected of the trace flag without introducing a join. But I do want to test it with a join as well.
A Better Test
Let's take this simple example, with and without the trace flag:
--DBCC TRACEON(2453);

DECLARE @t TABLE(id INT PRIMARY KEY, name SYSNAME NOT NULL UNIQUE);

INSERT @t SELECT TOP (1000) [object_id], name FROM sys.all_objects;

SELECT t.name, c.name
  FROM @t AS t
  LEFT OUTER JOIN sys.all_columns AS c
  ON t.id = c.[object_id];

--DBCC TRACEOFF(2453);
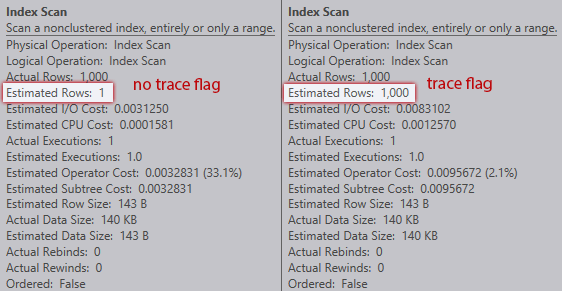
Without the trace flag, the optimizer estimates that one row will come from the index scan against the table variable. However, with the trace flag enabled, it gets the 1,000 rows bang on:

Comparison of index scan estimates (no trace flag on the left, trace flag on the right)
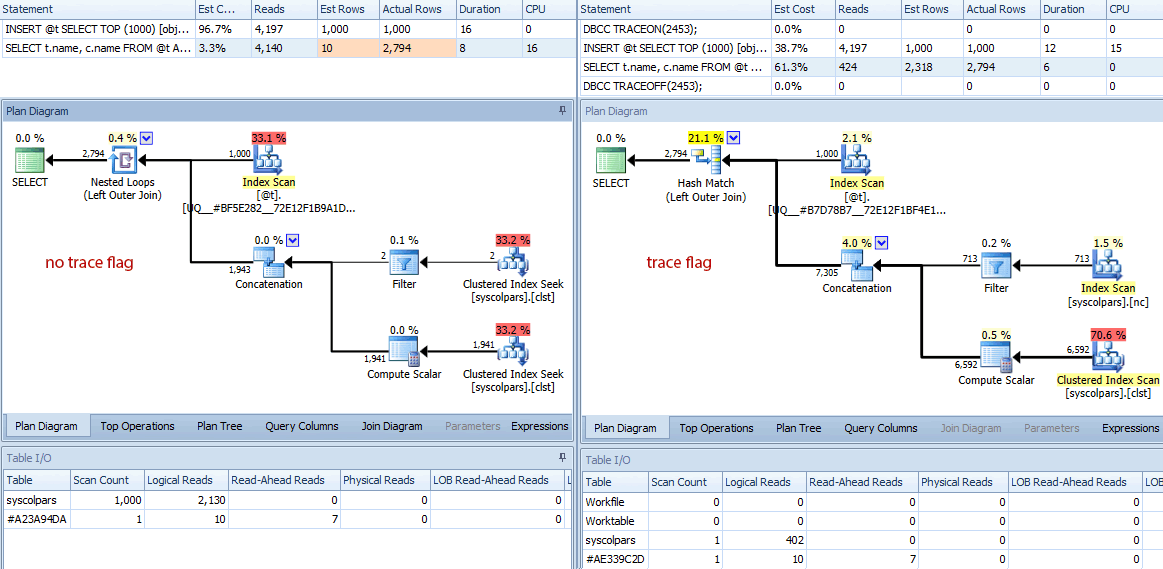
The differences don't stop there. If we take a closer look, we can see a variety of different decisions the optimizer has made, all stemming from these better estimates:

Comparison of plans (no trace flag on the left, trace flag on the right)
A quick summary of the differences:
- The query without the trace flag has performed 4,140 read operations, while the query with the improved estimate has only performed 424 (roughly a 90% reduction).
- The optimizer estimated that the whole query would return 10 rows without the trace flag, and a much more accurate 2,318 rows when using the trace flag.
- Without the trace flag, the optimizer chose to perform a nested loops join (which makes sense when one of the inputs is estimated to be very small). This led to the concatenation operator and both index seeks executing 1,000 times, in contrast with the hash match chosen under the trace flag, where the concatenation operator and both scans only executed once.
- The Table I/O tab also shows 1,000 scans (range scans disguised as index seeks) and a much higher logical read count against
syscolpars(the system table behindsys.all_columns). - While duration wasn't significantly affected (24 milliseconds vs. 18 milliseconds), you can probably imagine the kind of impact these other differences might have on a more serious query.
- If we switch the diagram to estimated costs, we can see how vastly different the table variable can fool the optimizer without the trace flag:

Comparing estimated row counts (no trace flag on the left, trace flag on the right)
It is clear and not shocking that the optimizer does a better job at selecting the right plan when it has an accurate view of the cardinality involved. But at what cost?
Recompiles and Overhead
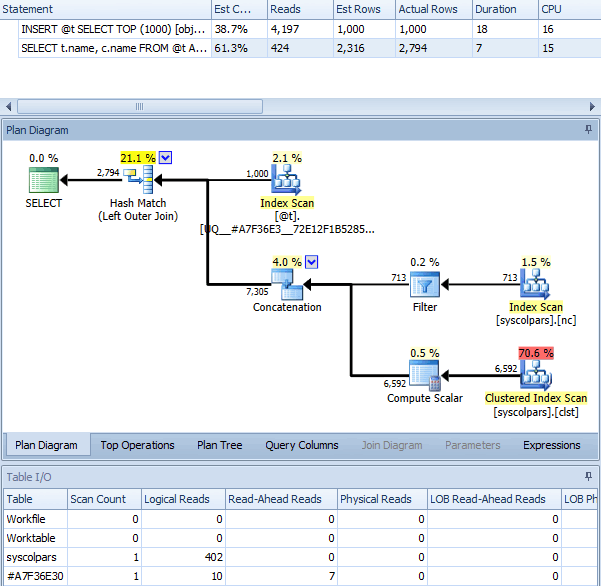
When we use OPTION (RECOMPILE) with the above batch, without the trace flag enabled, we get the following plan – which is pretty much identical to the plan with the trace flag (the only noticeable difference being the estimated rows are 2,316 instead of 2,318):

Same query with OPTION (RECOMPILE)
So, this might lead you to believe that the trace flag accomplishes similar results by triggering a recompile for you every time. We can investigate this using a very simple Extended Events session:
CREATE EVENT SESSION [CaptureRecompiles] ON SERVER
ADD EVENT sqlserver.sql_statement_recompile
  (
    ACTION(sqlserver.sql_text)
  )
  ADD TARGET package0.asynchronous_file_target
  (
    SET FILENAME = N'C:\temp\CaptureRecompiles.xel'
  );
GO
ALTER EVENT SESSION [CaptureRecompiles] ON SERVER STATE = START;
I ran the following set of batches, which executed 20 queries with (a) no recompile option or trace flag, (b) the recompile option, and (c) a session-level trace flag.
/* default - no trace flag, no recompile */

DECLARE @t TABLE(id INT PRIMARY KEY, name SYSNAME NOT NULL UNIQUE);

INSERT @t SELECT TOP (1000) [object_id], name FROM sys.all_objects;

SELECT t.name, c.name
  FROM @t AS t
  LEFT OUTER JOIN sys.all_columns AS c
  ON t.id = c.[object_id];

GO 20

/* recompile */

DECLARE @t TABLE(id INT PRIMARY KEY, name SYSNAME NOT NULL UNIQUE);

INSERT @t SELECT TOP (1000) [object_id], name FROM sys.all_objects;

SELECT t.name, c.name
  FROM @t AS t
  LEFT OUTER JOIN sys.all_columns AS c
  ON t.id = c.[object_id] OPTION (RECOMPILE);

GO 20

/* trace flag */

DBCC TRACEON(2453);

DECLARE @t TABLE(id INT PRIMARY KEY, name SYSNAME NOT NULL UNIQUE);

INSERT @t SELECT TOP (1000) [object_id], name FROM sys.all_objects;

SELECT t.name, c.name
  FROM @t AS t
  LEFT OUTER JOIN sys.all_columns AS c
  ON t.id = c.[object_id];

DBCC TRACEOFF(2453);

GO 20
Then I looked at the event data:
SELECT
  sql_text = LEFT(sql_text, 255),
  recompile_count = COUNT(*)
FROM
(
  SELECT
    x.x.value(N'(event/action[@name="sql_text"]/value)[1]',N'nvarchar(max)')
  FROM
    sys.fn_xe_file_target_read_file(N'C:\temp\CaptureRecompiles*.xel',NULL,NULL,NULL) AS f
    CROSS APPLY (SELECT CONVERT(XML, f.event_data)) AS x(x)
) AS x(sql_text)
GROUP BY LEFT(sql_text, 255);
The results show that no recompiles happened under the standard query, the statement referencing the table variable was recompiled once under the trace flag and, as you might expect, every time with the RECOMPILE option:
| sql_text | recompile_count |
|---|---|
| /* recompile */ DECLARE @t TABLE (i INT … | 20 |
| /* trace flag */ DBCC TRACEON(2453); DECLARE @t … | 1 |
Results of query against XEvents data
Next, I turned off the Extended Events session, then changed the batch to measure at scale. Essentially the code measures 1,000 iterations of creating and populating a table variable, then selects its results into a #temp table (one way to suppress output of that many throwaway resultsets), using each of the three methods.
SET NOCOUNT ON;

/* default - no trace flag, no recompile */

SELECT SYSDATETIME();
GO
DECLARE @t TABLE(id INT PRIMARY KEY, name SYSNAME NOT NULL UNIQUE);

INSERT @t SELECT TOP (1000) [object_id], name FROM sys.all_objects;

SELECT t.id, c.name
  INTO #x
  FROM @t AS t
  LEFT OUTER JOIN sys.all_columns AS c
  ON t.id = c.[object_id];

DROP TABLE #x;

GO 1000
SELECT SYSDATETIME();
GO


/* recompile */

DECLARE @t TABLE(id INT PRIMARY KEY, name SYSNAME NOT NULL UNIQUE);

INSERT @t SELECT TOP (1000) [object_id], name FROM sys.all_objects;

SELECT t.id, c.name
  INTO #x
  FROM @t AS t
  LEFT OUTER JOIN sys.all_columns AS c
  ON t.id = c.[object_id] OPTION (RECOMPILE);

DROP TABLE #x;

GO 1000
SELECT SYSDATETIME();
GO


/* trace flag */

DBCC TRACEON(2453);

DECLARE @t TABLE(id INT PRIMARY KEY, name SYSNAME NOT NULL UNIQUE);

INSERT @t SELECT TOP (1000) [object_id], name FROM sys.all_objects;

SELECT t.id, c.name
  INTO #x
  FROM @t AS t
  LEFT OUTER JOIN sys.all_columns AS c
  ON t.id = c.[object_id];

DROP TABLE #x;

DBCC TRACEOFF(2453);

GO 1000
SELECT SYSDATETIME();
GO
I ran this batch 10 times and took the averages; they were:
| Method | Average Duration (milliseconds) |
|---|---|
| Default | 23,148.4 |
| Recompile | 29,959.3 |
| Trace Flag | 22,100.7 |
Average duration for 1,000 iterations
In this case, getting the right estimates every time using the recompile hint was much slower than the default behavior, but using the trace flag was slightly faster. This makes sense because – while both methods correct the default behavior of using a fake estimate (and getting a bad plan as a result), recompiles take resources and, when they don't or can't yield a more efficient plan, tend to contribute to overall batch duration.
Seems straightforward, but wait…
The above test is slightly – and intentionally – flawed. We're inserting the same number of rows (1,000) into the table variable every time. What happens if the initial population of the table variable varies for different batches? Surely we'll see recompiles then, even under the trace flag, right? Time for another test. Let's set up a slightly different Extended Events session, just with a different target file name (to not mix up any data from the other session):
CREATE EVENT SESSION [CaptureRecompiles_v2] ON SERVER
ADD EVENT sqlserver.sql_statement_recompile
  (
    ACTION(sqlserver.sql_text)
  )
  ADD TARGET package0.asynchronous_file_target
  (
    SET FILENAME = N'C:\temp\CaptureRecompiles_v2.xel'
  );
GO
ALTER EVENT SESSION [CaptureRecompiles_v2] ON SERVER STATE = START;
Now, let's inspect this batch, setting up row counts for each iteration that are significantly different. We'll run this three times, removing the appropriate comments so that we have one batch without a trace flag or explicit recompile, one batch with the trace flag, and one batch with OPTION (RECOMPILE) (having an accurate comment at the beginning makes these batches easier to identify in places like Extended Events output):
/* default, no trace flag or recompile */
/* recompile */
/* trace flag */

DECLARE @i INT = 1;

WHILE @i <= 6
BEGIN
  --DBCC TRACEON(2453); -- uncomment this for trace flag

  DECLARE @t TABLE(id INT PRIMARY KEY);

  INSERT @t SELECT TOP (CASE @i
      WHEN 1 THEN 24
	  WHEN 2 THEN 1782
	  WHEN 3 THEN 1701
	  WHEN 4 THEN 12
	  WHEN 5 THEN 15
	  WHEN 6 THEN 1560
	END) [object_id]
    FROM sys.all_objects;

  SELECT t.id, c.name
    FROM @t AS t
    INNER JOIN sys.all_objects AS c
    ON t.id = c.[object_id]
    --OPTION (RECOMPILE); -- uncomment this for recompile

  --DBCC TRACEOFF(2453); -- uncomment this for trace flag

  DELETE @t;
  SET @i += 1;
END
I ran these batches in Management Studio, opened them individually in Plan Explorer, and filtered the statements tree on just the SELECT query. We can see the different behavior in the three batches by looking at estimated and actual rows:

Comparison of three batches, looking at estimated vs. actual rows
In the right-most grid, you can clearly see where recompiles did not happen under the trace flag
We can check the XEvents data to see what actually happened with recompiles:
SELECT
  sql_text = LEFT(sql_text, 255),
  recompile_count = COUNT(*)
FROM
(
  SELECT
    x.x.value(N'(event/action[@name="sql_text"]/value)[1]',N'nvarchar(max)')
  FROM
    sys.fn_xe_file_target_read_file(N'C:\temp\CaptureRecompiles_v2*.xel',NULL,NULL,NULL) AS f
    CROSS APPLY (SELECT CONVERT(XML, f.event_data)) AS x(x)
) AS x(sql_text)
GROUP BY LEFT(sql_text, 255);
Results:
| sql_text | recompile_count |
|---|---|
| /* recompile */ DECLARE @i INT = 1; WHILE ... | 6 |
| /* trace flag */ DECLARE @i INT = 1; WHILE ... | 4 |
Results of query against XEvents data
Very interesting! Under the trace flag, we *do* see recompiles, but only when the runtime parameter value has varied significantly from the cached value. When the runtime value is different, but not by very much, we don't get a recompile, and the same estimates are used. So it is clear that the trace flag introduces a recompile threshold to table variables, and I have confirmed (through a separate test) that this uses the same algorithm as the one described for #temp tables in this "ancient" but still relevant paper. I will prove this in a follow-up post.
Again we'll test performance, running the batch 1,000 times (with the Extended Events session turned off), and measuring duration:
| Method | Average Duration (milliseconds) |
|---|---|
| Default | 101,285.4 |
| Recompile | 111,423.3 |
| Trace Flag | 110,318.2 |
Average duration for 1,000 iterations
In this specific scenario, we lose about 10% of the performance by forcing a recompile every time or by using a trace flag. Not exactly sure how the delta was distributed: Were the plans based on better estimates not significantly better? Did recompiles offset any performance gains by that much? I don't want to spend too much time on this, and it was a trivial example, but it goes to show you that playing with the way the optimizer works can be an unpredictable affair. Sometimes you may be better off with the default behavior of cardinality = 1, knowing that you will never cause any undue recompiles. Where the trace flag might make a lot of sense is if you have queries where you are repeatedly populating table variables with the same set of data (say, a Postal Code lookup table) or you are always using 50 or 1,000 rows (say, populating a table variable for use in pagination). In any case, you should certainly test the impact this has on any workload where you plan to introduce the trace flag or explicit recompiles.
TVPs and Table Types
I was also curious how this would affect table types, and whether we would see any improvements in cardinality for TVPs, where this same symptom exists. So I created a simple table type that mimics the table variable in use thus far:
USE MyTestDB;
GO

CREATE TYPE dbo.t AS TABLE
(
  id INT PRIMARY KEY
);
Then I took the above batch and simply replaced DECLARE @t TABLE(id INT PRIMARY KEY); with DECLARE @t dbo.t; - everything else stayed exactly the same. I ran the same three batches, and here is what I saw:

Comparing estimates and actuals between default behavior, option recompile and trace flag 2453
So yes, it seems that the trace flag works the exact same way with TVPs - recompilations generate new estimates for the optimizer when the row counts surpass the recompilation threshold, and are skipped when the row counts are "close enough."
Pros, Cons and Caveats
One advantage of the trace flag is that you can avoid some recompiles and still see table cardinality - as long as you expect the number of rows in the table variable to be stable, or do not observe significant plan deviations due to varying cardinality. Another is that you can enable it globally or at the session level and not have to go introduce recompile hints to all of your queries. And finally, at least in the case where table variable cardinality was stable, proper estimates led to better performance than the default, and also better performance than using the recompile option - all those compilations certainly can add up.
There are some disadvantages, too, of course. One that I mentioned above is that compared to OPTION (RECOMPILE) you miss out on certain optimizations, such as parameter embedding. Another is that the trace flag will not have the impact you expect on trivial plans. And one I discovered along the way is that using the QUERYTRACEON hint to enforce the trace flag at the query level doesn't work - as far as I can tell, the trace flag must be in place when the table variable or TVP is created and/or populated in order for the optimizer to see cardinality above 1.
Keep in mind that running the trace flag globally introduces the possibility of query plan regressions to any query involving a table variable (which is why this feature was introduced under a trace flag in the first place), so please be sure to test your entire workload no matter how you use the trace flag. Also, when you're testing this behavior, please do so in a user database; some of the optimizations and simplifications that you normally expect to occur just don't happen when the context is set to tempdb, so any behavior you observe there may not stay consistent when you move the code and settings to a user database.
Conclusion
If you use table variables or TVPs with a large but relatively consistent number of rows, you may find it beneficial to enable this trace flag for certain batches or procedures in order to get accurate table cardinality without manually forcing a recompile on individual queries. You can also use the trace flag at the instance level, which will affect all queries. But like any change, in either case, you will need to be diligent in testing the performance of your entire workload, looking out explicitly for any regressions, and ensuring that you want the trace flag behavior because you can trust the stability of your table variable row counts.
I am glad to see the trace flag added to SQL Server 2014, but it would be better if that just became the default behavior. Not that there is any significant advantage to using large table variables over large #temp tables, but it would be nice to see more parity between these two temporary structure types that could be dictated at a higher level. The more parity we have, the less people have to deliberate over which one they should use (or at least have fewer criteria to consider when choosing). Martin Smith has a great Q & A over at dba.stackexchange that is probably now due for an update: What's the difference between a temp table and table variable in SQL Server?
Important Note
If you're going to install SQL Server 2012 Service Pack 2 (whether or not it is to make use of this trace flag), please also see my post about a regression in SQL Server 2012 and 2014 that can - in rare scenarios - introduce potential data loss or corruption during online index rebuilds. There are cumulative updates available for SQL Server 2012 SP1 and SP2 and also for SQL Server 2014. There will be no fix for the 2012 RTM branch.
Further testing
I do have other things on my list to test. For one, I'd like to see if this trace flag has any effect on In-Memory table types in SQL Server 2014. I am also going to prove beyond a shadow of a doubt that trace flag 2453 uses the same recompilation threshold for table variables and TVPs as it does for #temp tables.


Aaron,
Glad you saw this in SP2 and tested it so shortly after it came out. Looking at it originally I thought about the QUERYTRACEON to use the method for selected queries rather than all and then how good it would be to not be a sysadmin to use QUERYTRACEON. Very interesting find you made with using QUERYTRACEON in your testing.
Chris
Great analysis, Aaron.
One addition thing I am interested to know is how the trace flag affects 'cardinality hinting' as in:
As always, fantastic article and research Aaron! Thanks for sharing this with the DBA community.
Hi Aaron,
Thanks for the excellent post.
Thanks,
Karthik.
good article and it solved my table variable performance issue, but raised another… if I understand correctly DBCC TRACEON(2453) requires sysamin rights, ok in dev but having problems giving this to only this proc in the database across a number of servers…. have you a route, script for this which works with (non sysadmin) users sql authenticated?
There are some convoluted ways to get peon users to be able to run DBCC TRACEON, e.g. see this script from Kenneth Fisher:
http://sqlstudies.com/2014/02/26/impersonating-a-server-level-permissions/
Thanks
To bypass the "problem" of being a sysadmin, I Created a user sysadmin and granted my application user to impersonate the admin user
USE master
GRANT IMPERSONATE ON login::xxxAdmin TO UserAPP
then just before the exec of my procedure, I switch the context of the user, then apply the dbcc traceON, after the procedure, I apply dbcc traceoff and revert.
The procedure will be encrypted in order to hide the privilege elevation…
Anyway, this is totally "stupid" (sorry to say that) from Microsoft to give us a fix to bypass a problem of sqlserver self, that only sysadmin can use…