
Emulating the GROUPS Window Frame Option
Generally in life, it’s good to have the perfect tools to handle any given task. But sometimes a tool you need isn’t available, and you have to figure out a solution without it. The same goes specifically for handling T-SQL querying tasks in terms of supported language elements. T-SQL, the dialect, supports a subset of the features from standard SQL. Sometimes, you need to solve a T-SQL querying task, and you know the natural tool to solve it is a feature that’s part of the SQL standard but isn’t available in T-SQL. So you have to come up with a supported alternative. This could also happen if you need to migrate code written for another database platform with a different dialect of SQL to T-SQL.
This article is dedicated to such a case—specifically, a standard SQL feature related to window functions called the GROUPS window frame option. At the time of writing, T-SQL doesn’t support it, but PostgreSQL—for example—does. I’ll explain what this feature does and how to emulate it in T-SQL.
Sample Data
In my examples, I’ll use a table called Orders. Use the following code to create the Orders table and populate it with a small set of sample data to help you verify the validity of the solutions:
SET NOCOUNT ON;

USE tempdb;

DROP TABLE IF EXISTS dbo.Orders;

CREATE TABLE dbo.Orders
(
  orderid   INT         NOT NULL,
  orderdate DATE        NOT NULL,
  empid     INT         NOT NULL,
  custid    VARCHAR(10) NOT NULL,
  qty       INT         NOT NULL,
  CONSTRAINT PK_Orders PRIMARY KEY CLUSTERED(orderid),
  INDEX idx_nc_od_oid_i_qty UNIQUE NONCLUSTERED(orderdate, orderid) INCLUDE(qty)
);

INSERT INTO dbo.Orders(orderid, orderdate, empid, custid, qty)
  VALUES( 2, '20220107', 3, 'B', 10),
        ( 3, '20220107', 1, 'C', 10),
        ( 5, '20220107', 1, 'A', 30),
        ( 7, '20220110', 4, 'A', 40),
        (11, '20220110', 1, 'C', 10),
        (13, '20220111', 2, 'B', 20),
        (17, '20220111', 4, 'A', 10),
        (19, '20220111', 2, 'C', 20),
        (23, '20220111', 3, 'B', 15),
        (29, '20220112', 3, 'B', 20),
        (31, '20220112', 3, 'C', 30),
        (37, '20220112', 3, 'C', 30);
The nonclustered index idx_nc_od_oid_i_qty is designed to support the solutions I’ll cover in this article.
To test the performance of the solutions, you’ll need a larger set of sample data. Use the following code to create a helper function called GetNums, which generates a sequence of integers in a requested range:
CREATE FUNCTION dbo.GetNums(@low AS BIGINT = 1, @high AS BIGINT)
  RETURNS TABLE
AS
RETURN
  WITH
    L0 AS ( SELECT 1 AS c
            FROM (VALUES(1),(1),(1),(1),(1),(1),(1),(1),
                        (1),(1),(1),(1),(1),(1),(1),(1)) AS D(c) ),
    L1 AS ( SELECT 1 AS c FROM L0 AS A CROSS JOIN L0 AS B ),
    L2 AS ( SELECT 1 AS c FROM L1 AS A CROSS JOIN L1 AS B ),
    L3 AS ( SELECT 1 AS c FROM L2 AS A CROSS JOIN L2 AS B ),
    Nums AS ( SELECT ROW_NUMBER() OVER(ORDER BY (SELECT NULL)) AS rownum
              FROM L3 )
  SELECT TOP(@high - @low + 1)
     rownum AS rn,
     @high + 1 - rownum AS op,
     @low - 1 + rownum AS n
  FROM Nums
  ORDER BY rownum;
GO
Use the following code to populate the Orders table with a large set of sample data:
DECLARE
  @numrows   AS INT = 1000000,
  @numemps   AS INT = 500,
  @numcusts  AS INT = 20000,
  @maxqty    AS INT = 100,
  @startdate AS DATE = '20180101',
  @enddate   AS DATE = '20221231';

TRUNCATE TABLE dbo.Orders;

INSERT INTO dbo.Orders WITH(TABLOCK) (orderid, orderdate, empid, custid, qty)
  SELECT N.n AS orderid,
    DATEADD(day, ABS(CHECKSUM(NEWID())) % (DATEDIFF(day, @startdate, @enddate) + 1), @startdate) AS orderdate,
    ABS(CHECKSUM(NEWID())) % @numemps + 1 AS empid,
    'C' + CAST(ABS(CHECKSUM(NEWID())) % @numcusts + 1 AS VARCHAR(9)) AS custid,
    ABS(CHECKSUM(NEWID())) % @maxqty + 1 AS qty
  FROM dbo.GetNums(1, @numrows) AS N;
Feel free, of course, to test the performance of the solutions with different data loading parameters if you’d like.
Understanding Window Frame Units
As prerequisite knowledge for this article, I’m assuming you’re familiar with T-SQL’s support for window functions and the elements in their specification, including the window frame. Still, I’ll provide a quick review of the syntax.
As a reminder, window functions supporting a frame, such as aggregate window functions and the FIRST_VALUE and LAST_VALUE functions, have the following syntax:
[ <window partition clause> ]
[ <window order clause> [ <window frame clause> ] ] )
The optional window partition clause defines a subset of rows from the whole window of rows the function can see. The window frame clause defines a subset of rows from the partition (if present) or from the whole window (if not present).
The more detailed syntax for the window frame clause is as follows:
Assuming ordering of rows based on the window order clause, the frame defines a subset of rows between two delimiters. The window frame units part defines the units for the delimiters, and the window frame extent part defines the actual delimiters.
The SQL standard supports three window frame units: ROWS, RANGE, and GROUPS. T-SQL supports the ROWS option in full, the RANGE option partially, and has no support for the GROUPS option at all.
The ROWS Option
As a reminder, the ROWS option allows you to define frame delimiters in a certain offset from the current row in terms of a number of rows. Here’s a simple example:
SELECT orderid, orderdate, qty,
  SUM(qty) OVER(ORDER BY orderdate
                ROWS BETWEEN 2 PRECEDING AND CURRENT ROW) AS sumrows\n\n<strong>Figure
FROM dbo.Orders;
As you can see, there’s no window partition clause, so the frame is extracted from the entire window of rows. Window ordering is based on the orderdate column. Then, using the ROWS units, you define a frame starting with two rows before the current and ending with the current row. In simple English terms, the function computes the sum of quantities from the last three rows based on orderdate ordering.
Here's the output of this query when applied to the small set of sample data:
orderid     orderdate  qty         sumrows
----------- ---------- ----------- -----------
2           2022-01-07 10          10
3           2022-01-07 10          20
5           2022-01-07 30          50
7           2022-01-10 40          80
11          2022-01-10 10          80
13          2022-01-11 20          70
17          2022-01-11 10          40
19          2022-01-11 20          50
23          2022-01-11 15          45
29          2022-01-12 20          55
31          2022-01-12 30          65
37          2022-01-12 30          80
Figure 1 illustrates the applicable frame of rows and the function’s result for a sample row (with order ID 17).
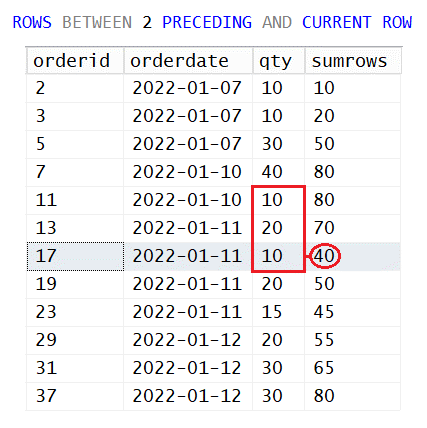 Figure 1: Understanding the ROWS Option
One tricky aspect of the ROWS option is it can result in a nondeterministic calculation when the window ordering is not total ordering (i.e., when the ordering elements don’t uniquely identify a row). This is the case in our example. The orderdate column isn’t unique, so there’s no preference between rows with the same orderdate values. Actual access order to the rows, which depends on the chosen plan and physical data layout, ends up determining the preference between rows with the same orderdate values. If you run the query twice—without any data changes happening between executions—you can theoretically end up with different results.
But what if you require a deterministic definition of the frame with guaranteed repeatable results?
One way to achieve this while still using the ROWS option is to define total ordering. In our example, this can be achieved by adding the orderid column as the ordering tiebreaker:
SELECT orderid, orderdate, qty,
  SUM(qty) OVER(ORDER BY orderdate, orderid
                ROWS BETWEEN 2 PRECEDING AND CURRENT ROW) AS sumrows
FROM dbo.Orders;
You use this option when you need both determinism and a guaranteed maximum frame size in terms of number of rows. In our case, the frame will never have more than three rows.
If you don’t need to limit the frame size, the SQL standard gives you two additional ways to define frame boundaries using the RANGE and GROUPS units.
The RANGE Option
The idea behind the RANGE option is it allows you to define a frame delimiter as an offset from the current row’s ordering value, as opposed to an offset in terms of a number of rows. For example, suppose you wanted to compute the total quantities of the orders from the last three days. The SQL standard’s syntax for it, albeit not supported currently in T-SQL, goes like this:
SELECT orderid, orderdate, qty,
  SUM(qty) OVER(ORDER BY orderdate
                RANGE BETWEEN INTERVAL '2' DAY PRECEDING AND CURRENT ROW) AS sumrange
FROM dbo.Orders;
Here’s the expected output of this query:
orderid     orderdate  qty         sumrange
----------- ---------- ----------- -----------
2           2022-01-07 10          50
3           2022-01-07 10          50
5           2022-01-07 30          50
7           2022-01-10 40          50
11          2022-01-10 10          50
13          2022-01-11 20          115
17          2022-01-11 10          115
19          2022-01-11 20          115
23          2022-01-11 15          115
29          2022-01-12 20          195
31          2022-01-12 30          195
37          2022-01-12 30          195
Figure 2 illustrates the applicable frame of rows and the function’s result for our sample row with order ID 17.
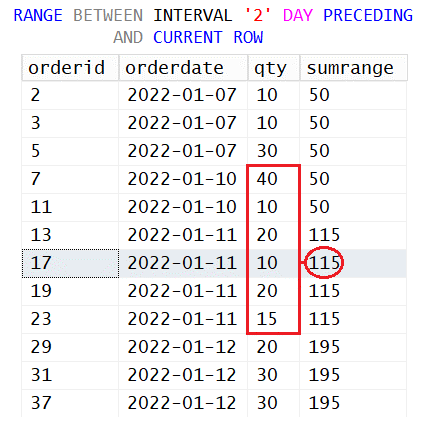 Figure 2: Understanding the RANGE Option
The first delimiter is the ordering value two days before the current row’s ordering value. The sample row’s order date is 2022-01-11, so the first delimiter is 2022-01-09. Since this date doesn’t exist in the data, the actual first delimiter is the next existing date, 2022-01-10. The second delimiter is the current row’s ordering value, meaning the order date 2022-01-11. As you can see in the figure, there are a few additional rows with the same order date as the sample row’s order date, so they’re all included in the frame. The frame ends up including six rows in this row’s case.
Currently, T-SQL supports only UNBOUNDED and CURRENT ROW as delimiters with the RANGE option. So if you try running the above query against SQL Server or Azure SQL Database, you get an error. To achieve the task with T-SQL, you need to use a supported alternative like the following, which uses joining and grouping:
SELECT O1.orderid, O1.orderdate, O1.qty, SUM(O2.qty) AS sumrange
FROM dbo.Orders AS O1
  INNER JOIN dbo.Orders AS O2
    ON O2.orderdate BETWEEN DATEADD(day, -2, O1.orderdate) AND O1.orderdate
GROUP BY O1.orderid, O1.orderdate, O1.qty;
The GROUPS Option
And now the focus of this article: the SQL standard’s GROUPS option. When the window ordering is total ordering, each distinct ordering value appears in only one row. But when the window ordering is not total ordering—like when you order by the orderdate column—each distinct ordering value could appear in a group of rows. Using the GROUPS option, you can define a delimiter as an offset in terms of a number groups of distinct ordering values with respect to the current group’s ordering value. You could specify a number of groups PRECEDING, a number of groups FOLLOWING, and CURRENT ROW (meaning current group) as delimiters. You see how the GROUPS option allows you to combine certain aspects of the ROWS and RANGE options.
Recall the example shown earlier with RANGE where you wanted to compute the total quantities of the orders from the last three days. But what if you wanted the last three days with order activity? If your company doesn’t process orders on weekends and holidays, the meaning of “last three days” and “last three days with order activity” could be different. The SQL standard gives you the RANGE option to handle the former and the GROUPS option to handle the latter.
Here’s how you’re supposed to define a frame representing the last three days with order activity using GROUPS:
SELECT orderid, orderdate, qty,
  SUM(qty) OVER(ORDER BY orderdate
                GROUPS BETWEEN 2 PRECEDING AND CURRENT ROW) AS sumgroups
FROM dbo.Orders;
Here’s the expected output of this query:
orderid     orderdate  qty         sumgroups
----------- ---------- ----------- -----------
2           2022-01-07 10          50
3           2022-01-07 10          50
5           2022-01-07 30          50
7           2022-01-10 40          100
11          2022-01-10 10          100
13          2022-01-11 20          165
17          2022-01-11 10          165
19          2022-01-11 20          165
23          2022-01-11 15          165
29          2022-01-12 20          195
31          2022-01-12 30          195
37          2022-01-12 30          195
Figure 3 illustrates the applicable frame of rows and the function’s result for our sample row with order ID 17.
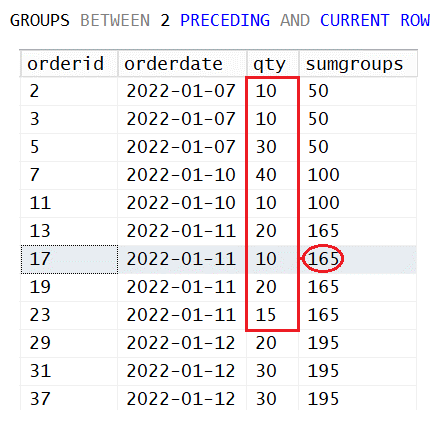 Figure 3: Understanding the GROUPS Option
Each distinct orderdate value defines an ordering group. Given the sample row with order ID 17, the first frame delimiter starts two groups prior to the current (i.e., the order date 2022-01-07). The second frame delimiter is the current row’s order date value, 2022-01-11. The frame for this sample row ends up including nine rows.
Emulating GROUPS
I’ll cover two different solutions for emulating the GROUPS option. I’ll use the last task as the specific example for what needs to be computed—the total quantities of the last three days with order activity.
Solution 1: Using Dense Ranks, Joining, and Grouping
You’ve just learned the GROUPS option deals with offsets in terms of a number of groups of distinct ordering values. One approach to emulate the option is to first number (or rank) distinct groups of ordering values. This can be done easily with the DENSE_RANK function, like so:
SELECT orderid, orderdate, qty,
  DENSE_RANK() OVER(ORDER BY orderdate) AS drk
FROM dbo.Orders;
This query generates the following output:
orderid     orderdate  qty         drk
----------- ---------- ----------- --------------------
2           2022-01-07 10          1
3           2022-01-07 10          1
5           2022-01-07 30          1
7           2022-01-10 40          2
11          2022-01-10 10          2
13          2022-01-11 20          3
17          2022-01-11 10          3
19          2022-01-11 20          3
23          2022-01-11 15          3
29          2022-01-12 20          4
31          2022-01-12 30          4
37          2022-01-12 30          4
Now, if T-SQL had complete support for the RANGE option, you’d have been able to achieve our task like so:
WITH C AS
(
  SELECT orderid, orderdate, qty,
    DENSE_RANK() OVER(ORDER BY orderdate) AS drk
  FROM dbo.Orders
)
SELECT orderid, orderdate, qty,
  SUM(qty) OVER(ORDER BY drk
                RANGE BETWEEN 2 PRECEDING AND CURRENT ROW) AS sumgroups
FROM C;
This code defines a CTE called C based on the query computing the dense rank values in the result column drk. The outer query against C then uses a window function to compute the desired total quantities of the last three days of activity. The window function does so by defining a window order clause based on drk and then a RANGE-based frame starting with two dense rank values preceding and ending with the current dense rank value. Unfortunately, as you know, T-SQL doesn’t support 2 PRECEDING as a RANGE delimiter.
You could emulate the RANGE option in T-SQL using joining and grouping, like so:
WITH C AS
(
  SELECT orderid, orderdate, qty,
    DENSE_RANK() OVER(ORDER BY orderdate) AS drk
  FROM dbo.Orders
)
SELECT C1.orderid, C1.orderdate, C1.qty, SUM(C2.qty) AS sumgroups
FROM C AS C1
  INNER JOIN C AS C2
    ON C2.drk BETWEEN C1.drk - 2 AND C1.drk
GROUP BY C1.orderid, C1.orderdate, C1.qty;
This solution is indeed supported in T-SQL but, unfortunately, it results in a poor-performing plan, as shown in Figure 4.
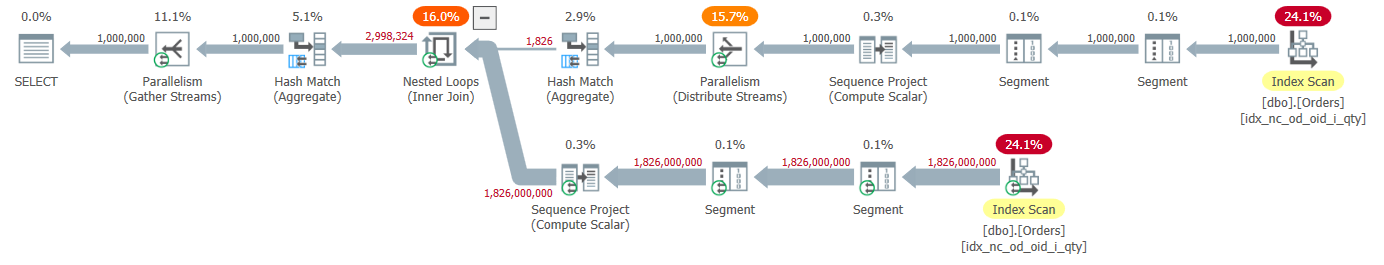 Figure 4: Plan for Solution 1
This plan was produced against the large set of sample data. The Orders table was populated with one million rows, with 1,826 distinct order dates (across five years).
To understand the plan, first examine the outer input of the Nested Loops operator. It scans the data from the supporting nonclustered index and computes the dense rank values. To reduce the work, the plan locally groups the data by the dense rank values and computes total quantities per group prior to the join. This is why you see the Hash Match (Aggregate) operator delivering 1,826 rows as the outer input to the Nested Loops operator.
The inner input to the Nested Loops operator is then executed once per group—1,826 times—each of which scans the index and computes dense rank values. This results in 1,826,000,000 rows produced for all executions.
The Nested Loops operator matches the right rows between the outer and inner inputs, resulting in close to three million rows. Finally, the plan applies a global grouping and aggregation against the join’s result.
It took this plan over five minutes to complete on my system (311 seconds), with results discarded in SQL Server Management Studio (SSMS). That’s pretty slow for a one million-row input!
Solution 2: Using Grouping, Joining, and Windowing
The second solution is a bit more creative and requires a bit more sophistication. In the first step, you combine grouping and windowing. You group the rows from the Orders table by orderdate and compute a grouped sum of the quantities per group (in other words, the total daily quantities). You then apply a windowed sum with the grouped sum as input. It looks a bit strange because the expression starts with SUM(SUM(qty)) OVER…, but it’s perfectly valid. The inner SUM is a grouped sum, and the outer SUM is a windowed SUM applied to the grouped SUM. The window function uses orderdate as the window ordering element, and with the ROWS option, it defines a frame based on the last three rows.
Here’s the code implementing this first step:
SELECT orderdate, SUM(qty) AS daytotal,
  SUM(SUM(qty)) OVER(ORDER BY orderdate
                     ROWS BETWEEN 2 PRECEDING AND CURRENT ROW) AS sumgroups
FROM dbo.Orders
GROUP BY orderdate;
This code generates the following output:
orderdate   daytotal    sumgroups
----------  ----------- -----------
2022-01-07  50          50
2022-01-10  50          100
2022-01-11  65          165
2022-01-12  80          195
The neat part of this idea is because you applied preliminary grouping by orderdate and added the windowing, the ROWS option effectively gives you what you needed from the unsupported GROUPS option. As you can see, you get the distinct daily groups and their aggregate results (total of last three days) but without the detail rows (the orders) you also need to return. Fortunately, this part is easy to achieve with a simple join between the Orders table and the result of the first step, like so:
WITH C AS
(
  SELECT orderdate,
    SUM(SUM(qty)) OVER(ORDER BY orderdate
                       ROWS BETWEEN 2 PRECEDING AND CURRENT ROW) AS sumgroups
  FROM dbo.Orders
  GROUP BY orderdate
)
SELECT O.orderid, O.orderdate, O.qty, C.sumgroups
FROM dbo.Orders AS O
  INNER JOIN C
    ON O.orderdate = C.orderdate;
It’s pretty neat, if I may say so myself!
The plan for this solution is shown in Figure 5.
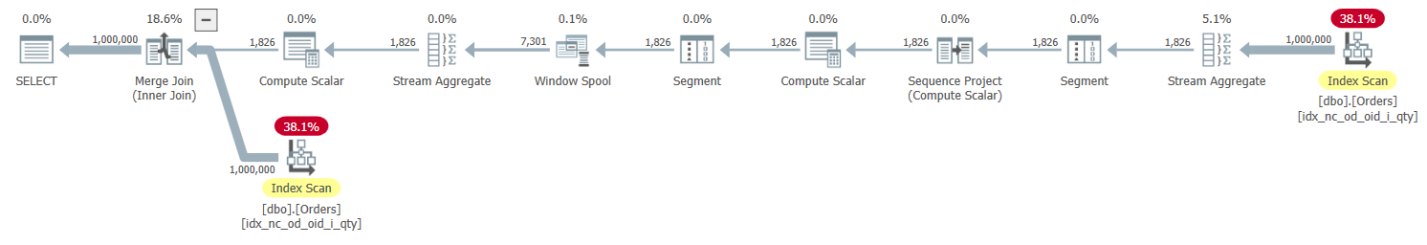 Figure 5: Plan for Solution 2
It’s an efficient plan. It starts by scanning the data from the supporting index and computing the grouped aggregate using a Stream Aggregate relying on index order. It then computes the window aggregate, relying on the ordered data delivered by the grouped aggregate. Finally, it uses a Merge Join between the aggregated result and the result of one more ordered scan of the supporting index, which obtains the detail rows.
It took this plan less than one second (820 ms) to complete on my system, with results discarded in SSMS. This is compared to the more than five minutes it took the first solution to complete!
The suggested solution works fine when you need to emulate a sum window aggregate with the GROUPS option. But if you need to emulate an average aggregate, applying a windowed AVG on top of a grouped AVG won’t do the trick. To emulate an average calculation correctly, you’ll need to compute a windowed SUM of a grouped SUM and divide the result by a windowed SUM of a grouped COUNT, like so:
WITH C AS
(
  SELECT orderdate,
    SUM(SUM(qty)) OVER(ORDER BY orderdate
                       ROWS BETWEEN 2 PRECEDING AND CURRENT ROW) AS sumgroups,
    SUM(COUNT(qty)) OVER(ORDER BY orderdate
                         ROWS BETWEEN 2 PRECEDING AND CURRENT ROW) AS countgroups
  FROM dbo.Orders
  GROUP BY orderdate
)
SELECT O.orderid, O.orderdate, O.qty, 1.0 * C.sumgroups / C.countgroups AS avggroups
FROM dbo.Orders AS O
  INNER JOIN C
    ON O.orderdate = C.orderdate;
This query generates the following output against the small set of sample data:
orderid     orderdate  qty         avggroups
----------- ---------- ----------- ----------------
2           2022-01-07 10          16.666666666666
3           2022-01-07 10          16.666666666666
5           2022-01-07 30          16.666666666666
7           2022-01-10 40          20.000000000000
11          2022-01-10 10          20.000000000000
13          2022-01-11 20          18.333333333333
17          2022-01-11 10          18.333333333333
19          2022-01-11 20          18.333333333333
23          2022-01-11 15          18.333333333333
29          2022-01-12 20          21.666666666666
31          2022-01-12 30          21.666666666666
37          2022-01-12 30          21.666666666666
Conclusion
The standard window frame units called GROUPS allows you to define window frame delimiters as an offset in terms of a number of groups of distinct ordering values from the current row. It’s a mouthful, but hopefully having read the article, this now makes perfect sense to you. T-SQL currently doesn’t support this feature, so if you need this functionality, you have to use a supported workaround. I showed two techniques to emulate the GROUPS option. One is probably more intuitive—yet very slow—and uses dense ranks, joining, and grouping. The other is a bit more sophisticated but is very fast, using grouping, joining, and windowing.

Nice!
Thanks Guy!
Hey Itzik, very fast solution, I've tried some other variations and here is something without a join, not as fast (based on grouping sets concept):
Hi Kamil,
That's a pretty clever technique; I'm impressed!
In terms of performance, as long as the plan uses batch processing (2019+ Enterprise using batch mode on rowstore or 2016+ with dummy columnstore index), on my machine I'm getting pretty close runtime to my solution with the join. A bit longer, but pretty close.
By default I'm getting a parallel plan with a sort, ending up with a bit longer runtime compared to my solution but twice the CPU. When forcing a serial plan with MAXDOP 1, the plan loses the sort, and both runtime and CPU are just slightly longer than mine.
That's pretty cool.
Thanks Itzik!
N.b. it is possible to rewrite it literally using grouping sets, although the performance is a bit disappointing. The key here is to partition windowed SUM() by orderid, which is NULL in case of date-based set, it gives us grouping we need for the next step.
Kamil, yes, the version with the GROUPING SETS syntax results in a couple of extra sorts in the plan. Nice idea though.
Hi Itzik,
I have tried to solve the problem before reading your two solutions. I'll post here my solution because it's slightly different and the performance is comparable with your second one.
Thanks for your very interesting and challenging article.
with
C as (
select orderid, orderdate, qty, DENSE_RANK() over (order by orderdate) grp
from orders
),
C1 as (
select grp, sum(qty) as sumXGrp
from C
group by grp),
C2 as (
select grp, sum(sumXGrp) over (order by grp rows between 2 preceding and current row) targetSum
from C1
)
select orderid, orderdate, qty, c2.targetSum
from C
inner join C2 on c.grp = c2.grp;