This is the third in a five-part series taking a deep dive into the way SQL Server row mode parallel plans start executing. Part 1 initialized execution context zero for the parent task, and part 2 created the query scan tree. We are now ready to start the query scan, perform some early phase processing, and start the first additional parallel tasks.
Query Scan Start Up
Recall that only the parent task exists right now, and the exchanges (parallelism operators) have only a consumer side. Still, this is enough for query execution to begin, on the parent task’s worker thread. The query processor begins execution by starting the query scan process via a call to CQueryScan::StartupQuery. A reminder of the plan (click to enlarge):
This is the first point in the process so far that an in-flight execution plan is available (SQL Server 2016 SP1 onward) in sys.dm_exec_query_statistics_xml. There is nothing particularly interesting to see in such a plan at this point, because all the transient counters are zero, but the plan is at least available. There is no hint that parallel tasks have not been created yet, or that the exchanges lack a producer side. The plan looks ‘normal’ in all respects.
Parallel Plan Branches
Since this is a parallel plan, it will be useful to show it broken up into branches. These are shaded below, and labelled as branches A to D:
Branch A is associated with the parent task, running on the worker thread provided by the session. Additional parallel workers will be started to run the additional parallel tasks contained in branches B, C, and D. Those branches are parallel, so there will be DOP additional tasks and workers in each one.
Our example query is running at DOP 2, so branch B will get two additional tasks. The same goes for branch C and branch D, giving a total of six additional tasks. Each task will run on its own worker thread in its own execution context.
Two schedulers (S1 and S2) are assigned to this query to run additional parallel workers. Each additional worker will run on one of those two schedulers. The parent worker may run on a different scheduler, so our DOP 2 query may use a maximum of three processor cores at any one moment in time.
To summarize, our plan will eventually have:
- Branch A (parent)
- Parent task.
- Parent worker thread.
- Execution context zero.
- Any single scheduler available to the query.
- Branch B (additional)
- Two additional tasks.
- An additional worker thread bound to each new task.
- Two new execution contexts, one for each new task.
- One worker thread runs on scheduler S1. The other runs on scheduler S2.
- Branch C (additional)
- Two additional tasks.
- An additional worker thread bound to each new task.
- Two new execution contexts, one for each new task.
- One worker thread runs on scheduler S1. The other runs on scheduler S2.
- Branch D (additional)
- Two additional tasks.
- An additional worker thread bound to each new task.
- Two new execution contexts, one for each new task.
- One worker thread runs on scheduler S1. The other runs on scheduler S2.
The question is how all these extra tasks, workers, and execution contexts are created, and when they start running.
Starting Sequence
The sequence in which additional tasks start executing for this particular plan is:
- Branch A (parent task).
- Branch C (additional parallel tasks).
- Branch D (additional parallel tasks).
- Branch B (additional parallel tasks).
That may not be the start-up order you were expecting.
There may be a significant delay between each of these steps, for reasons we will explore shortly. The key point at this stage is that the additional tasks, workers, and execution contexts are not all created at once, and they do not all start executing at the same time.
SQL Server could have been designed to start all the extra parallel bits all at once. That might be easy to comprehend, but it wouldn’t be very efficient in general. It would maximize the number of additional threads and other resources used by the query, and result in a great deal of unnecessary parallel waits.
With the design employed by SQL Server, parallel plans will often use fewer total worker threads than (DOP multiplied by the total number of branches). This is achieved by recognizing that some branches can run to completion before some other branch needs to start. This can allow reuse of threads within the same query, and generally reduces resource consumption overall.
Let’s now turn to the details of how our parallel plan starts up.
Opening Branch A
The query scan starts executing with the parent task calling Open() on the iterator at the root of the tree. This is the start of the execution sequence:
- Branch A (parent task).
- Branch C (additional parallel tasks).
- Branch D (additional parallel tasks).
- Branch B (additional parallel tasks).
We are executing this query with an ‘actual’ plan requested, so the root iterator is not the sequence project operator at node 0. Rather, it is the invisible profiling iterator that records runtime metrics in row mode plans.
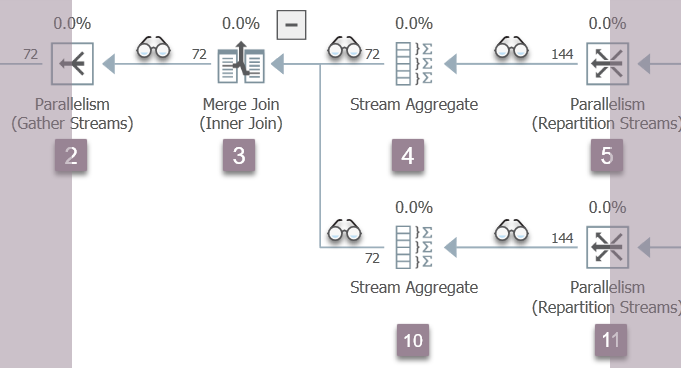
The illustration below shows the query scan iterators in Branch A of the plan, with the position of invisible profiling iterators represented by the ‘spectacles’ icons.
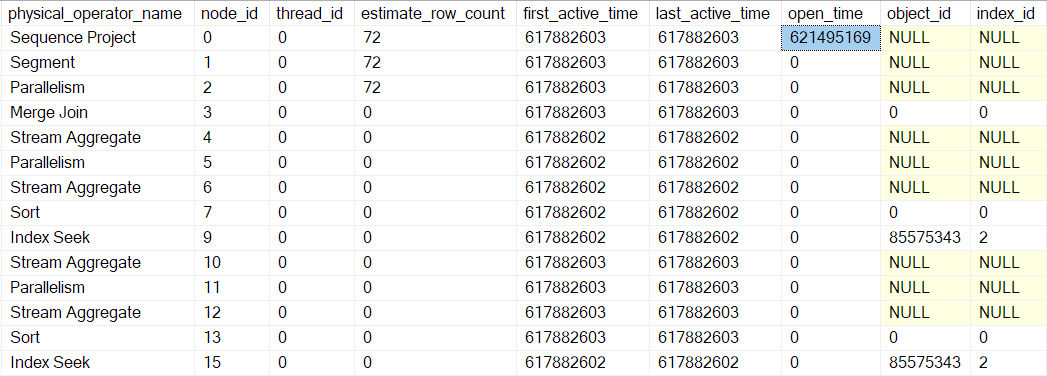
Execution starts with a call to open the first profiler, CQScanProfileNew::Open. This sets the open time for the child sequence project operator via the operating system’s Query Performance Counter API.
We can see this number in sys.dm_exec_query_profiles:
The entries there may have the operator names listed, but the data comes from the profiler above the operator, not the operator itself.
As it happens, a sequence project (CQScanSeqProjectNew) does not need to do any work when opened, so it does not actually have an Open() method. The profiler above the sequence project is called, so an open time for the sequence project is recorded in the DMV.
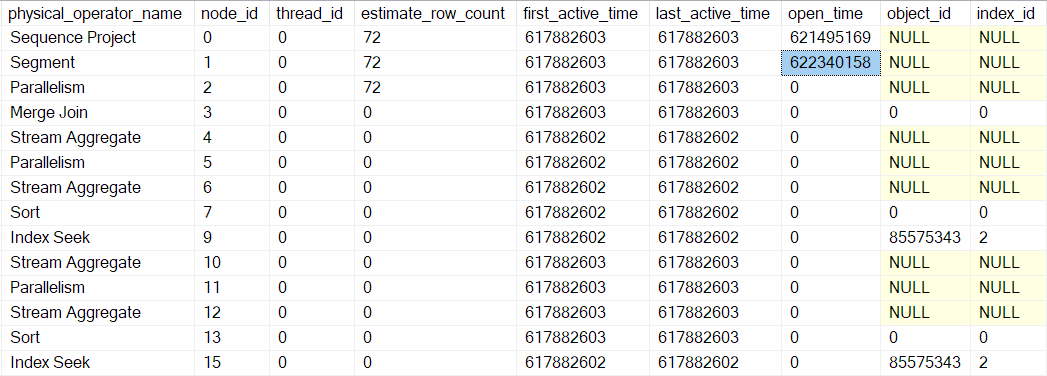
The profiler’s Open method does not call Open on the sequence project (since it doesn’t have one). Instead it calls Open on the profiler for the next iterator in sequence. This is the segment iterator at node 1. That sets the open time for the segment, just as the prior profiler did for the sequence project:
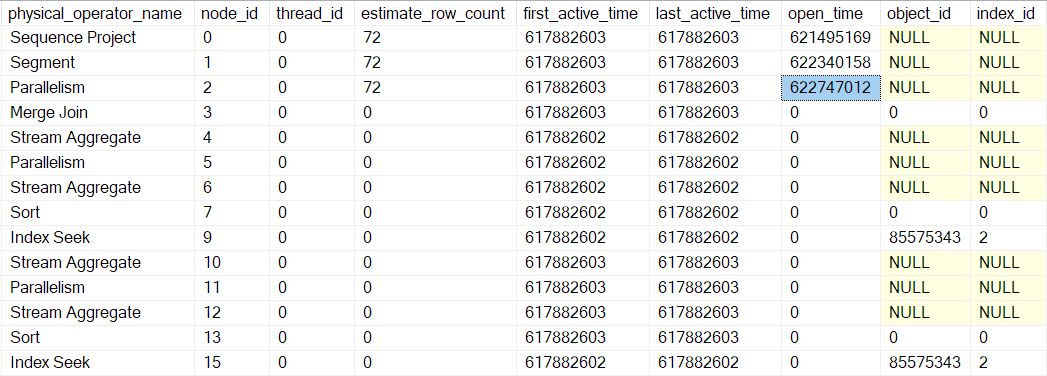
A segment iterator does have things to do when opened, so the next call is to CQScanSegmentNew::Open. Once the segment has done what it needs to, it calls the profiler for the next iterator in sequence — the consumer side of the gather streams exchange at node 2:
The next call down the query scan tree in the opening process is CQScanExchangeNew::Open, which is where things start to get more interesting.
Opening the gather streams exchange
Asking the consumer side of the exchange to open:
- Opens a local (parallel nested) transaction (
CXTransLocal::Open). Every process needs a containing transaction, and additional parallel tasks are no exception. They can’t share the parent (base) transaction directly, so nested transactions are used. When a parallel task needs to access the base transaction, it synchronizes on a latch, and may encounterNESTING_TRANSACTION_READONLYorNESTING_TRANSACTION_FULLwaits. - Registers the current worker thread with the exchange port (
CXPort::Register). - Synchronizes with other threads on the consumer side of the exchange (
sqlmin!CXTransLocal::Synchronize). There are no other threads on the consumer side of a gather streams, so this is essentially a no-op on this occasion.
“Early Phases” Processing
The parent task has now reached the edge of Branch A. The next step is particular to row mode parallel plans: The parent task continues execution by calling CQScanExchangeNew::EarlyPhases on the gather streams exchange iterator at node 2. This is an additional iterator method beyond the usual Open, GetRow, and Close methods that many of you will be familiar with. EarlyPhases is only called in row mode parallel plans.
I want to be clear about something at this point: The producer side of the gather streams exchange at node 2 has not been created yet, and no additional parallel tasks have been created. We are still executing code for the parent task, using the only thread running right now.
Not all iterators implement EarlyPhases, because not all of them have anything special to do at this point in row mode parallel plans. This is analogous to the sequence project not implementing the Open method because it has nothing to do at that time. The main iterators with EarlyPhases methods are:
CQScanConcatNew(concatenation).CQScanMergeJoinNew(merge join).CQScanSwitchNew(switch).CQScanExchangeNew(parallelism).CQScanNew(rowset access e.g. scans and seeks).CQScanProfileNew(invisible profilers).CQScanLightProfileNew(invisible lightweight profilers).
Branch B early phases
The parent task continues by calling EarlyPhases on child operators beyond the gather streams exchange at node 2. A task moving over a branch boundary might seem unusual, but remember execution context zero contains the whole serial plan, with exchanges included. Early phase processing is about initializing parallelism, so it doesn’t count as execution per se.
To help you keep track, the picture below shows the iterators in the Branch B of the plan:
Remember, we are still in execution context zero, so I am only referring to this as Branch B for convenience. We have not started any parallel execution yet.
The sequence of early phase code invocations in Branch B is:
CQScanProfileNew::EarlyPhasesfor the profiler above node 3.CQScanMergeJoinNew::EarlyPhasesat the node 3 merge join.CQScanProfileNew::EarlyPhasesfor the profiler above node 4. The node 4 stream aggregate itself does not have an early phases method.CQScanProfileNew::EarlyPhaseson the profiler above node 5.CQScanExchangeNew::EarlyPhasesfor the repartition streams exchange at node 5.
Notice we are only processing the outer (upper) input to the merge join at this stage. This is just the normal row mode execution iterative sequence. It is not particular to parallel plans.
Branch C early phases
Early phase processing continues with the iterators in Branch C:
The sequence of calls here is:
CQScanProfileNew::EarlyPhasesfor the profiler above node 6.CQScanProfileNew::EarlyPhasesfor the profiler above node 7.CQScanProfileNew::EarlyPhaseson the profiler above node 9.CQScanNew::EarlyPhasesfor the index seek at node 9.
There is no EarlyPhases method on the stream aggregate or sort. The work performed by compute scalar at node 8 is deferred (to the sort), so it does not appear in the query scan tree, and does not have an associated profiler.
About profiler timings
Parent task early phase processing began at the gather streams exchange at node 2. It descended the query scan tree, following the outer (upper) input to the merge join, all the way down to the index seek at node 9. Along the way, the parent task has called the EarlyPhases method on every iterator that supports it.
None of the early phases activity has so far updated any times in the profiling DMV. Specifically, none of the iterators touched by early phases processing have had their ‘open time’ set. This makes sense, because early phase processing is just setting up parallel execution — these operators will be opened for execution later on.
The index seek at node 9 is a leaf node – it has no children. The parent task now begins returning from the nested EarlyPhases calls, ascending the query scan tree back towards the gather streams exchange.
Each of the profilers calls the Query Performance Counter API on entry to their EarlyPhases method, and they call it again on the way out. The difference between the two numbers represents elapsed time for the iterator and all its children (since the method calls are nested).
After the profiler for the index seek returns, the profiler DMV shows elapsed and CPU time for the index seek only, as well as an updated last active time. Notice also that this information is recorded against the parent task (the only option right now):
None of the prior iterators touched by the early phases calls have elapsed times, or updated last active times. These numbers are only updated when we ascend the tree.
After the next profiler early phases call return, the sort times are updated:
The next return takes us up past the profiler for the stream aggregate at node 6:
Returning from this profiler takes us back to the EarlyPhases call at the repartition streams exchange at node 5. Remember that this is not where the sequence of early phases calls started — that was the gather streams exchange at node 2.
Branch C Parallel Tasks Enqueued
Aside from updating profiling data, the prior early phases calls didn’t seem to do very much. That all changes with the repartition streams exchange at node 5.
I am going to describe Branch C in a fair amount of detail to introduce a number of important concepts, which will apply to the other parallel branches as well. Covering this ground once now means later branch discussion can be more succinct.
Having completed nested early phase processing for its subtree (down to the index seek at node 9), the exchange can begin its own early phase work. This starts out the same as opening the gather streams exchange at node 2:
CXTransLocal::Open(opening the local parallel sub-transaction).CXPort::Register(registering with the exchange port).
The next steps are different because branch C contains a fully blocking iterator (the sort at node 7). The early phase processing at the node 5 repartition streams does the following:
- Calls
CQScanExchangeNew::StartAllProducers. This is the first time we have encountered anything referencing the producer side of the exchange. Node 5 is the first exchange in this plan to create its producer side. - Acquires a mutex so no other thread can be enqueueing tasks at the same time.
- Starts parallel nested transactions for the producer tasks (
CXPort::StartNestedTransactionsandReadOnlyXactImp::BeginParallelNestedXact). - Registers the sub-transactions with the parent query scan object (
CQueryScan::AddSubXact). - Creates producer descriptors (
CQScanExchangeNew::PxproddescCreate). - Creates new producer execution contexts (
CExecContext) derived from execution context zero. - Updates the linked map of plan iterators.
- Sets DOP for the new context (
CQueryExecContext::SetDop) so all tasks know what the overall DOP setting is. - Initializes the parameter cache (
CQueryExecContext::InitParamCache). - Links the parallel nested transactions to the base transaction (
CExecContext::SetBaseXact). - Queues the new sub-processes for execution (
SubprocessMgr::EnqueueMultipleSubprocesses). - Creates new parallel tasks tasks via
sqldk!SOS_Node::EnqueueMultipleTasksDirect.
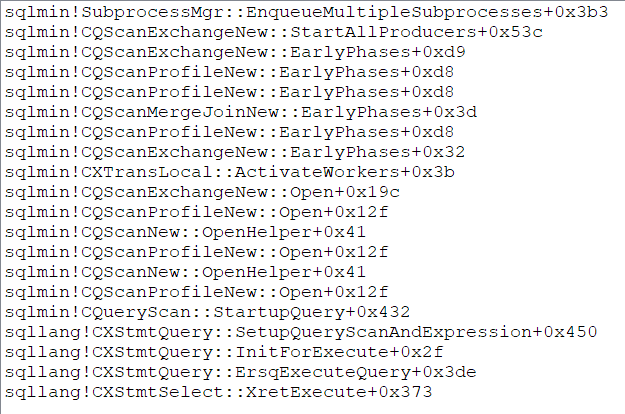
The parent task’s call stack (for those of you that enjoy these things) around this point in time is:
End of Part Three
We have now created the producer side of the repartition streams exchange at node 5, created additional parallel tasks to run Branch C, and linked everything back to parent structures as required. Branch C is the first branch to start any parallel tasks. The final part of this series will look at branch C opening in detail, and start the remaining parallel tasks.


