SQL Server has always provided the ability to capture live queries on an ad hoc basis in an easily-consumable rowset format – first with legacy SQL Server Profiler, later via Extended Events in SSMS. This capability is valuable when performance tuning since query events include discrete CPU and IO metrics as well as runtime parameters, which are key for troubleshooting query performance problems such as parameter sniffing. Further, query events contain other important elements such as the client hostname, application name, login, Windows process ID, etc.
You can always retrieve aggregated performance metrics for normalized queries from DMVs or Query Store, but they contain only compiled parameters and none of the aforementioned elements. Although this is helpful, it is not the same. For example, if you need to see the specific parameter combination used by that query that did 2 billion reads or find the top CPU-consuming application over the past 24 hours, you are out of luck.
Azure SQL Database is not supported by legacy Profiler, and Microsoft disabled the XEvents streaming provider (sys.fn_MSxe_read_event_stream TVF) for reliability reasons, so you can’t spin up an XE session and "watch live data" with SSMS. Query Performance Insights in the Azure Portal is backed by Query Store, so you again have only the normalized queries and aggregated performance data, not the actual query events.
So, for a few years we were stuck – the only option for profiling Azure SQL Database was to manually create an XEvents trace that writes to a ring buffer or file target with Azure Storage, neither of which are optimal. Using the ring buffer with T-SQL queries can be problematic due to the 4MB formatted XML limit as covered by Jonathan Kehayias here, and file targets require a fair amount of hoop-jumping and additional expense. Both require manual querying of the XE data and so aren't exactly "live" in the traditional sense.
Enter the New SQL Server Profiler
When I learned of the SQL Server Profiler extension for Azure Data Studio I was pleased to see Microsoft finally deliver a graphical solution for live query capture on Azure SQL Database. Unfortunately, my excitement was short lived for a couple of reasons.
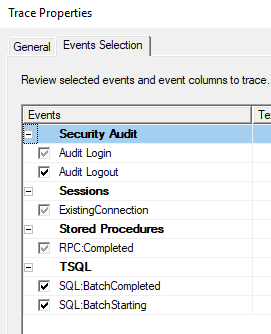
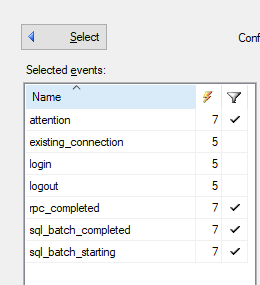
First, the dreaded “Standard” trace from legacy Profiler has apparently been used as the model for the ADS Profiler XE session for Azure SQL Database, named ADS_Standard_Azure by default. (The XE sessions used for full SQL Server are similar.) As I blogged several years ago and still believe, the Standard trace is a primary reason legacy Profiler is so poorly regarded. It contains multiple useless and unfilterable events such as SQL batch starting, login and logout, and as a result it adds no real value for performance tuning. Further, with the synchronous rowset trace architecture used by legacy Profiler, the high event volume can impact performance on busy systems. For some reason this thing will not go away!
|
|
|
|
Legacy Profiler “Standard” trace events |
ADS Profiler “ADS_Standard_Azure” XE events |
Second, it uses a ring buffer with a max size of 8MB or 1000 events, whichever comes first. Because the login/logout events are small, you will often hit 1000 events long before you reach the 8MB limit, or even the 4MB formatted XML limit. However, with a moderate mix of SQL events the ring buffer XML will still be 2 to 3MB at 1000 events in my testing, and the problem is that this entire buffer is pulled across the network every time the Profiler extension polls to refresh its grid, which is the longer of every 1 second or duration of the previous poll. The XML is then parsed client-side by the ADS Profiler extension to determine which events are new since the last poll, and the new events are added to the grid.
The ring buffer fills up almost instantly on even a moderately busy server, and the net effect is that you will quickly be pulling >40 megabits per second across the network from your Azure SQL Database. This translates to 300 megabytes per minute, or 18 gigabytes per hour!
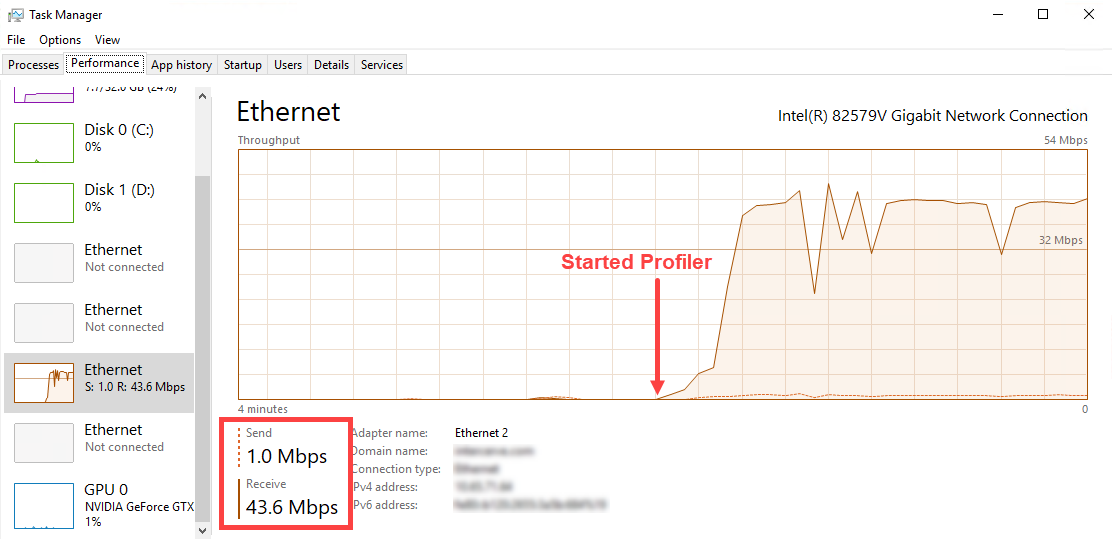
Network hit from the ADS Profiler extension (4-minute range)
My initial fear was that this could lead to huge egress charges on the next Azure bill, however, looking at our own Azure subscriptions we were unable to confirm that network traffic for Azure SQL DB is charged. SentryOne’s Mike Wood (b|t), an Azure MVP, spent weeks trying to find the answer and finally got word from Microsoft that indeed network egress is currently not charged for Azure SQL DB, although this could change at any time. Even so, pulling down 18GB of query data per hour doesn’t seem responsible, and could certainly put a damper on your next Netflix binge-watching session.
Although you can set filters through the Profiler UI which will make the data easier to review, it will not reduce the network hit since they operate client-side.
An Updated XE Session
A quick solution to reduce the network burden of ADS Profiler and make the data much more consumable for query performance tuning is to update the ADS_Standard_Azure XE session. Below is a script that will:
-
Delete the useless events:
- sqlserver.attention
- sqlserver.existing_connection
- sqlserver.login
- sqlserver.logout
- sqlserver.sql_batch_starting
-
Set a threshold of duration > 1 second (1000000 microseconds) on the remaining events:
- sqlserver.rpc_completed
- sqlserver.sql_batch_completed
-
Reduce the ring buffer max size from 1000 to 10 events
- This would never work with the original trace since 10 events will be generated in milliseconds and the ring buffer would recyle too quickly causing most events to be lost. However, with the 1-second duration filter the event flow will be much lower, and 10 events should work well with the 1-second polling interval used by the ADS Profiler.
ALTER EVENT SESSION [ADS_Standard_Azure] ON DATABASE
DROP EVENT sqlserver.attention,
DROP EVENT sqlserver.existing_connection,
DROP EVENT sqlserver.login,
DROP EVENT sqlserver.logout,
DROP EVENT sqlserver.rpc_completed,
DROP EVENT sqlserver.sql_batch_completed,
DROP EVENT sqlserver.sql_batch_starting
GO

ALTER EVENT SESSION [ADS_Standard_Azure] ON DATABASE
ADD EVENT sqlserver.rpc_completed(
ACTION(package0.event_sequence,sqlserver.client_app_name,sqlserver.client_pid,sqlserver.database_id,sqlserver.query_hash,sqlserver.session_id,sqlserver.username)
      WHERE (([package0].[equal_boolean]([sqlserver].[is_system],(0))) AND ([duration] >= (1000000)))),
ADD EVENT sqlserver.sql_batch_completed(
ACTION(package0.event_sequence,sqlserver.client_app_name,sqlserver.client_pid,sqlserver.database_id,sqlserver.query_hash,sqlserver.session_id,sqlserver.username)
      WHERE (([package0].[equal_boolean]([sqlserver].[is_system],(0))) AND ([duration] >= (1000000))))
GO

ALTER EVENT SESSION [ADS_Standard_Azure] ON DATABASE
DROP TARGET package0.ring_buffer
GO

ALTER EVENT SESSION [ADS_Standard_Azure] ON DATABASE
ADD TARGET package0.ring_buffer(SET max_events_limit=(10),max_memory=(51200))
GO
After applying the script to update the XE session, the firehose will be immediately reduced to a trickle:
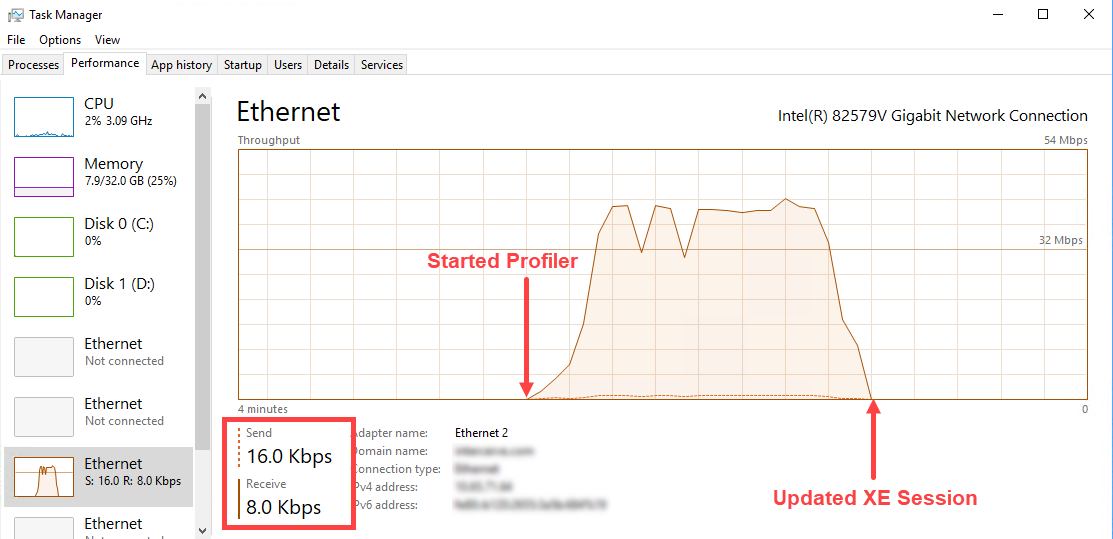
Reduced network hit after updating the ADS Profiler XE session
Even Lighter Weight Alternatives
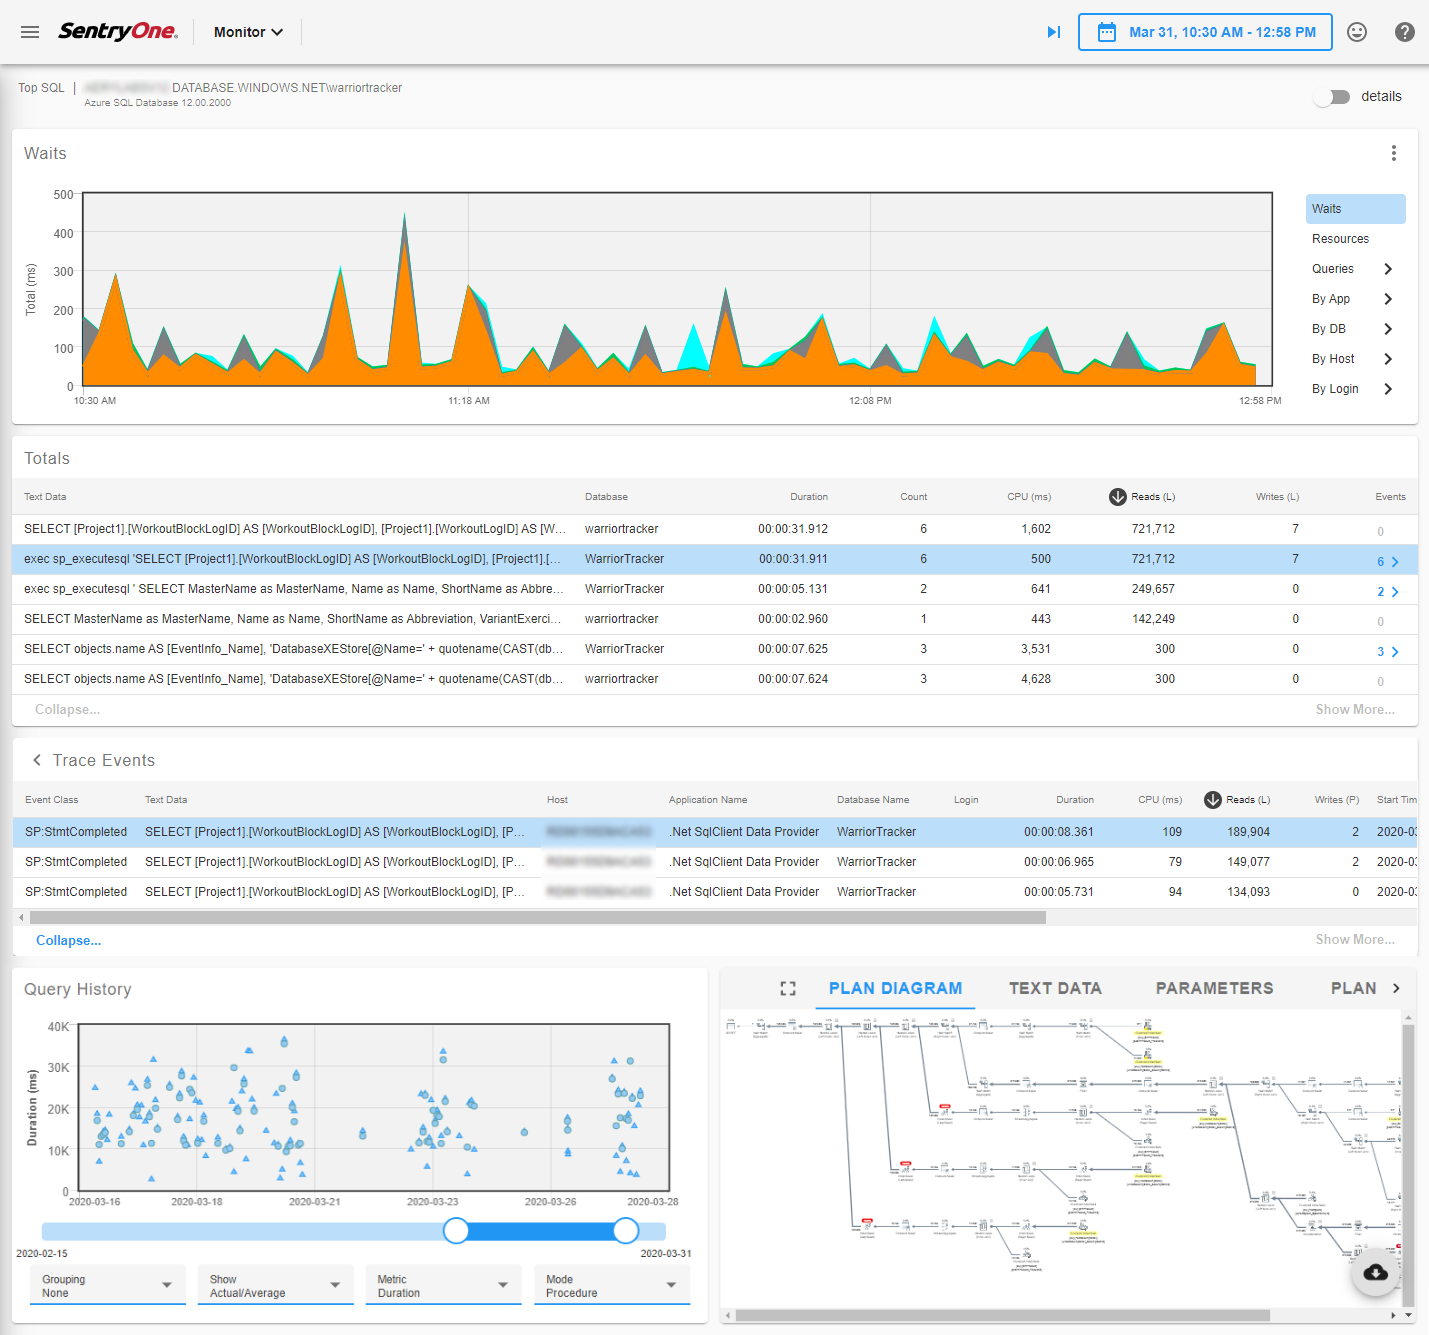
SQL Sentry and its SaaS counterpart SentryOne Monitor are the only other solutions I know of for capturing queries from Azure SQL Database, and they do so using an innovative approach that is considerably lighter weight than the above optimized XE session for ADS Profiler. Among other advanced features, you can easily aggregate by client hostname, application and login, and automatically capture query plans for analysis with the integrated Plan Explorer.
SentryOne Monitor showing captured queries and plans from Azure SQL Database
Closing
Microsoft has stated that they will continue to enhance the ADS Profiler extension, and when they do, I hope that they will address the issues outlined above. I have logged the issue here. In the meantime, the updated script will make for a safer and more bandwidth-friendly query profiling experience for Azure SQL Database.


