I have had a lot of conversations recently about types of workloads – specifically understanding whether a workload is parameterized, adhoc, or a mixture. It’s one of the things we look at during a health audit, and Kimberly has a great query from her Plan cache and optimizing for adhoc workloads post that’s part of our toolkit. I’ve copied the query below, and if you’ve never run it against any of your production environments before, definitely find some time to do so.
SELECT objtype AS [CacheType],
  COUNT_BIG(*) AS [Total Plans],
  SUM(CAST(size_in_bytes AS DECIMAL(18, 2))) / 1024 / 1024 AS [Total MBs],
  AVG(usecounts) AS [Avg Use Count],
  SUM(CAST((CASE WHEN usecounts = 1 THEN size_in_bytes
    ELSE 0
    END) AS DECIMAL(18, 2))) / 1024 / 1024 AS [Total MBs – USE Count 1],
  SUM(CASE WHEN usecounts = 1 THEN 1
    ELSE 0
    END) AS [Total Plans – USE Count 1]
FROM sys.dm_exec_cached_plans
GROUP BY objtype
ORDER BY [Total MBs – USE Count 1] DESC;
If I run this query against a production environment, we might get output like the following:

From this screenshot you can see that we have about 3GB total dedicated to the plan cache, and of that 1.7GB is for the plans of over 158,000 adhoc queries. Of that 1.7GB, approximately 500MB is used for 125,000 plans that execute ONE time only. About 1GB of the plan cache is for prepared and procedure plans, and they only take up about 300MB worth of space. But note the average use count – well over 1 million for procedures. In looking at this output, I would categorize this workload as mixed – some parameterized queries, some adhoc.
Kimberly’s blog post discusses options for managing a plan cache filled with a lot of adhoc queries. Plan cache bloat is just one problem you have to contend with when you have an adhoc workload, and in this post I want to explore the effect it can have on CPU as a result of all the compilations that have to occur. When a query executes in SQL Server, it goes through compilation and optimization, and there is overhead associated with this process, which frequently manifests as CPU cost. Once a query plan is in cache, it can be re-used. Queries that are parameterized can end up re-using a plan that’s already in cache, because the query text is exactly the same. When an adhoc query executes it will only re-use the plan in cache if it has the exact same text and input value(s).
Setup
For our testing we will generate a random string in TSQL and concatenate it to a query so that every execution has a different literal value. I’ve wrapped this in a stored procedure that calls the query using Dynamic String Execution (EXEC @QueryString), so it behaves like an adhoc statement. Calling it from within a stored procedure means that we can execute it a known number of times.
USE [WideWorldImporters];
GO

DROP PROCEDURE IF EXISTS dbo.[RandomSelects];
GO

CREATE PROCEDURE dbo.[RandomSelects]
  @NumRows INT
AS
  DECLARE @ConcatString NVARCHAR(200);
  DECLARE @QueryString NVARCHAR(1000);
  DECLARE @RowLoop INT = 0;
  WHILE (@RowLoop < @NumRows)
  BEGIN
    SET @ConcatString = CAST((CONVERT (INT, RAND () * 2500) + 1) AS NVARCHAR(50))
      + CAST((CONVERT (INT, RAND () * 1000) + 1) AS NVARCHAR(50))
      + CAST((CONVERT (INT, RAND () * 500) + 1) AS NVARCHAR(50))
      + CAST((CONVERT (INT, RAND () * 1500) + 1) AS NVARCHAR(50));

    SELECT @QueryString = N'SELECT w.ColorID, s.StockItemName
      FROM Warehouse.Colors w
      JOIN Warehouse.StockItems s
      	ON w.ColorID = s.ColorID
      WHERE w.ColorName = ''' + @ConcatString + ''';';

    EXEC (@QueryString);
    SELECT @RowLoop = @RowLoop + 1;
  END
GO

DBCC FREEPROCCACHE;
GO

EXEC dbo.[RandomSelects] @NumRows = 10;
GO
After executing, if we check the plan cache, we can see that we have 10 unique entries, each with an execution_count of 1 (zoom in on the image if needed to see the unique values for the predicate):
SELECT
  [qs].[execution_count],
  [qs].[sql_handle],
  [qs].[query_hash],
  [qs].[query_plan_hash],
  [st].[text]
FROM sys.dm_exec_query_stats AS [qs]
CROSS APPLY sys.dm_exec_sql_text ([qs].[sql_handle]) AS [st]
CROSS APPLY sys.dm_exec_query_plan ([qs].[plan_handle]) AS [qp]
WHERE [st].[text] LIKE '%Warehouse%'
ORDER BY [st].[text], [qs].[execution_count] DESC;
GO
Now we create a nearly identical stored procedure that executes the same query, but parameterized:
USE [WideWorldImporters];
GO

DROP PROCEDURE IF EXISTS dbo.[SPRandomSelects];
GO

CREATE PROCEDURE dbo.[SPRandomSelects]
  @NumRows INT
AS
  DECLARE @ConcatString NVARCHAR(200);
  DECLARE @QueryString NVARCHAR(1000);
  DECLARE @RowLoop INT = 0;
  WHILE (@RowLoop < @NumRows)
  BEGIN
    SET @ConcatString = CAST((CONVERT (INT, RAND () * 2500) + 1) AS NVARCHAR(50))
      + CAST((CONVERT (INT, RAND () * 1000) + 1) AS NVARCHAR(50))
      + CAST((CONVERT (INT, RAND () * 500) + 1) AS NVARCHAR(50))
      + CAST((CONVERT (INT, RAND () * 1500) + 1) AS NVARCHAR(50))

    SELECT w.ColorID, s.StockItemName
      FROM Warehouse.Colors w
      JOIN Warehouse.StockItems s
        ON w.ColorID = s.ColorID
      WHERE w.ColorName = @ConcatString;

    SELECT @RowLoop = @RowLoop + 1;
  END
GO

EXEC dbo.[SPRandomSelects] @NumRows = 10;
GO
Within the plan cache, in addition to the 10 adhoc queries, we see one entry for the parameterized query that’s been executed 10 times. Because the input is parameterized, even if wildly different strings are passed into the parameter, the query text is exactly the same:
Testing
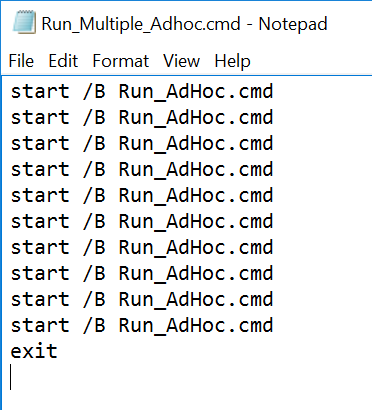
Now that we understand what happens in the plan cache, let’s create more load. We will use a command line file that calls the same .sql file on 10 different threads, with each file calling the stored procedure 10,000 times. We’ll clear the plan cache before we start, and capture Total CPU% and SQL Compilations/sec with PerfMon while the scripts execute.
Adhoc.sql file contents:
EXEC [WideWorldImporters].dbo.[RandomSelects] @NumRows = 10000;
Parameterized.sql file contents:
EXEC [WideWorldImporters].dbo.[SPRandomSelects] @NumRows = 10000;
Example command file (viewed in Notepad) that calls the .sql file:

Example command file (viewed in Notepad) that creates 10 threads, each calling the Run_Adhoc.cmd file:

After running each set of queries 100,000 times in total, if we look at the plan cache we see the following:

There are more than 10,000 adhoc plans in the plan cache. You might wonder why there isn’t a plan for all 100,000 adhoc queries that executed, and it has to do with how the plan cache works (it’s size based on available memory, when un-used plans are aged out, etc.). What’s critical is that so many adhoc plans exist, compared to what we see for the rest of the cache types.
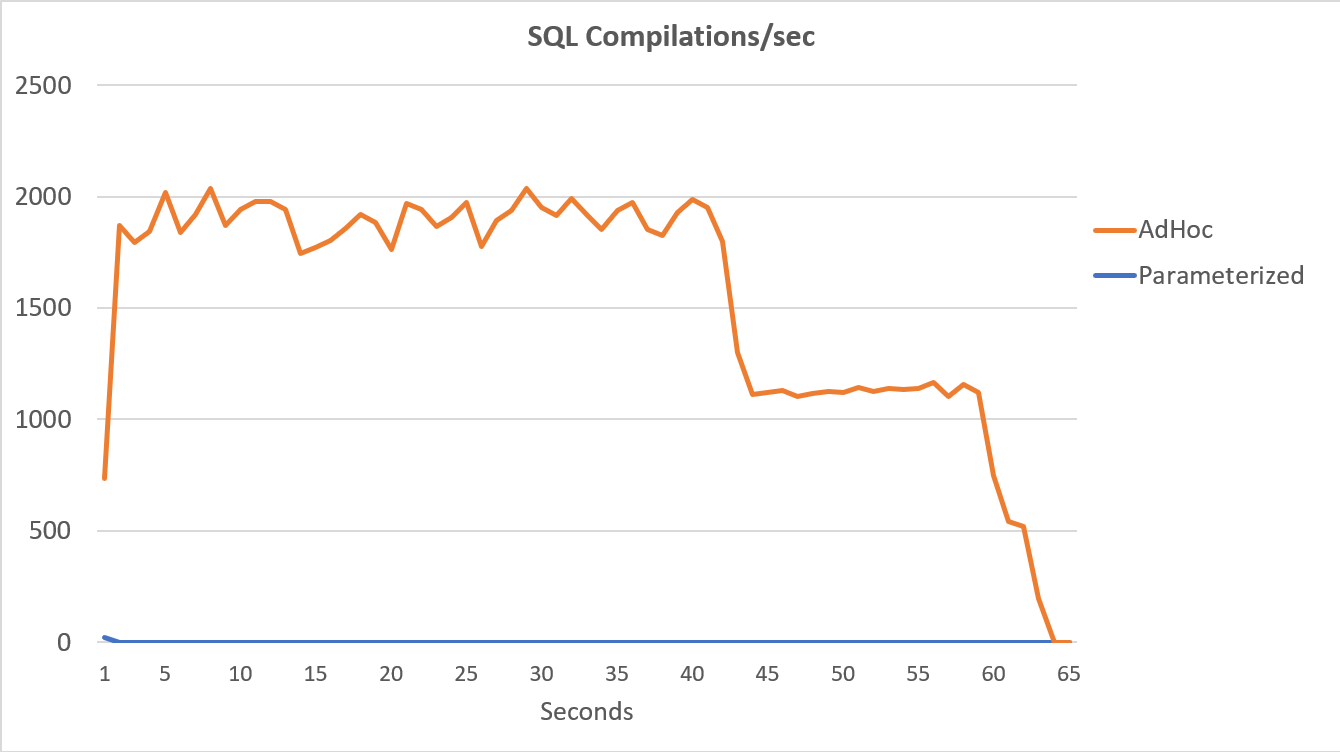
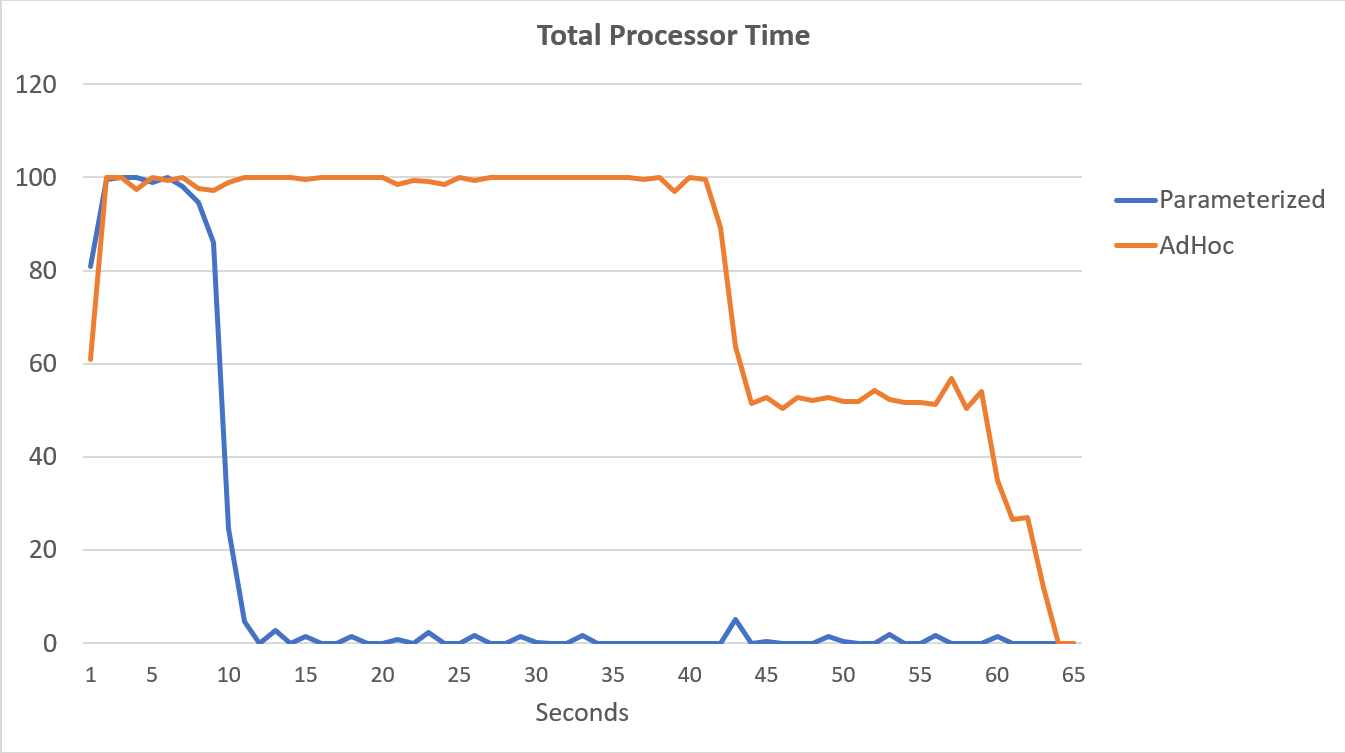
The PerfMon data, graphed below, is most telling. The execution of the 100,000 parameterized queries completed in less than 15 seconds, and there was a tiny spike in Compilations/sec at the beginning, which is barely noticeable on the graph. The same number adhoc executions took just over 60 seconds to complete, with Compilations/sec spiking near 2000 before dropping closer to 1000 around the 45 second mark, with CPU close to or at 100% for the majority of time.


Summary
Our test was extremely simple in that we only submitted variations for one adhoc query, whereas in a production environment, we could have hundreds or thousands of different variations for hundreds or thousands of different adhoc queries. The performance impact of these adhoc queries is not just the plan cache bloat that occurs, though look at the plan cache is a great place to start if you’re not familiar with type of workload you have. A high volume of adhoc queries can drive compilations and therefore CPU, which can sometimes be masked by adding more hardware, but there can absolutely come a point where CPU does become a bottleneck. If you think this might be a problem, or potential problem, in your environment, then look to identify which adhoc queries are running most frequently, and see what options you have for parameterizing them. Don’t get me wrong – there are potential issues with parameterized queries (e.g. plan stability due to data skew), and that’s another problem you may have to work through. Regardless of your workload, it’s important to understand that there is rarely a “set it and forget it” method for coding, configuration, maintenance, etc. SQL Server solutions are living, breathing entities that are always changing and take continual care and feeding to perform reliably. One of the tasks of a DBA is to stay on top of that change and manage performance as best as possible – whether it’s related to adhoc or parameterized performance challenges.


Great Post !!
Please let us know is there any hard capping on max memory used by Plan cache
Thank you
SQL Server Version: SQL Server 2008 and SQL Server 2005 SP2
Cache Pressure Limit: 75% of visible target memory from 0-4GB + 10% of visible target memory from 4Gb-64GB + 5% of visible target memory > 64GB
SQL Server Version: SQL Server 2005 RTM and SQL Server 2005 SP1
Cache Pressure Limit: 75% of visible target memory from 0-8GB + 50% of visible target memory from 8Gb-64GB + 25% of visible target memory > 64GB
SQL Server Version: SQL Server 2000
Cache Pressure Limit: SQL Server 2000 4GB upper cap on the plan cache
https://docs.microsoft.com/en-us/previous-versions/sql/sql-server-2008/ee343986(v=sql.100)
As always fantastic post Erin and oh yes the query is part of my daily health checks as a rule
Great post and enjoyed your sessions at SQLBits Manchester this year too
Keep on rolling these out
Thank you