Azure SQL Database is Microsoft’s database-as-a-service offering that offers a tremendous amount of flexibility and security and, as part of Microsoft’s Platform-as-a-Service, gets to take advantage of additional features. Since Azure SQL Database is database-scoped, there are some big differences when it comes to performance tuning.
Tuning the Instance
Many instance-level items that you have been used to configuring on full installations are off limits. Some of these items include:
- Setting min and max server memory
- Enabling optimize for ad hoc workloads
- Changing cost threshold for parallelism
- Changing instance-level max degree of parallelism
- Optimizing tempdb with multiple data files
- Trace flags
Don’t be too upset about some of these. The ALTER DATABASE SCOPED CONFIGURATION statement allows quite a few configuration settings at the individual database level. This was introduced with Azure SQL Database and in SQL Server beginning with SQL Server 2016. Some of these settings include:
- Clear procedure cache
- Setting the MAXDOP to a value other than zero
- Set the query optimizer cardinality estimation model
- Enable or disable query optimization hotfixes
- Enable or disable parameter sniffing
- Enable or disable the identity cache
- Enable or disable a compiled plan stub to be stored in cache when a batch is compiled for the first time.
- Enable or disable collection of execution statistics for natively compiled T-SQL modules.
- Enable or disable online by default options for DDL statements that support the ONLINE=ON/OFF syntax.
- Enable or disable resumable by default options for DDL statements that support the RESUMABLE=ON/OFF syntax.
- Enable or disable the auto-drop functionality of global temporary tables
As you can see from the list of scoped configurations, you have a lot of control and precision for fine-tuning specific behaviors for individual databases. For some customers, the limitations for instance-level control may have negative impact, while others will see it as a benefit.
For companies that have a database per customer, needing complete isolation, that is built into Azure SQL Database. For those who need the instance-level capabilities of SQL Server but would like to take advantage of Microsoft’s PaaS offering, there is Azure SQL Managed Instance, which is instance-scoped. The goal there is to have 100% surface area compatibility with SQL Server; so, you can set min and max server memory, enable optimize for adhoc workloads, and change both MAXDOP and cost threshold for parallelism. Tempdb on a Managed Instance already has multiple files, but you can add more, and increase the default size. In many ways, it truly feels like the full install of SQL Server.
Query Tuning
Another difference between Azure SQL Database and SQL Server is that Query Store is enabled by default in Azure SQL Database. You can turn Query Store off, but then you limit the Intelligent Performance tools in the Azure Portal that use it. Query Store is a feature that provides insight into query performance and plan choice. Query Store also captures a history of queries, plans, and runtime statistics so that you can review what is going on. Do you want to know which query has the highest recompile time, execution time, execution count, CPU usage, memory usage, the most physical reads/writes, and more? Query Store has that information. For SQL Server, you must enable this feature per database. If you are new to Query Store, my colleague Erin Stellato has a three hour course on Pluralsight that will help you get started.
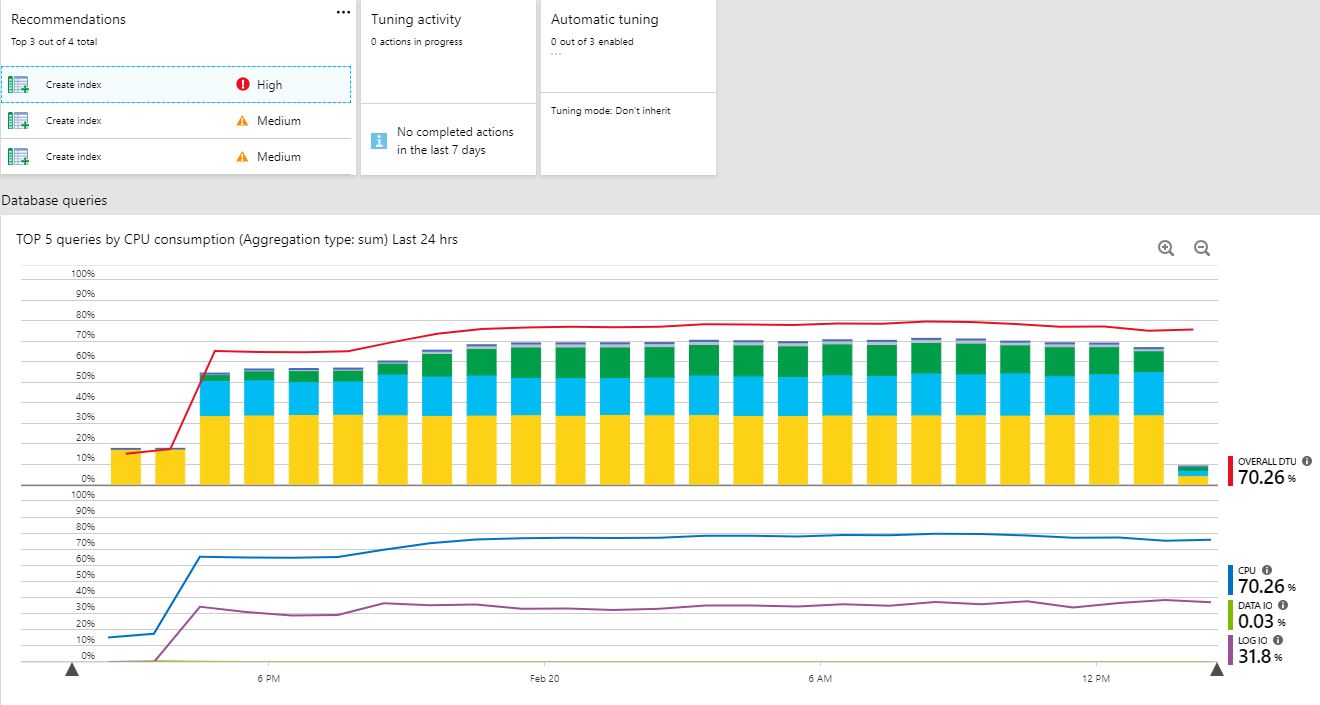
The Intelligent Performance tools category has four features. Firstly, performance overview provides a summary of your overall database performance by listing the top 5 queries by CPU consumption, any recommendations from automatic tuning, tuning activity, and current automatic tuning settings. This landing page to gives you a quick glimpse into your performance.
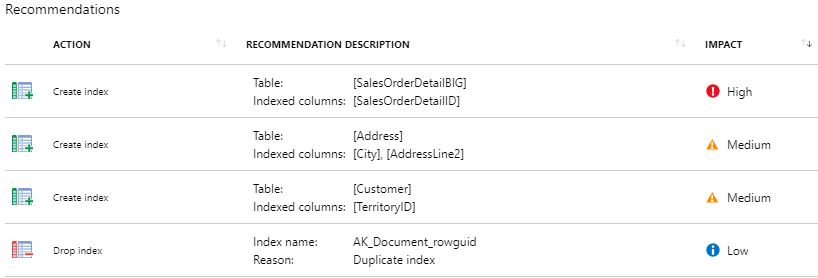
Secondly, the performance recommendations option will list out any current recommendations for index creations or if any indexes should be dropped. If any recent actions have been completed, you’ll also see the history.
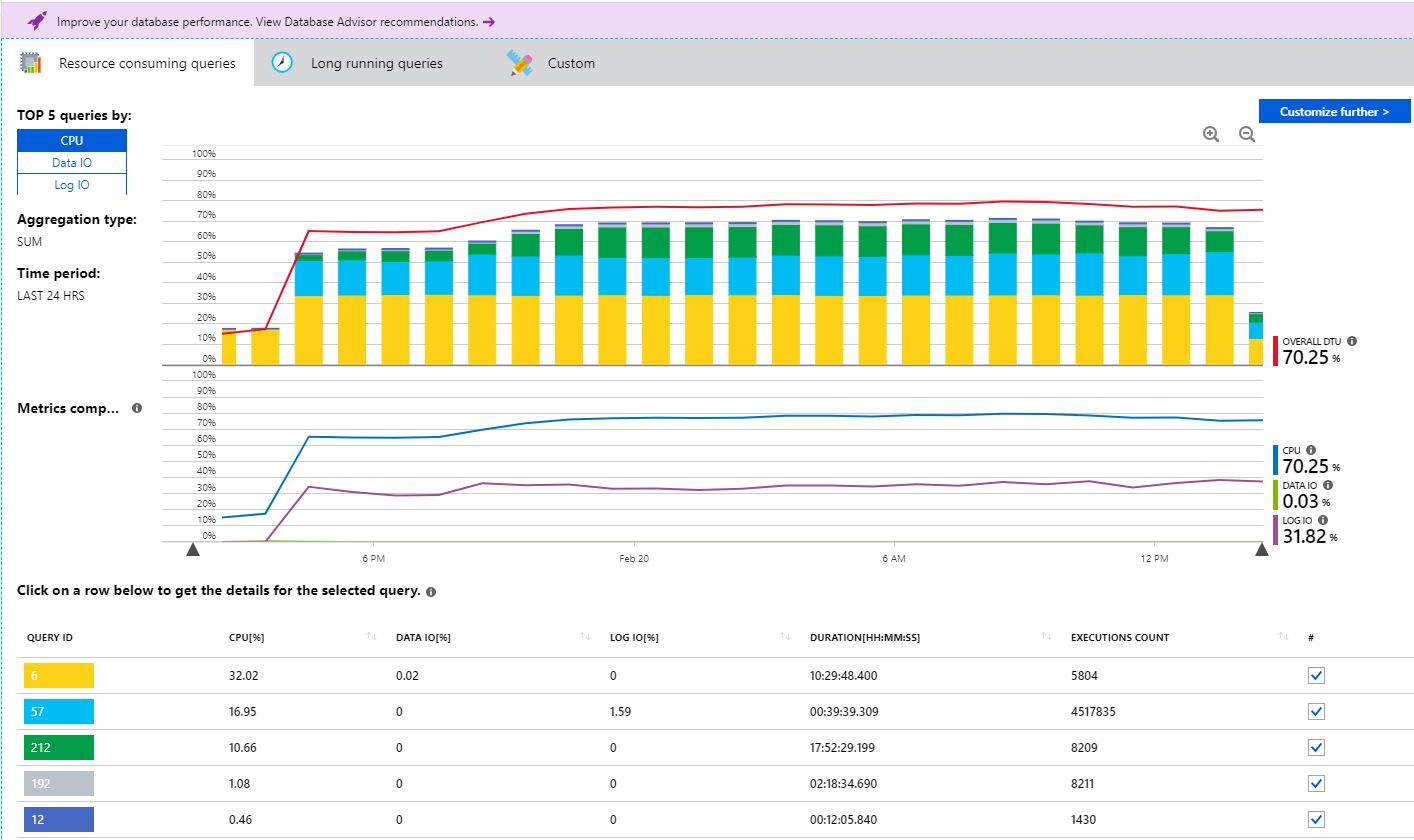
Thirdly, Query Performance Insight is where you can find a deeper insight into your resource consumption by viewing the top 5 queries by CPU, Data I/O, or Log I/O. The top 5 queries are color-coded so you can quickly see the percentage of overall consumption visually. You can click on the query-id to get more details including the SQL text. There is also a long running queries tab. I really like that Microsoft has included a feature like this in the Azure Portal at no cost. It provides value by giving customers a portal to see the top offending queries. What I find challenging here is having a way to see an overall baseline for comparison of day to day, week to week, and previous month. However, for a quick analysis and overview, Query Performance Insight is helpful.
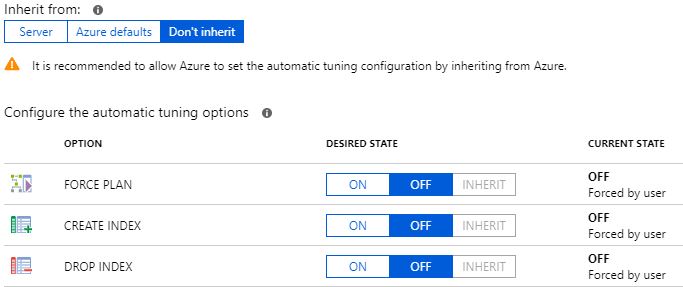
The final feature in this category is automatic tuning. This is where you can configure the force plan, create index, and drop index settings. You can force it on, off, or choose to inherit from the server. Force plan allows Azure to pick what it feels would be the better of the execution plans for regressed queries. This feature also exists in SQL Server 2017 Enterprise Edition as automatic plan correction. Some DBAs get nervous when they hear about the automatic tuning features, as they fear it may replace the need for DBAs in the future. I always like to ask the question, “How much time each day do you spend proactively tuning queries?”. The overwhelming response is that people can actually spend very little time proactively tuning, and most respond that the only time they really ‘tune’ is after a code release or when users start complaining.
In addition to the built-in tools and having the value of using Query Store, DMVs are also readily available. Glenn Berry has an entire collection of scripts just for Azure SQL Database that you can utilize. One particular DMV I want to call out is sys.dm_os_wait_stats. This will pull from the server level, so if you really want to look at wait stats for the database level, you’ll need to use sys.dm_db_wait_stats instead.
Hardware – Scaling
Another area of consideration when looking at performance with Azure SQL Database is the underlying hardware. Azure SQL Database is priced by Database Transaction Units (DTUs) and vCores. DTUs are a blended measure of CPU, memory, and I/O, and come in three tiers; Basic, Standard, and Premium. Basic is only 5 DTUs, Standard ranges from 10-3,000 DTUs, and Premium ranges from 125-4,000 DTUs. For the vCore-based tiers we have General Purpose and Business Critical ranging from 1-80 vCores.
In the DTU model, Basic should be considered for development and testing. It only has a 7 day backup retention so I wouldn’t consider it viable for any production data. Standard is good for low, medium, and high CPU demand with moderate to low I/O demand. The Basic and Standard tier offers 2.5 IOPS per DTU with 5ms (read), 10ms (write). The Premium tier is for medium to high CPU demand and high I/O offering 48 IOPS per DTU with 2ms (read/write). The Premium tier has storage that is orders of magnitude faster that standard. In the vCore model, you have Gen4 processors that offer 7GB of RAM per physical core and Gen 5 processors that offer 5.1GB of RAM per logical core. From an I/O perspective General Purpose offers 500 IOPS per vCore with a 7,000 max. Business Critical offers 5,000 IOPS per core with a 200,000 max.
Summary
Azure SQL Database is great for those systems that need database isolation while Azure SQL Managed Instance is great for those environments where you need instance-level compatibility (cross database query support). When you need to tune Azure SQL Database, you must do things at the database level as instance-level options are off limits, so database scoped configuration settings are your fine-tuning options. With troubleshooting poor performing queries, you have some built-in tools that help, including Query Store, and most of your regular tuning scripts will work. You may find you still need more, such as baselines, more historical data, and the ability to create advisory conditions to help you manage your workloads. This is where powerful monitoring solutions like SentryOne DB Sentry can help.
When all else fails, or your workload has just simply increased past your current hardware resources, scale to a higher tier.


