
Using Track Causality to Understand Query Execution
When deeply involved in troubleshooting an issue in SQL Server, sometimes you find yourself wanting to know the exact order in which queries ran. I see this with more complicated stored procedures that contain layers of logic, or in scenarios where there’s a lot of redundant code. Extended Events is a natural choice here, as it’s typically used to capture information about query execution. You can often use session_id and the timestamp to understand the order of events, but there’s a session option for XE that’s even more reliable: Track Causality.
When you enable Track Causality for a session, it adds a GUID and sequence number to every event, which you can then use to step through the order in which events occurred. The overhead is minimal, and it can be a significant time-saver in many troubleshooting scenarios.
Set Up
Using the WideWorldImporters database we’ll create a stored procedure to use:
DROP PROCEDURE IF EXISTS [Sales].[usp_CustomerTransactionInfo];
GO

CREATE PROCEDURE [Sales].[usp_CustomerTransactionInfo]
	@CustomerID INT
AS

	SELECT [CustomerID], SUM([AmountExcludingTax])
	FROM [Sales].[CustomerTransactions]
	WHERE [CustomerID] = @CustomerID
	GROUP BY [CustomerID];

	SELECT COUNT([OrderID])
	FROM [Sales].[Orders]
	WHERE [CustomerID] = @CustomerID
GO
Then we’ll create an event session:
CREATE EVENT SESSION [TrackQueries] ON SERVER
ADD EVENT sqlserver.sp_statement_completed(
    WHERE ([sqlserver].[is_system]=(0))),
ADD EVENT sqlserver.sql_statement_completed(
    WHERE ([sqlserver].[is_system]=(0)))
ADD TARGET package0.event_file
(
  SET filename=N'C:\temp\TrackQueries',max_file_size=(256)
)
WITH
(
  MAX_MEMORY = 4096 KB,
  EVENT_RETENTION_MODE = ALLOW_SINGLE_EVENT_LOSS,
  MAX_DISPATCH_LATENCY = 30 SECONDS,
  MAX_EVENT_SIZE = 0 KB,
  MEMORY_PARTITION_MODE = NONE,
  TRACK_CAUSALITY = ON,
  STARTUP_STATE = OFF
);
We are also going to run ad-hoc queries, so we are capturing both sp_statement_completed (statements completed within a stored procedure) and sql_statement_completed (statements completed that are not within a stored procedure). Note that the TRACK_CAUSALITY option for the session is set to ON. Again, this setting is specific to the event session and has to be enabled prior to starting it. You cannot enable the setting on the fly, like you can add or remove events and targets while the session is running.
To start the event session through the UI, just right-click on it and select Start Session.
Testing
Within Management Studio we’ll run the following code:
EXEC [Sales].[usp_CustomerTransactionInfo] 490;

SELECT [c].[CustomerID], [c].[CustomerName], [p].[FullName], [o].[OrderID]
    FROM [Application].[People] [p]
    JOIN [Sales].[Customers] [c] ON [p].[PersonID] = [c].[PrimaryContactPersonID]
    JOIN [Sales].[Orders] [o] ON [c].[CustomerID] = [o].[CustomerID]
    WHERE [p].[FullName] = 'Naseem Radan';
Here’s our XE output:
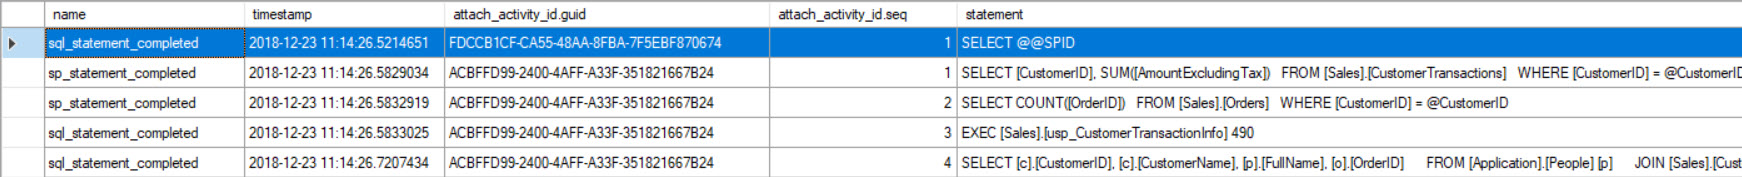
Note that the first query executed, which is highlighted, is SELECT @@SPID, and has a GUID of FDCCB1CF-CA55-48AA-8FBA-7F5EBF870674. We did not execute this query, it occurred in the background, and even though the XE session is set up to filter out system queries, this one – for whatever reason – is still captured.
The next four lines represent the code we actually did run. There are the two queries from the stored procedure, the stored procedure itself, and then our ad-hoc query. All have the same GUID, ACBFFD99-2400-4AFF-A33F-351821667B24. Next to the GUID is the sequence id (seq), and the queries are numbered one through four.
In our example, we did not use GO to separate the statements into different batches. Notice how the output changes when we do that:
EXEC [Sales].[usp_CustomerTransactionInfo] 490;
GO

SELECT [c].[CustomerID], [c].[CustomerName], [p].[FullName], [o].[OrderID]
    FROM [Application].[People] [p]
    JOIN [Sales].[Customers] [c] ON [p].[PersonID] = [c].[PrimaryContactPersonID]
    JOIN [Sales].[Orders] [o] ON [c].[CustomerID] = [o].[CustomerID]
    WHERE [p].[FullName] = 'Naseem Radan';
GO
We still have the same number of total rows, but now we have three GUIDs. One for the SELECT @@SPID (E8D136B8-092F-439D-84D6-D4EF794AE753), one for the three queries representing the stored procedure (F962B9A4-0665-4802-9E6C-B217634D8787), and one for the ad-hoc query (5DD6A5FE-9702-4DE5-8467-8D7CF55B5D80).
This is what you will most likely see when you’re looking at data from your application, but it depends on how the application works. If it uses connection pooling, and connections are reset regularly (which is expected), then each connection will have its own GUID.
You can recreate this using the sample PowerShell code below:
while(1 -eq 1)
{

    $SqlConn = New-Object System.Data.SqlClient.SqlConnection;
    $SqlConn.ConnectionString = "Data Source=Hedwig\SQL2017;Initial Catalog=WideWorldImporters;Integrated Security=True;Application Name = MyCoolApp";
    $SQLConn.Open()
    $SqlCmd = $SqlConn.CreateCommand();

    $SqlCmd.CommandText = "SELECT TOP 1 CustomerID FROM Sales.Customers ORDER BY NEWID();"
    $SqlCmd.CommandType = [System.Data.CommandType]::Text;

    $SqlReader = $SqlCmd.ExecuteReader();
    $Results = New-Object System.Collections.ArrayList;

    while ($SqlReader.Read())
    {
	    $Results.Add($SqlReader.GetSqlInt32(0)) | Out-Null;
    }

    $SqlReader.Close();


	$Value = Get-Random -InputObject $Results;

    $SqlCmd = $SqlConn.CreateCommand();
	$SqlCmd.CommandText = "Sales.usp_CustomerTransactionInfo"
	$SqlCmd.CommandType = [System.Data.CommandType]::StoredProcedure;

	$SqlParameter = $SqlCmd.Parameters.AddWithValue("@CustomerID", $Value);
	$SqlParameter.SqlDbType = [System.Data.SqlDbType]::Int;

	$SqlCmd.ExecuteNonQuery();

    $SqlConn.Close();

    $Names = New-Object System.Collections.Generic.List``1[System.String]

    $SqlConn = New-Object System.Data.SqlClient.SqlConnection
    $SqlConn.ConnectionString = "Data Source=Hedwig\SQL2017;Initial Catalog=WideWorldImporters;User Id=aw_webuser;Password=12345;Application Name=AdventureWorks Online Ordering;Workstation ID=AWWEB01";
    $SqlConn.Open();

    $SqlCmd = $SqlConn.CreateCommand();
    $SqlCmd.CommandText = "SELECT FullName FROM Application.People ORDER BY NEWID();";
    $dr = $SqlCmd.ExecuteReader();

    while($dr.Read())
    {
          $Names.Add($dr.GetString(0));
    }

    $SqlConn.Close();

    $name = Get-Random -InputObject $Names;

    $query = [String]::Format("SELECT [c].[CustomerID], [c].[CustomerName], [p].[FullName], [o].[OrderID]
    FROM [Application].[People] [p]
    JOIN [Sales].[Customers] [c] ON [p].[PersonID] = [c].[PrimaryContactPersonID]
    JOIN [Sales].[Orders] [o] ON [c].[CustomerID] = [o].[CustomerID]
    WHERE [p].[FullName] = '{0}';", $name);

    $SqlConn = New-Object System.Data.SqlClient.SqlConnection
    $SqlConn.ConnectionString = "Data Source=Hedwig\SQL2017;Initial Catalog=WideWorldImporters;User Id=aw_webuser;Password=12345;Application Name=AdventureWorks Online Ordering;Workstation ID=AWWEB01";
    $SqlConn.Open();

    $SqlCmd = $sqlconnection.CreateCommand();
    $SqlCmd.CommandText = $query

    $SqlCmd.ExecuteNonQuery();

    $SqlConn.Close();
}
Here’s an example of the extended events output after letting the code run for a bit:

There are four different GUIDs for our five statements, and if you look at the code above you’ll see there are four different connections made. If you alter the event session to include the rpc_completed event, you can see entries with exec sp_reset_connection.
Your XE output will depend on your code and your application; I mentioned initially that this was useful when troubleshooting more complex stored procedures. Consider the following example:
DROP PROCEDURE IF EXISTS [Sales].[usp_CustomerTransactionInfo];
GO

CREATE PROCEDURE [Sales].[usp_CustomerTransactionInfo]
	@CustomerID INT
AS

	SELECT [CustomerID], SUM([AmountExcludingTax])
	FROM [Sales].[CustomerTransactions]
	WHERE [CustomerID] = @CustomerID
	GROUP BY [CustomerID];

	SELECT COUNT([OrderID])
	FROM [Sales].[Orders]
	WHERE [CustomerID] = @CustomerID

GO

DROP PROCEDURE IF EXISTS [Sales].[usp_GetFullCustomerInfo];
GO

CREATE PROCEDURE [Sales].[usp_GetFullCustomerInfo]
	@CustomerID INT
AS

	SELECT
		[o].[CustomerID],
		[o].[OrderDate],
		[ol].[StockItemID],
		[ol].[Quantity],
		[ol].[UnitPrice]
	FROM [Sales].[Orders] [o]
	JOIN [Sales].[OrderLines] [ol]
		ON [o].[OrderID] = [ol].[OrderID]
	WHERE [o].[CustomerID] = @CustomerID
	ORDER BY [o].[OrderDate] DESC;

	SELECT
		[o].[CustomerID],
		SUM([ol].[Quantity]*[ol].[UnitPrice])
	FROM [Sales].[Orders] [o]
	JOIN [Sales].[OrderLines] [ol]
		ON [o].[OrderID] = [ol].[OrderID]
	WHERE [o].[CustomerID] = @CustomerID
	GROUP BY [o].[CustomerID]
	ORDER BY [o].[CustomerID] ASC;
GO

DROP PROCEDURE IF EXISTS [Sales].[usp_GetCustomerData];
GO

CREATE PROCEDURE [Sales].[usp_GetCustomerData]
	@CustomerID INT
AS

BEGIN

	SELECT *
	FROM [Sales].[Customers]

	EXEC [Sales].[usp_CustomerTransactionInfo] @CustomerID

	EXEC [Sales].[usp_GetFullCustomerInfo] @CustomerID

END
GO
Here we have two stored procedures, usp_TransctionInfo and usp_GetFullCustomerInfo, which are called by another stored procedure, usp_GetCustomerData. It’s not uncommon to see this, or even see additional levels of nesting with stored procedures. If we execute usp_GetCustomerData from Management Studio, we see the following:
EXEC [Sales].[usp_GetCustomerData] 981;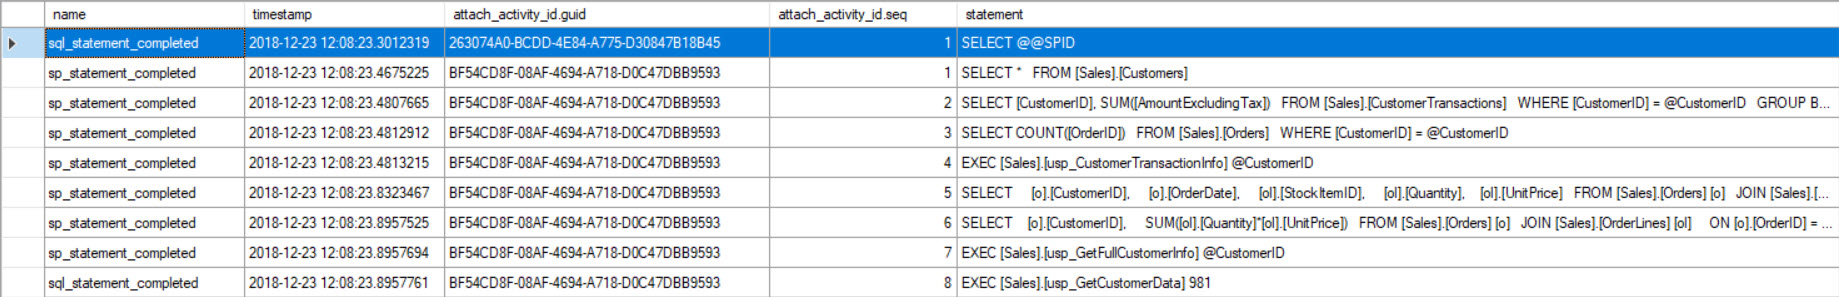
Here, all executions occurred on the same GUID, BF54CD8F-08AF-4694-A718-D0C47DBB9593, and we can see the order of query execution from one to eight using the seq column. In cases where there are multiple stored procedures called, it’s not uncommon for the sequence id value to get into the hundreds or thousands.
Finally, in the case where you’re looking at query execution and you’ve included Track Causality, and you find a query that’s poor performing – because you sorted the output based on duration or some other metric, note that you can find the other queries by grouping on the GUID:
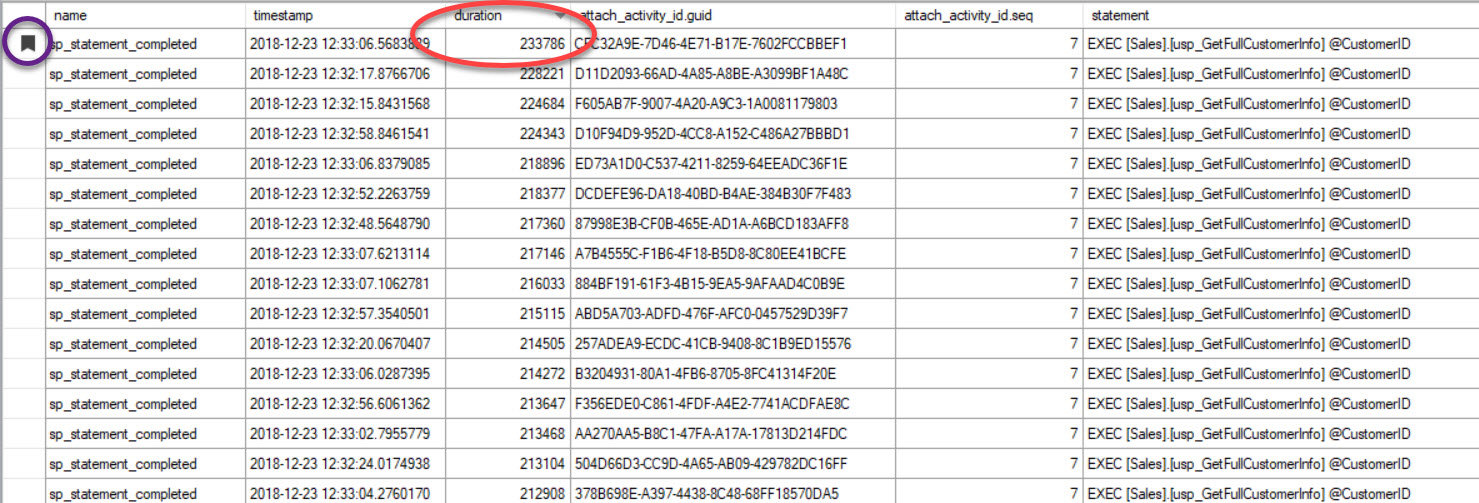
The output has been sorted by duration (highest value circled in red), and I bookmarked it (in purple) using the Toggle Bookmark button. If we want to see the other queries for the GUID, group by GUID (Right-click on the column name at the top, then select Group by this Column), and then use the Next Bookmark button to get back to our query:
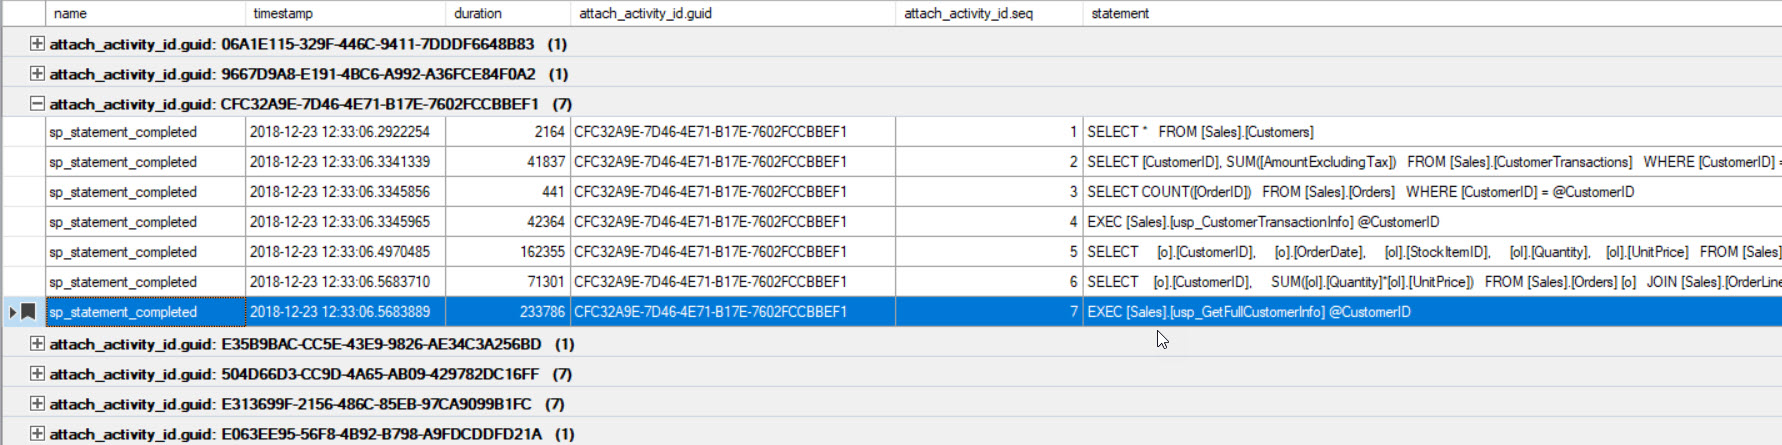
Now we can see all the queries that executed within the same connection, and in the executed order.
Conclusion
The Track Causality option can be immensely useful when troubleshooting query performance and trying to understand the order of events within SQL Server. It’s also useful when setting up an event session that uses the pair_matching target, to help ensure you are matching on the correct field/action and finding the proper unmatched event. Again, this is a session level setting, so it has to be applied before you start the event session. For a session that’s running, stop the event session, enable the option, then start it again.
1 thought on “Using Track Causality to Understand Query Execution”
Comments are closed.

Great post and clear explanations. Thanks Erin. The post on SentryOne team site does seem to be broken though.