I recently received an email question from someone in the community about the CLR_MANUAL_EVENT wait type; specifically, how to troubleshoot issues with this wait suddenly becoming prevalent for an existing workload that relied heavily on spatial data types and queries using the spatial methods in SQL Server.
As a consultant, my first question is almost always, “What’s changed?” But in this case, as in so many cases, I was assured that nothing had changed with the application’s code or workload patterns. So my first stop was to pull up the CLR_MANUAL_EVENT wait in the SQLskills.com Wait Types Library to see what other information we had already collected about this wait type, since it isn’t commonly a wait that I see problems with in SQL Server. What I found really interesting was the chart/heatmap of occurrences for this wait type provided by SentryOne at the top of the page:
The fact that no data has been collected for this type throughout a good cross-section of their customers really confirmed for me that this isn’t something that is commonly a problem, so I was intrigued by the fact that this specific workload was now exhibiting problems with this wait. I wasn’t sure where to go to further investigate the issue so I replied to the email saying I was sorry that I couldn’t help further because I didn’t have any idea what would be causing literally dozens of threads performing spatial queries to all of sudden start having to wait for 2-4 seconds at a time on this wait type.
A day later, I received a kind follow-up email from the person that asked the question that informed me that they had resolved the problem. Indeed, nothing in the actual application workload had changed, but there was a change to the environment that occurred. A third-party software package was installed on all of the servers in their infrastructure by their security team, and this software was collecting data at five-minute intervals and causing the .NET garbage collection processing to run incredibly aggressively and “go nuts” as they said. Armed with this information and some of my past knowledge of .NET development I decided I wanted to play around with this some and see if I could reproduce the behavior and how we could go about troubleshooting the causes further.
Background Information
Over the years I’ve always followed the PSSQL Blog on MSDN, and that is usually one of my go-to locations when I recall that I’ve read about a problem related to SQL Server at some point in the past but I can’t remember all of the specifics.
There is a blog post titled High waits on CLR_MANUAL_EVENT and CLR_AUTO_EVENT by Jack Li from 2008 that explains why these waits can be safely ignored in the aggregate sys.dm_os_wait_stats DMV since the waits do occur under normal conditions, but it doesn’t address what to do if the wait times are excessively long, or what could be causing them to be seen across multiple threads in sys.dm_os_waiting_tasks actively.
There is another blog post by Jack Li from 2013 titled A performance issue involving CLR garbage collection and SQL CPU affinity setting that I reference in our IEPTO2 performance tuning class when I talk about multiple instance considerations and how the .NET Garbage Collector (GC) being triggered by one instance can impact the other instances on the same server.
The GC in .NET exists to reduce the memory usage of applications using CLR by allowing the memory allocated to objects to be cleaned up automatically, thus eliminating the need for developers to have to manually handle memory allocation and deallocation to the degree required by unmanaged code. The GC functionality is documented in the Books Online if you would like to know more about how it works, but the specifics beyond the fact that collections can be blocking are not important to troubleshooting active waits on CLR_MANUAL_EVENT in SQL Server further.
Getting to the Root of the Problem
With the knowledge that garbage collection by .NET was what was causing the issue to occur, I decided to do some experimentation using a single spatial query against AdventureWorks2016 and a very simple PowerShell script to invoke the garbage collector manually in a loop to track what happens in sys.dm_os_waiting_tasks inside of SQL Server for the query:
USE AdventureWorks2016;
GO
SELECT a.SpatialLocation.ToString(), a.City, b.SpatialLocation.ToString(), b.City
  FROM Person.Address AS a
  INNER JOIN Person.Address AS b ON a.SpatialLocation.STDistance(b.SpatialLocation) <= 100
  ORDER BY a.SpatialLocation.STDistance(b.SpatialLocation);
This query is comparing all of the addresses in the Person.Address table against each other to find any address that is within 100 meters of any other address in the table. This creates a long-running parallel task inside of SQL Server that also produces a large Cartesian result. If you decide to reproduce this behavior on your own, don’t expect this to complete or return results back. With the query running, the parent thread for the task begins to wait on CXPACKET waits, and the query continues processing for several minutes. However, what I was interested in was what happens when garbage collection happens in the CLR runtime or if the GC is invoked so I used a simple PowerShell script that would loop and manually force the GC to run.
NOTE: THIS IS NOT A RECOMMENDED PRACTICE IN PRODUCTION CODE FOR A LOT OF REASONS!
while (1 -eq 1) {[System.GC]::Collect() }
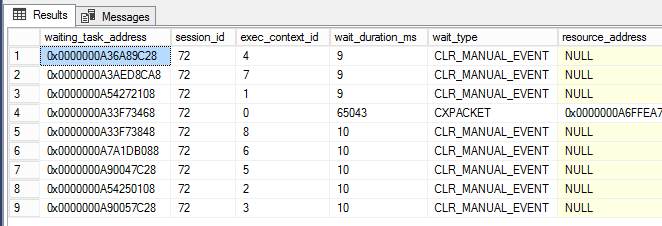
Once the PowerShell window was running, I almost immediately began to see CLR_MANUAL_EVENT waits occurring on the parallel subtask threads (shown below, where exec_context_id is greater than zero) in sys.dm_os_waiting_tasks:
Now that I could trigger this behavior and it was starting to become clear that SQL Server isn’t necessarily the problem here and may just be the victim of other activity, I wanted to know how to dig deeper and pinpoint the root cause of the issue. This is where PerfMon came in handy for tracking the .NET CLR Memory counter group for all tasks on the server.
This screenshot has been reduced to show the collections for sqlservr and powershell as applications compared to the _Global_ collections by the .NET runtime. By forcing GC.Collect() to run constantly we can see that the powershell instance is driving the GC collections on the server. Using this PerfMon counter group we can track what applications are performing the most collections and from there continue further investigation of the problem. For this case, simply stopping the PowerShell script eliminates the CLR_MANUAL_EVENT waits inside of SQL Server and the query continues processing until we either stop it or allow it to return the billion rows of results that would be output by it.
Conclusion
If you have active waits for CLR_MANUAL_EVENT causing application slowdowns, don’t automatically assume that the problem exists inside of SQL Server. SQL Server uses the server level garbage collection (at least prior to SQL Server 2017 CU4 where small servers with under 2GB RAM can use client level garbage collection to reduce resource usage). If you see this problem occurring in SQL Server use the .NET CLR Memory counter group in PerfMon and check to see if another application is driving garbage collection in CLR and blocking the CLR tasks internally in SQL Server as a result.


Great article, Jonathan! (And it is also great to see you blogging again). Isn't there a SysInternals tool that can be invoked from the command line or PoSH what will dump out the details for the PerfMon .NET CLR Memory counter group?
I was considering your manual diagnostic efforts and thought perhaps we could turn this into an S1 Advisory Condition complete with the response of deeper diagnostics.
Great You are back again Jonathan
You are always fabulous