
SQLskills Wait Types Library now shows SentryOne data
A few years ago I realized that there was a huge gap in knowledge in the SQL Server community – what do all the various wait types mean? – so I started a labor-of-love project to document all wait types and latch classes that have existed from SQL Server 2005 onward. In May 2016, I released the SQLskills Waits Types and Latch Classes Library, and I updated all my waits-related scripts to have auto-generated URLs into the library to help people troubleshooting performance issues. All 898 waits and 185 latches through SQL Server 2016 are in the library, with detailed information on 303 waits and 32 latches so far.
However, one thing missing from the library has been an indication of whether a particular wait is rare or whether it's one that nearly everyone is likely to see on their instances. So I worked with my good friend Greg Gonzalez, the CEO of SentryOne (formerly known as SQL Sentry, and a long-time partner company with SQLskills), on some ideas about using their data warehouse of anonymous performance metrics from the many thousands of instances of SQL Server that their tools monitor.
The upshot of those discussions and recent work is that today we're announcing that all wait types in the library have a new infographic that shows how prevalent each wait is.
Below is a screenshot of the infographic for the CXPACKET wait:
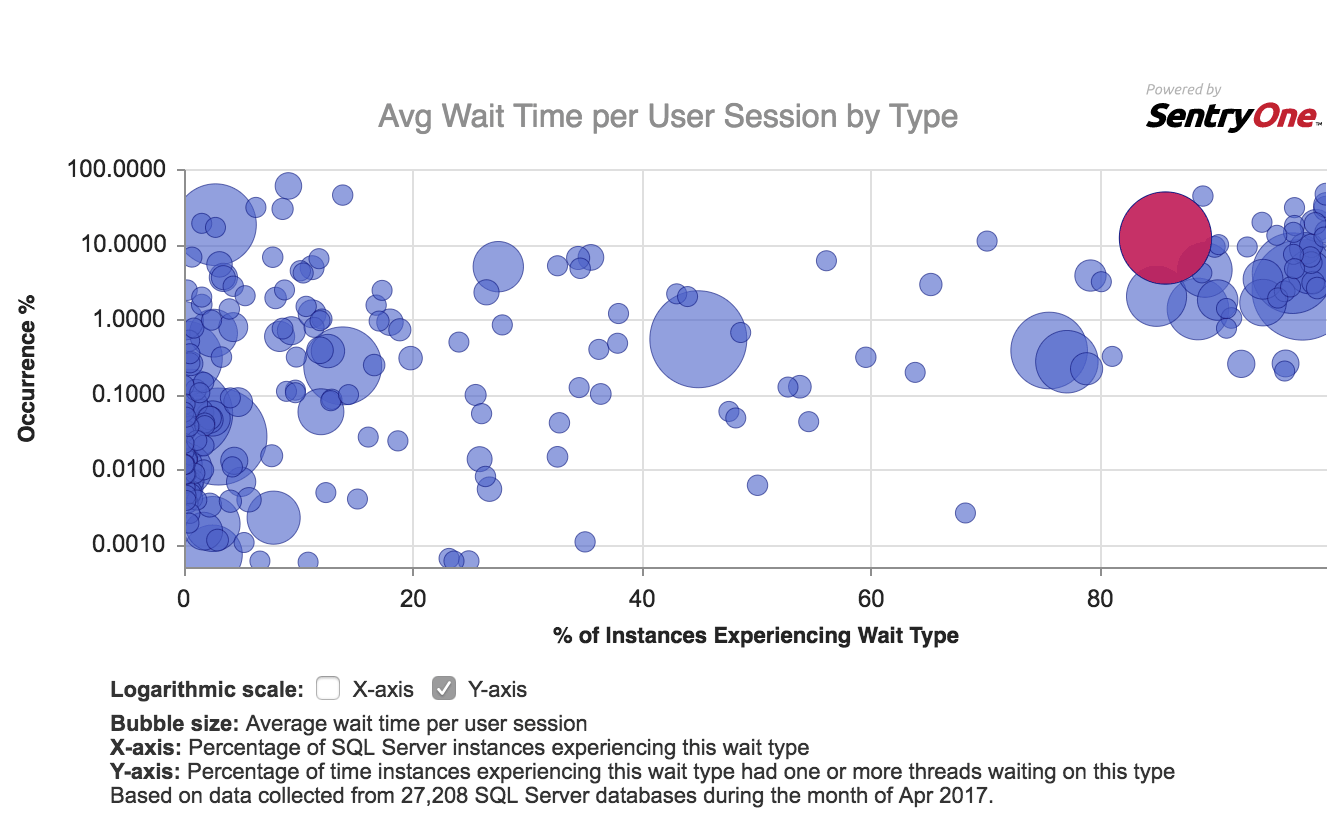
On the horizontal axis is a scale (switchable between linear and logarithmic) of what percentage of instances (monitored by SentryOne) experienced this wait over the previous calendar month, and on the vertical axis is the percentage of time that those instances that experienced that wait actually had a thread waiting for that wait type.
What does this all mean? You can now get a feel for whether you're experiencing something rare or very commonplace.
What's even better is that the infographics are interactive in the library – you can click on any of the waits shown and be taken to its page.
I think this is a really useful addition to the library and I'm very grateful to SentryOne for making this data available to the community!
Check out the upgraded library at the following URL: https://www.sqlskills.com/help/waits/
PS Many thanks to Jim Benton and Melissa Coates from SentryOne for building the infographics and the back-end data source, and to our own Jonathan Kehayias for helping me integrate the infographics into the library.
2 thoughts on “SQLskills Wait Types Library now shows SentryOne data”
Comments are closed.

Excellent. Now I would like to see that somehow being integrated into SQLSentry itself – similar to what Spotlight is doing. Just a link would be fine. :-)
Great idea Andreas, and this is actually already in the works. You'll be able to link directly to the waits library from the waits visualizations on the performance dashboard, etc.