Generally speaking, the best kind of Sort is one that is avoided completely. With careful indexing and sometimes some creative query writing, we can often remove the need for a Sort operator from execution plans. Where the data to be sorted is large, avoiding this kind of Sort can produce very significant performance improvements.
The second best kind of Sort is the one we cannot avoid, but which reserves an appropriate amount of memory, and uses all or most of it to do something worthwhile. Being worthwhile can take many forms. Sometimes, a Sort can more than pay for itself by enabling a later operation that works much more efficiently on sorted input. Other times, the Sort is just plain necessary, and we just need to make it as efficient as possible.
Then come the Sorts that we usually want to avoid: those that reserve far more memory than they need, and those that reserve too little. The latter case is the one that most people focus on. With insufficient memory reserved (or available) to complete the required sorting operation in memory, a Sort operator will, with few exceptions, spill data rows to tempdb. In reality, this almost always means writing sort pages to physical storage (and reading them back later on of course).
In modern versions of SQL Server, a spilled Sort results in a warning icon in post-execution plans, which may include details concerning how much data was spilled, how many threads were involved, and the spill level.
Background: Spill Levels
Consider the task of sorting 4000MB of data, when we only have 500MB of memory available. Obviously, we cannot sort the whole set in memory at once, but we can break the task down:
We first read 500MB of data, sort that set in memory, then write the result to disk. Performing this a total of 8 times consumes the entire 4000MB input, resulting in 8 sets of sorted data 500MB in size. The second step is to perform an 8-way merge of the sorted data sets. Note that a merge is required, not a simple concatenation of the sets since the data is only guaranteed to be sorted as required within a particular 500MB set at the intermediate stage.
In principle, we could read and merge one row at a time from each of the eight sort runs, but this would not be very efficient. Instead, we read the first part of each sort run back into memory, say 60MB. This consumes 8 x 60MB = 480MB of the 500MB we have available. We can then efficiently perform the 8-way merge in memory for a while, buffering the final sorted output with the 20MB memory still available. As each of the sort run memory buffers empties, we read a new section of that sort run into memory. Once all sort runs have been consumed, the sort is complete.
There are some additional details and optimizations we can include, but that is the basic outline of a Level 1 spill, also known as a single-pass spill. A single extra pass over the data is required to produce the final sorted output.
Now, an n-way merge could theoretically accommodate a sort of any size, in any amount of memory, simply by increasing the number of intermediate locally-sorted sets. The problem is that as 'n' increases, we end up reading & writing smaller chunks of data. For example, sorting 400GB of data in 500MB of memory would mean something like an 800-way merge, with only about 0.6MB from each intermediate sorted set in memory at any one time (800 x 0.6MB = 480MB, leaving some space for an output buffer).
Multiple merge passes can be used to work around this. The general idea is to progressively merge small chunks into larger ones, until we can efficiently produce the final sorted output stream. In the example, this might mean merging 40 of the 800 first-pass sorted sets at a time, resulting in 20 larger chunks, which can then be merged again to form the output. With a total of two extra passes over the data, this would be a Level 2 spill, and so on. Luckily, a linear increase in spill level enables an exponential increase in sort size, so deep sort spill levels are rarely necessary.
The "Level 15,000" Spill
At this point, you might be wondering what combination of tiny memory grant and enormous data size could possibly result in a level 15,000 sort spill. Trying to sort the entire Internet in 1MB of memory? Possibly, but that is way too hard to demo. To be honest, I have no idea if such a genuinely high spill level is even possible in SQL Server. The goal here (a cheat, for sure) is to get SQL Server to report a level 15,000 spill.
The key ingredient is partitioning. Since SQL Server 2012, we have been allowed a (convenient) maximum of 15,000 partitions per object (support for 15,000 partitions is also available on 2008 SP2 and 2008 R2 SP1, but you have to enable it manually per database, and be aware of all the caveats).
The first thing we will need is a 15,000-element partition function and an associated partition scheme. To avoid a truly enormous inline code block, the following script uses dynamic SQL to generate the required statements:
DECLARE
    @sql nvarchar(max) =
        N'
        CREATE PARTITION FUNCTION PF (integer)
        AS RANGE LEFT
        FOR VALUES
        (1';

DECLARE @i integer = 2;

WHILE @i < 15000
BEGIN
    SET @sql += N',' + CONVERT(nvarchar(5), @i);

    SET @i += 1;
END;

SET @sql = @sql + N');';

EXECUTE (@sql);

CREATE PARTITION SCHEME PS
AS PARTITION PF
ALL TO ([PRIMARY]);
The script is easy enough to modify to a lower number in case your setup struggles with 15,000 partitions (particularly from a memory point of view, as we will see shortly). The next steps are to create a normal (not partitioned) heap table with a single integer column, and then to populate it with the integers from 1 to 15,000 inclusive:
SET STATISTICS XML OFF;
SET NOCOUNT ON;

DECLARE @i integer = 1;

BEGIN TRANSACTION;

WHILE @i <= 15000
BEGIN
    INSERT dbo.Test1 (c1) VALUES (@i);
    SET @i += 1;
END;

COMMIT TRANSACTION;

SET NOCOUNT OFF;
That should complete in 100ms or so. If you have a numbers table available, feel free to use that instead for a more set-based experience. The way the base table is populated is not important. To get our 15,000 level spill, all we need do now is create a partitioned clustered index on the table:
CREATE UNIQUE CLUSTERED INDEX CUQ
ON dbo.Test1 (c1)
WITH (MAXDOP = 1)
ON PS (c1);
Execution time depends very much on the storage system in use. On my laptop, using a fairly typical consumer SSD from a couple of years ago, it takes around 20 seconds, which is pretty significant considering we are only dealing with 15,000 rows in total. On a fairly low-spec Azure VM with pretty terrible I/O performance, the same test took closer to 20 minutes.
Analysis
The execution plan for the index build is:

The Table Scan reads the 15,000 rows from our heap table. The Compute Scalar computes the destination index partition number for each row using the internal function RangePartitionNew(). The Sort is the most interesting part of the plan, so we will look at it in more detail.
First, the Sort Warning, as displayed in Plan Explorer:

A similar warning from SSMS (taken from a different run of the script):
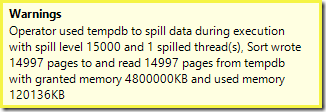
The first thing to note is the report of a 15,000 sort spill level, as promised. This is not entirely accurate, but the details are quite interesting. The Sort in this plan has a Partition ID property, which is not normally present:
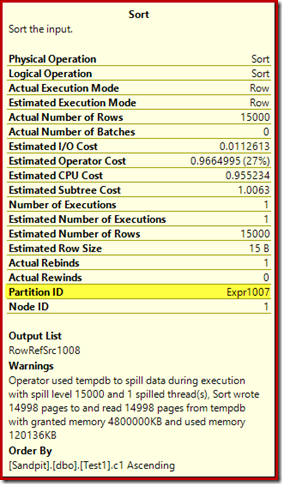
This property is set equal to the internal partitioning function definition in the Compute Scalar.
This is a non-aligned index build, because the source and destination have different partitioning arrangements. In this case, that difference arises because the source heap table is not partitioned, but the destination index is. As a consequence, 15,000 separate sorts are created at runtime: one per non-empty target partition. Each of these sorts spills to level 1, and SQL Server sums all these spills up to give the final sort spill level of 15,000.
The 15,000 separate sorts explains the large memory grant. Each sort instance has a minimum size of 40 pages, which is 40 x 8KB = 320KB. The 15,000 sorts therefore require 15,000 x 320KB = 4,800,000KB memory as a minimum. That is just shy of 4.6GB RAM reserved exclusively for a query that sorts 15,000 rows containing a single integer column. And each sort spills to disk, despite only receiving one row! If parallelism were used for the index build, the memory grant could be further inflated by the number of threads. Note also that the single row is written in a page, which explains the number of pages written to and read from tempdb. There appears to be a race condition that means the reported number of pages is often a few less than 15,000.
This example reflects an edge case, of course, but it is still hard to understand why each sort spills its single row instead of sorting in the memory it has been given. Perhaps this is by design for some reason, or maybe it is simply a bug. Whatever the case, it is still quite entertaining to see a sort of a few hundred KB of data taking so long with a 4.6GB of memory grant and a 15,000 level spill. Unless you encounter it in a production environment, maybe. Anyway, it is something to be aware of.
The misleading 15,000 level spill report pretty much comes down to representation limitations in show plan output. The fundamental issue is something that arises in many places where repeated actions occur, for example on the inner side of the nested loops join. It would certainly be useful to be able to see a more precise breakdown instead of an overall total in these cases. Over time, this area has improved a bit, so we now have more plan information per thread, or per partition for some operations. There is still a long way to go though.
It is still less than helpful that 15,000 separate level 1 spills are reported here as a single 15,000 level spill.
Test Variations
This article is more about highlighting plan information limitations and the potential for poor performance when extreme numbers of partitions are used, than it is about making the particular example operation more efficient, but there are a couple of interesting variations I want to look at as well.
Online, Sort in tempdb
Performing the same partitioned index creation operation with ONLINE = ON, SORT_IN_TEMPDB = ON does not suffer from the same enormous memory grant and spilling:
CREATE TABLE dbo.Test2
(
    c1 integer NOT NULL
);

-- Copy the sample data
INSERT dbo.Test2 WITH (TABLOCKX)
	(c1)
SELECT
	T1.c1
FROM dbo.Test1 AS T1
OPTION (MAXDOP 1);

-- Partitioned clustered index build
CREATE CLUSTERED INDEX CUQ
ON dbo.Test2 (c1)
WITH (MAXDOP = 1, ONLINE = ON, SORT_IN_TEMPDB = ON)
ON PS (c1);
Note that using ONLINE on its own is not sufficient. In fact, that results in the same plan as before with all the same issues, plus an additional overhead for building each index partition online. For me, that results in execution time of well over a minute. Goodness knows how long it would take on a low-spec Azure instance with dreadful I/O performance.
Anyway, the execution plan with ONLINE = ON, SORT_IN_TEMPDB = ON is:

The Sort is performed before the destination partition number is calculated. It does not have the Partition ID property, so it is just a normal sort. The whole operation runs for about ten seconds (there are still a lot of partitions to create). It reserves less than 3MB of memory, and uses a maximum of 816KB. Quite an improvement over 4.6GB and 15,000 spills.
Index first, then data
Similar results can be obtained by writing the data to a heap table first:
-- Heap source
CREATE TABLE dbo.SourceData
(
    c1 integer NOT NULL
);

-- Add data
SET STATISTICS XML OFF;
SET NOCOUNT ON;

DECLARE @i integer = 1;

BEGIN TRANSACTION;

WHILE @i <= 15000
BEGIN
	INSERT dbo.SourceData (c1) VALUES (@i);
	SET @i += 1;
END;

COMMIT TRANSACTION;

SET NOCOUNT OFF;
Next, create an empty partitioned clustered table and insert the data from the heap:
-- Destination table
CREATE TABLE dbo.Test3
(
    c1 integer NOT NULL
)
ON PS (c1); -- Optional

-- Partitioned Clustered Index
CREATE CLUSTERED INDEX CUQ
ON dbo.Test3 (c1)
ON PS (c1);

-- Add data
INSERT dbo.Test3 WITH (TABLOCKX)
	(c1)
SELECT
	SD.c1
FROM dbo.SourceData AS SD
OPTION (MAXDOP 1);

-- Clean up
DROP TABLE dbo.SourceData;
This takes around ten seconds, with a 2MB memory grant and no spilling:

Of course, the sort could also be avoided completely by indexing the (un-partitioned) source table, and inserting the data in index order (the best sort is no sort at all, remember).
Partitioned heap, then data, then index
For this last variation, we first create a partitioned heap and load the 15,000 test rows:
CREATE TABLE dbo.Test4
(
    c1 integer NOT NULL
)
ON PS (c1);

SET STATISTICS XML OFF;
SET NOCOUNT ON;

DECLARE @i integer = 1;

BEGIN TRANSACTION;

WHILE @i <= 15000
BEGIN
	INSERT dbo.Test4 (c1) VALUES (@i);
	SET @i += 1;
END;

COMMIT TRANSACTION;

SET NOCOUNT OFF;
That script runs for a second or two, which is pretty good. The final step is to create the partitioned clustered index:
CREATE CLUSTERED INDEX CUQ
ON dbo.Test4 (c1)
WITH (MAXDOP = 1)
ON PS (c1);
That is a complete disaster, both from a performance point of view, and from a show plan information perspective. The operation itself runs for just under a minute, with the following execution plan:
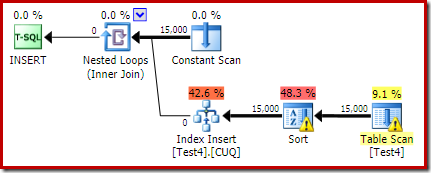
This is a colocated insert plan. The Constant Scan contains a row for each partition id. The inner side of the loop seeks to the current partition of the heap (yes, a seek on a heap). The sort has a partition id property (despite this being constant per loop iteration) so there is a sort per partition and the undesirable spilling behaviour. The statistics warning on the heap table is spurious.
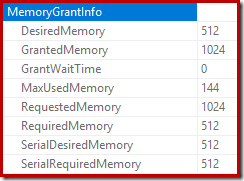
The root of the insert plan indicates that a memory grant of 1MB was reserved, with a maximum of 144KB used:
The sort operator does not report a level 15,000 spill, but otherwise makes a complete mess of the per-loop iteration maths involved:

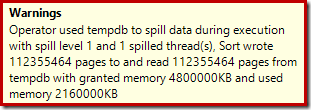
Monitoring the memory grants DMV during execution shows that this query does actually reserve only 1MB, with a maximum of 144KB used on each iteration of the loop. (By contrast, the 4.6GB memory reservation in the first test is absolutely genuine.) This is confusing, of course.
The problem (as mentioned earlier) is that SQL Server gets confused about how best to report on what happened over many iterations. It is probably not practical to include plan performance information per partition per iteration, but there is no getting away from the fact that the current arrangement produces confusing results at times. We can only hope that a better way can be found one day to report this type of information, in a more consistent format.


Paul,
Isn't there new functionality in the 2016 release that enables queries to obtain more memory at the time of execution than was originally reserved for sorting and hashing? I believe I read about this somewhere a while ago. Previously, it was only the type of sort used during index creations that was allowed to do that.
For sorts in batch mode, yes (trace flag 9389 may be required). This might have been extended to hashing in the latest build (CU2) but the KB is vague and I haven't tested it yet. This was the reason for saying "with few exceptions" in the opening section.
I have a question, which might not have anything specifically to do with sort spills. (Thank you, though, for this post. I have learned so much from this and the other posts you've written!)
I have a execution plan with a spill warning ("Operator used tempdb to spill data during execution with spill level 2 and 1 spilled thread(s), Sort wrote 12877 pages to and read 12877 pages from tempdb with granted memory 544KB and used memory 544KB"), but the reported cost is zero. To be exact, "0%" is what's immediately under the sort icon and in the "Estimated Operator Cost" row under "Properties".
I don't know how to interpret that "0%". It could be that the rest of the execution plan is so horrible that it dwarfs the sort. But that cost number, for every operator I've looked at, seems to be the "estimated" cost, even though this is from an "actual" execution plan. And there is no other spill warning, so that ought to be the only operator spill to disk, which in turn should make it one of the most expensive operators in the plan. I want to understand exactly what SQL Server is telling me, but in particular I'm wondering whether this sort spill is worth worrying about.
(By the way, there seems to be a number of missing images. I see a "broken image link" icon for the last four images and all of the images in the "Analysis" section.)
Hi Sam, when you run the query and get an *actual* plan, how long does it take? If it takes long enough, you will see that the actual costs can be determined in 2014 SP1+, and we do that in Plan Explorer if you use Live Query Profile. The estimates can *sometimes* be a useful guide, but sometimes they are absolute garbage. Unfortunately these are the only numbers you really get from SQL Server in older versions and when looking just at the plan itself.
Thank you, Aaron. That explains what I'm seeing. We're about a month away from upgrading to 2014 from 2012. The query takes 20 seconds, for what it's worth.
As Aaron said, SQL Server only reports optimizer *estimates* of cost, even in post-execution (actual plans), which has been misleading people for more years than I care to count. Even where estimates are accurate, the model costs almost certainly don't match your configuration and hardware. So, it's important not to treat these numbers too literally. They are useful to the optimizer as way to choose between plan alternatives, but they often mean little when it comes to runtime costs.
The 0% cost shows that the optimizer expected the sort to be trivial compared with the other operations in the plan. For whatever reason (usually a cardinality misestimation) this turned out not to be the case. In that sense, the whole plan is based on an invalid assumption, so you should consider ways to improve that. It is not always as easy to do as it is to say, but there we are.
Speaking generally, I would always want to understand the reasons for a sort spill (especially a multi-pass spill with a non-trivial number of pages) but I rather suspect there is more going on there to account for 20 seconds of execution time. Perhaps capture a plan with the latest version Plan Explorer and upload it so we can give some specific advice?
The problem with the images was site-wide for a short time as far as I can tell. It seems to be fixed now.
Thank you, Paul. It seems obvious now that it's still reporting estimates, but it was very difficult to believe that Microsoft would leave the tool in a state where it is so misleading, especially when it seems relatively easy to fix.
And thank you for the offer, but I'm not stuck yet. I may try the Q&A forum if I do get stuck.