This article uses a simple query to explore some deep internals concerning update queries.
Sample Data and Configuration
The sample data creation script below requires a table of numbers. If you do not have one of these already, the script below can be used to create one efficiently. The resulting numbers table will contain a single integer column with numbers from one to one million:
WITH Ten(N) AS
(
    SELECT 1 UNION ALL SELECT 1 UNION ALL SELECT 1 UNION ALL
    SELECT 1 UNION ALL SELECT 1 UNION ALL SELECT 1 UNION ALL
    SELECT 1 UNION ALL SELECT 1 UNION ALL SELECT 1 UNION ALL SELECT 1
)
SELECT TOP (1000000)
	n = IDENTITY(int, 1, 1)
INTO   dbo.Numbers
FROM   Ten T10,
       Ten T100,
       Ten T1000,
       Ten T10000,
       Ten T100000,
       Ten T1000000;

ALTER TABLE dbo.Numbers
ADD CONSTRAINT PK_dbo_Numbers_n
PRIMARY KEY CLUSTERED (n)
WITH (SORT_IN_TEMPDB = ON, MAXDOP = 1, FILLFACTOR = 100);
The script below creates a clustered sample data table with 10,000 IDs, with about 100 different start dates per ID. The end date column is initially set to the fixed value '99991231'.
CREATE TABLE dbo.Example
(
    SomeID      integer NOT NULL,
    StartDate   date NOT NULL,
    EndDate     date NOT NULL
);
GO
INSERT dbo.Example WITH (TABLOCKX)
    (SomeID, StartDate, EndDate)
SELECT DISTINCT
    1 + (N.n % 10000),
    DATEADD(DAY, 50000 * RAND(CHECKSUM(NEWID())), '20010101'),
    CONVERT(date, '99991231', 112)
FROM dbo.Numbers AS N
WHERE
    N.n >= 1
    AND N.n <= 1000000
OPTION (MAXDOP 1);

CREATE CLUSTERED INDEX
    CX_Example_SomeID_StartDate
ON dbo.Example
    (SomeID, StartDate)
WITH (MAXDOP = 1, SORT_IN_TEMPDB = ON);
While the points made in this article apply pretty generally to all current versions of SQL Server, the configuration information below can be used to ensure you see similar execution plans and performance effects:
- SQL Server 2012 Service Pack 3 x64 Developer Edition
- Max server memory set to 2048 MB
- Four logical processors available to the instance
- No trace flags enabled
- Default read committed isolation level
- RCSI and SI database options disabled
Hash Aggregate Spills
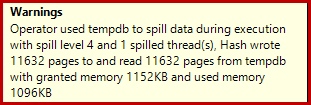
If you run the data creation script above with actual execution plans enabled, the hash aggregate may spill to tempdb, generating a warning icon:
When executed on SQL Server 2012 Service Pack 3, additional information about the spill is shown in the tooltip:
This spill might be surprising, given that the input row estimates for the Hash Match are exactly correct:

We are used to comparing estimates on the input for sorts and hash joins (build input only), but eager hash aggregates are different. A hash aggregate works by accumulating grouped result rows in the hash table, so it is the number of output rows that is important:

The cardinality estimator in SQL Server 2012 makes a rather poor guess at the number of distinct values expected (1,000 versus 999,034 actual); the hash aggregate spills recursively to level 4 at runtime as a consequence. The 'new' cardinality estimator available in SQL Server 2014 onward happens to produce a more accurate estimation for the hash output in this query, so you will not see a hash spill in that case:

The number of Actual Rows may be slightly different for you, given the use of a pseudo-random number generator in the script. The important point is that Hash Aggregate spills depend on the number of unique values output, not on the input size.
The Update Specification
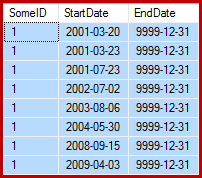
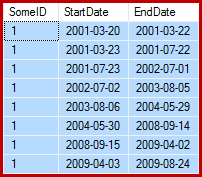
The task at hand is to update the example data such that the end dates are set to the day before the following start date (per SomeID). For example, the first few rows of the sample data might look like this before the update (all end dates set to 9999-12-31):
Then like this after the update:
1. Baseline Update Query
One reasonably natural way to express the required update in T-SQL is as follows:
UPDATE dbo.Example WITH (TABLOCKX)
SET EndDate =
    ISNULL
    (
        (
            SELECT TOP (1)
                DATEADD(DAY, -1, E2.StartDate)
            FROM dbo.Example AS E2 WITH (TABLOCK)
            WHERE
                E2.SomeID = dbo.Example.SomeID
                AND E2.StartDate > dbo.Example.StartDate
            ORDER BY
                E2.StartDate ASC
        ),
        CONVERT(date, '99991231', 112)
    )
OPTION (MAXDOP 1);
The post-execution (actual) execution plan is:
The most notable feature is the use of an Eager Table Spool to provide Halloween Protection. This is required for correct operation here due to the self-join of the update target table. The effect is that everything to the right of the spool is run to completion, storing all the information needed to make changes in a tempdb work table. Once the reading operation is completed, the contents of the work table are replayed to apply the changes at the Clustered Index Update iterator.
Performance
To focus on the maximum performance potential of this execution plan, we can run the same update query multiple times. Clearly, only the first run will result in any changes to the data, but this turns out to be a minor consideration. If this bothers you, feel free to reset the end date column before each run using the following code. The broad points I will be making do not depend on the number of data changes actually made.
UPDATE dbo.Example WITH (TABLOCKX)
SET EndDate = CONVERT(date, '99991231', 112);
With execution plan collection disabled, all required pages in the buffer pool, and no resetting of the end date values between runs, this query typically executes in around 5700ms on my laptop. The statistics IO output is as follows: (read ahead reads and LOB counters were zero, and are omitted for space reasons)
Table 'Example'. Scan count 999035, logical reads 6186219, physical reads 0
Table 'Worktable'. Scan count 1, logical reads 2895875, physical reads 0
The scan count represents the number of times a scanning operation was started. For the Example table, this is 1 for the Clustered Index Scan, and 999,034 for each time the correlated Clustered Index Seek is rebound. The work table used by the Eager Spool has a scanning operation started just once.
Logical Reads
The more interesting information in the IO output is the number of logical reads: over 6 million for the Example table, and almost 3 million for the work table.
The Example table logical reads are mostly associated with the Seek and the Update. The Seek incurs 3 logical reads for each iteration: 1 each for the root, intermediate, and leaf levels of the index. The Update likewise costs 3 reads each time a row is updated, as the engine navigates down the b-tree to locate the target row. The Clustered Index Scan is responsible for only a few thousand reads, one per page read.
The Spool work table is also structured internally as a b-tree, and counts multiple reads as the spool locates the insert position while consuming its input. Perhaps counter-intuitively, the spool counts no logical reads while it is being read to drive the Clustered Index Update. This is simply a consequence of the implementation: a logical read is counted whenever the code executes the BPool::Get method. Writing to the spool calls this method at each level of the index; reading from the spool follows a different code path that does not call BPool::Get at all.
Notice also that the statistics IO output reports a single total for the Example table, despite the fact it is accessed by three different iterators in the execution plan (the Scan, Seek, and Update). This latter fact makes it hard to correlate logical reads to the iterator that caused them. I hope this limitation is addressed in a future version of the product.
2. Update using Row Numbers
Another way to express the update query involves numbering the rows per ID and joining:
WITH Numbered AS
(
    SELECT
        E.SomeID,
        E.StartDate,
        E.EndDate,
        rn = ROW_NUMBER() OVER (
            PARTITION BY E.SomeID
            ORDER BY E.StartDate ASC)
    FROM dbo.Example AS E
)
UPDATE This WITH (TABLOCKX)
SET EndDate =
    ISNULL
    (
        DATEADD(DAY, -1, NextRow.StartDate),
        CONVERT(date, '99991231', 112)
    )
FROM Numbered AS This
LEFT JOIN Numbered AS NextRow WITH (TABLOCK)
    ON NextRow.SomeID = This.SomeID
    AND NextRow.rn = This.rn + 1
OPTION (MAXDOP 1, MERGE JOIN);
The post-execution plan is as follows:
This query typically runs in 2950ms on my laptop, which compares favourably with the 5700ms (in the same circumstances) seen for the original update statement. The statistics IO output is:
Table 'Example'. Scan count 2, logical reads 3001808, physical reads 0
Table 'Worktable'. Scan count 0, logical reads 0, physical reads 0
This shows two scans started for the Example table (one for each Clustered Index Scan iterator). The logical reads are again an aggregate over all iterators that access this table in the query plan. As before, the lack of a breakdown makes it impossible to determine which iterator (of the two Scans and the Update) was responsible for the 3 million reads.
Nevertheless, I can tell you that the Clustered Index Scans count only a few thousand logical reads each. The vast majority of the logical reads are caused by the Clustered Index Update navigating down the index b-tree to find the update position for each row it processes. You will have to take my word for it for the moment; more explanation will be forthcoming shortly.
The Downsides
That is pretty much the end of the good news for this form of the query. It performs much better than the original, but it is much less satisfactory for a number of other reasons. The main issue is caused by an optimizer limitation, which means it does not recognise that the row numbering operation produces a unique number for each row within a SomeID partition.
This simple fact leads to a number of undesirable consequences. For one thing, the merge join is configured to run in many-to-many join mode. This is the reason for the (unused) work table in the statistics IO (many-to-many merge requires a work table for duplicate join key rewinds). Expecting a many-to-many join also means the cardinality estimate for the join output is hopelessly wrong:
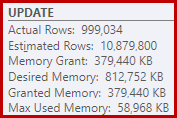
As a consequence of that, the Sort requests far too much memory grant. The root node properties show the Sort would have liked 812,752 KB of memory, though it was only granted 379,440 KB due to the restricted max server memory setting (2048 MB). The sort actually used a maximum of 58,968 KB at runtime:
Excessive memory grants steal memory away from other productive uses, and can lead to queries waiting until memory becomes available. In many respects, excessive memory grants can be more of a problem than underestimates.
The optimizer limitation also explains why a merge join hint was necessary on the query for best performance. Without this hint, the optimizer incorrectly assesses that a hash join would be cheaper than the many-to-many merge join. The hash join plan runs in 3350ms on average.
As a final negative consequence, notice that the Sort in the plan is a Distinct Sort. Now there are a couple of reasons for that Sort (not least because it can provide the required Halloween Protection) but it is only a Distinct Sort because the optimizer misses the uniqueness information. Overall, it is hard to like much about this execution plan beyond the performance.
3. Update using the LEAD Analytic Function
Since this article primarily targets SQL Server 2012 and later, we can express the update query quite naturally using the LEAD analytic function. In an ideal world, we could use a very compact syntax like:
-- Not allowed
UPDATE dbo.Example WITH (TABLOCKX)
SET EndDate = LEAD(StartDate) OVER (
    PARTITION BY SomeID ORDER BY StartDate);
Unfortunately, this is not legal. It results in error message 4108, "Windowed functions can only appear in the SELECT or ORDER BY clauses". This is a bit frustrating because we were hoping for an execution plan that could avoid a self-join (and the associated update Halloween Protection).
The good news is that we can still avoid the self-join using a Common Table Expression or derived table. The syntax is a little more verbose, but the idea is pretty much the same:
WITH CED AS
(
    SELECT
        E.EndDate,
        CalculatedEndDate =
            DATEADD(DAY, -1,
                LEAD(E.StartDate) OVER (
                    PARTITION BY E.SomeID
                    ORDER BY E.StartDate))
    FROM dbo.Example AS E
)
UPDATE CED WITH (TABLOCKX)
SET CED.EndDate =
    ISNULL
    (
        CED.CalculatedEndDate,
        CONVERT(date, '99991231', 112)
    )
OPTION (MAXDOP 1);
The post-execution plan is:
This typically runs in about 3400ms on my laptop, which is slower than the row number solution (2950ms) but still much faster than the original (5700ms). One thing that stands out from the execution plan is the sort spill (again, additional spill information courtesy of the improvements in SP3):
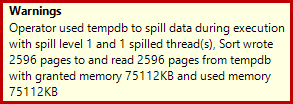
This is quite a small spill, but it still might be affecting performance to some extent. The odd thing about it is that the input estimate to the Sort is exactly correct:

Luckily, there is a "fix" for this specific condition in SQL Server 2012 SP2 CU8 (and other releases – see the KB article for details). Running the query with the fix and required trace flag 7470 enabled means the Sort requests enough memory to ensure it will never to spill to disk if the estimated input sort size is not exceeded.
LEAD Update Query Without Sort Spill
For variety, the fix-enabled query below uses derived table syntax instead of a CTE:
UPDATE CED WITH (TABLOCKX)
SET CED.EndDate =
    ISNULL
    (
        CED.CalculatedEndDate, CONVERT(date, '99991231', 112)
    )
FROM
(
    SELECT
        E.EndDate,
        CalculatedEndDate =
            DATEADD(DAY, -1,
                LEAD(E.StartDate) OVER (
                    PARTITION BY E.SomeID
                    ORDER BY E.StartDate))
    FROM dbo.Example AS E
) AS CED
OPTION (MAXDOP 1, QUERYTRACEON 7470);
The new post-execution plan is:
Eliminating the small spill improves performance from 3400ms to 3250ms. The statistics IO output is:
Table 'Example'. Scan count 1, logical reads 2999455, physical reads 0
Table 'Worktable'. Scan count 0, logical reads 0, physical reads 0
If you compare this with the logical reads for the row numbered query, you will see that the logical reads have decreased from 3,001,808 to 2,999,455 – a difference of 2,353 reads. This corresponds exactly to the removal of a single Clustered Index Scan (one read per page).
You may remember I mentioned that the vast majority of the logical reads for these update queries are associated with the Clustered Index Update, and that the Scans were associated with "only a few thousand reads". We can now see this a little more directly by running a simple row-counting query against the Example table:
SET STATISTICS IO ON;
SELECT COUNT(*) FROM dbo.Example WITH (TABLOCK);
SET STATISTICS IO OFF;
The IO output shows exactly the 2,353 logical read difference between the row number and lead updates:
Table 'Example'. Scan count 1, logical reads 2353, physical reads 0
Further Improvement?
The spill-fixed lead query (3250ms) is still quite a bit slower than the double row numbered query (2950ms), which may be a little surprising. Intuitively, one might expect a single scan and analytic function (Window Spool and Stream Aggregate) to be faster than two scans, two sets of row numbering, and a join.
Regardless, the thing that leaps out from the lead query execution plan is the Sort. It was also present in the row-numbered query, where it contributed Halloween Protection as well as an optimized sort order for the Clustered Index Update (which has the DMLRequestSort property set).
The thing is, this Sort is completely unnecessary in the lead query plan. It is not needed for Halloween Protection because the self-join has gone. It is not needed for optimized insert sort order either: the rows are being read in Clustered Key order, and there is nothing in the plan to disturb that order. The real problem can be seen by looking at the Sort properties:
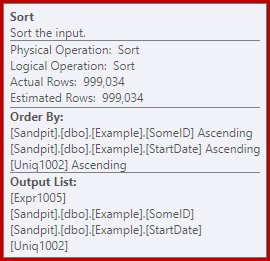
Notice the Order By section there. The Sort is ordering by SomeID and StartDate (the clustered index keys) but also by [Uniq1002], which is the uniquifier. This is a consequence of not declaring the clustered index as unique, even though we took steps in the data population query to ensure that the combination of SomeID and StartDate would in fact be unique. (This was deliberate, so I could talk about this.)
Even so, this is a limitation. Rows are read from the Clustered Index in order, and the necessary internal guarantees exist such that the optimizer could safely avoid this Sort. It is simply a oversight that the optimizer does not recognize that the incoming stream is sorted by uniquifier as well as by SomeID and StartDate. It recognises that (SomeID, StartDate) order could be preserved, but not (SomeID, StartDate, uniquifier). Again, I hope this will be addressed in a future version.
To work around this, we can do what we should have done in the first place: build the clustered index as unique:
CREATE UNIQUE CLUSTERED INDEX CX_Example_SomeID_StartDate
ON dbo.Example (SomeID, StartDate)
WITH (DROP_EXISTING = ON, MAXDOP = 1);

I will leave it as an exercise for the reader to show that the first two (non-LEAD) queries do not benefit from this indexing change (omitted purely for space reasons – there is a lot to cover).
The Final Form of the Lead Update Query
With the unique clustered index in place, the exact same LEAD query (CTE or derived table as you please) produces the estimated (pre-execution) plan we expect:
This seems pretty optimal. A single read and write operation with a minimum of operators in between. Certainly, it seems much better than the previous version with the unnecessary Sort, which executed in 3250ms once the avoidable spill was removed (at the cost of increasing the memory grant a bit).
The post-execution (actual) plan is almost exactly the same as the pre-execution plan:
All the estimates are exactly correct, except the output of the Window Spool, which is off by 2 rows. The statistics IO information is exactly the same as before the Sort was removed, as you would expect:
Table 'Example'. Scan count 1, logical reads 2999455, physical reads 0
Table 'Worktable'. Scan count 0, logical reads 0, physical reads 0
To summarize briefly, the only apparent difference between this new plan and the immediately previous one is that the Sort (with an estimated cost contribution of almost 80%) has been removed.
It may come as a surprise then, to learn that the new query – without the Sort – executes in 5000ms. This is much worse than the 3250ms with the Sort, and almost as long as the 5700ms original loop join query. The double row numbering solution is still way ahead at 2950ms.
Explanation
The explanation is somewhat esoteric and relates to the way latches are handled for the latest query. We can show this effect in several ways, but the simplest is probably to look at the wait and latch statistics using DMVs:
DBCC SQLPERF('sys.dm_os_wait_stats', CLEAR);
DBCC SQLPERF('sys.dm_os_latch_stats', CLEAR);

WITH CED AS
(
    SELECT
        E.EndDate,
        CalculatedEndDate =
            DATEADD(DAY, -1,
                LEAD(E.StartDate) OVER (
                    PARTITION BY E.SomeID
                    ORDER BY E.StartDate))
    FROM dbo.Example AS E
)
UPDATE CED WITH (TABLOCKX)
SET CED.EndDate =
    ISNULL
    (
        CED.CalculatedEndDate,
        CONVERT(date, '99991231', 112)
    )
OPTION (MAXDOP 1);

SELECT * FROM sys.dm_os_latch_stats AS DOLS
WHERE DOLS.waiting_requests_count > 0
ORDER BY DOLS.latch_class;

SELECT * FROM sys.dm_os_wait_stats AS DOWS
WHERE DOWS.waiting_tasks_count > 0
ORDER BY DOWS.waiting_tasks_count DESC;
When the clustered index is not unique, and there is a Sort in the plan, there are no significant waits, just a couple of PAGEIOLATCH_UP waits and the expected SOS_SCHEDULER_YIELDs.
When the clustered index is unique, and the Sort is removed, the waits are:

There are 982,080 exclusive page latches there, with a wait time that explains pretty much all of the extra execution time. To emphasise, that is almost one latch wait per row updated! We might expect a latch per row change, but not a latch wait, especially when the test query is the only activity on the instance. The latch waits are short, but there are an awful lot of them.
Lazy Latches
Following the query execution with a debugger and analyser attached, the explanation is as follows.
The Clustered Index Scan uses lazy latches – an optimization that means latches are only released when another thread requires access to the page. Normally, latches are released immediately after reading or writing. Lazy latches optimize the case where scanning a whole page would otherwise acquire and release the same page latch for every row. When lazy latching is used without contention, only a single latch is taken for the whole page.
The problem is that the pipelined nature of the execution plan (no blocking operators) means that reads overlap with writes. When the Clustered Index Update attempts to acquire an EX latch to modify a row, it will almost always find that the page is already latched SH (the lazy latch taken by the Clustered Index Scan). This situation results in a latch wait.
As part of preparing to wait and switching to the next runnable item on the scheduler, the code is careful to release any lazy latches. Releasing the lazy latch signals the first eligible waiter, which happens to be itself. So, we have the strange situation where a thread blocks itself, releases its lazy latch, then signals itself that it is runnable again. The thread picks up again, and continues, but only after all that wasted suspend and switch, signal and resume work has been done. As I said before, the waits are short, but there are a lot of them.
For all I know, this odd sequence of events is by design and for good internal reasons. Even so, there is no getting away from the fact that it has a fairly dramatic affect on performance here. I will make some enquiries about this and update the article if there is a public statement to make. In the meantime, excessive self-latch waits might be something to watch out for with pipelined update queries, though it is not clear what should be done about it from the query writer's point of view.
Does this mean that the double row-numbering approach is the best we can do for this query? Not quite.
4. Manual Halloween Protection
This last option might sound and look a bit crazy. The broad idea is to write all the information needed to make the changes to a table variable, then perform the update as a separate step.
For want of a better description, I call this the "manual HP" approach because it is conceptually similar to writing all the change information to an Eager Table Spool (as seen in the first query) before driving the Update from that Spool.
Anyway, the code is as follows:
DECLARE @U AS table
(
    SomeID integer NOT NULL,
    StartDate date NOT NULL,
    NewEndDate date NULL,
    PRIMARY KEY CLUSTERED (SomeID, StartDate)
);

INSERT @U
    (SomeID, StartDate, NewEndDate)
SELECT
    E.SomeID,
    E.StartDate,
    DATEADD(DAY, -1,
        LEAD(E.StartDate) OVER (
            PARTITION BY E.SomeID
            ORDER BY E.StartDate))
FROM dbo.Example AS E WITH (TABLOCK)
OPTION (MAXDOP 1);

UPDATE E WITH (TABLOCKX)
SET E.EndDate =
    ISNULL
    (
        U.NewEndDate, CONVERT(date, '99991231', 112)
    )
FROM dbo.Example AS E
JOIN @U AS U
    ON U.SomeID = E.SomeID
    AND U.StartDate = E.StartDate
OPTION (MAXDOP 1, MERGE JOIN);
That code deliberately uses a table variable to avoid the cost of auto-created statistics that using a temporary table would incur. This is OK here because I know the plan shape I want, and it does not depend on cost estimations or statistical information.
The only downside to the table variable (without a trace flag) is that the optimizer will typically estimate a single row and choose nested loops for the update. To prevent this, I have used a merge join hint. Again, this is driven by knowing exactly the plan shape to be achieved.
The post-execution plan for the table variable insert looks exactly the same as the query that had the problem with the latch waits:
The advantage this plan has is that it is not changing the same table it is reading from. No Halloween Protection is required, and there is no chance of latch interference. In addition, there are significant internal optimizations for tempdb objects (locking and logging) and other normal bulk loading optimizations are also applied. Remember that bulk optimizations are only available for inserts, not updates or deletes.
The post-execution plan for the update statement is:

The Merge Join here is the efficient one-to-many type. More to the point, this plan qualifies for a special optimization that means the Clustered Index Scan and Clustered Index Update share the same rowset. The important consequence is that the Update no longer has to locate the row to update – it is already positioned correctly by the read. This saves an awful lot of logical reads (and other activity) at the Update.
There is nothing in normal execution plans to show where this Shared Rowset optimization is applied, but enabling undocumented trace flag 8666 exposes extra properties on the Update and Scan that show rowset sharing is in use, and that steps are taken to ensure the update is safe from the Halloween Problem.
The statistics IO output for the two queries is as follows:
Table 'Worktable'. Scan count 0, logical reads 0, physical reads 0
Table 'Example'. Scan count 1, logical reads 2353, physical reads 0

(999034 row(s) affected)

Table 'Example'. Scan count 1, logical reads 2353, physical reads 0
Table '#B9C034B8'. Scan count 1, logical reads 2353, physical reads 0
Both reads of the Example table involve a single scan and one logical read per page (see the simple row counting query previously). The #B9C034B8 table is the name of the internal tempdb object backing the table variable. The total logical reads for both queries is 3 * 2353 = 7,059. The work table is the in-memory internal storage used by the Window Spool.
The typical execution time for this query is 2300ms. Finally, we have something that beats the double row-numbering query (2950ms), as unlikely as it might seem.
Final Thoughts
There may be even better ways to write this update that perform even better than the "manual HP" solution above. The performance results may even be different on your hardware and SQL Server configuration, but neither of these are the main point of this article. That is not to say that I am not interested to see better queries or performance comparisons – I am.
The point is that there is an awful lot more going on inside SQL Server than is exposed in execution plans. Hopefully some of the details discussed in this rather long article will be interesting or even useful to some people.
It is good to have expectations of performance, and to know what plan shapes and properties are generally beneficial. That sort of experience and knowledge will serve you well for 99% or more of the queries you will ever be asked to tune. Sometimes, though, it is good to try something a little weird or unusual just to see what happens, and to validate those expectations.


Regarding how to avoid the latch waits I had an implementation idea for SQL Server. Keep per-query counters for successes and failures with lazy latching. If it turns out from the counters that there are a lot of failures turn the feature off for that query.
That way queries are runtime profiles and the algorithm adapts. No big architectural changes needed (as it seems).
Great article Paul! I feel like I've occasionally seen situations vaguely like what you describe where the seemingly simpler plan runs more slowly, but when digging into wait stats haven't really been able to figure it out in a satisfactory way. It's great to see an example that has a thorough explanation that you were able to piece together via the debugger and with some interesting internals info I hadn't seen before.
Not sure if it's within the spirit of the "update", but given that you are updating the whole table an alternative approach could be to create a new table with the correct data, drop or rename the old tabley, and rename the copy into its place. As long as there are no foreign keys or anything else that would prevent this approach, that gets it down to about 1600ms for me and has the nice advantage of being minimally logged (depending on the recovery model): https://gist.github.com/anonymous/ce32412ebfcae05ebc78
Or that can be pulled down to about 1100ms by using QUERYTRACEON 8649 to force parallelism of the LEAD computation; the "PARTITION BY SomeId" lends itself well to a parallel plan all the way until the final insert. Or even the final insert can be parallel if using SELECT INTO in SQL 2014 or inserting into a heap on SQL 2016, but adding the clustered index afterwards seems to make it a wash on my laptop.
Very interesting and thorough, thanks!