
Custom Built Statistics
Post by Dan Holmes, who blogs at sql.dnhlms.com.
SQL Server Books Online (BOL), whitepapers, and many other sources will show you how and why you might want to update statistics on a table or index. However, you only get one way to shape those values. I will show you how you can create the statistics exactly the way you want within the bounds of the 200 steps available.
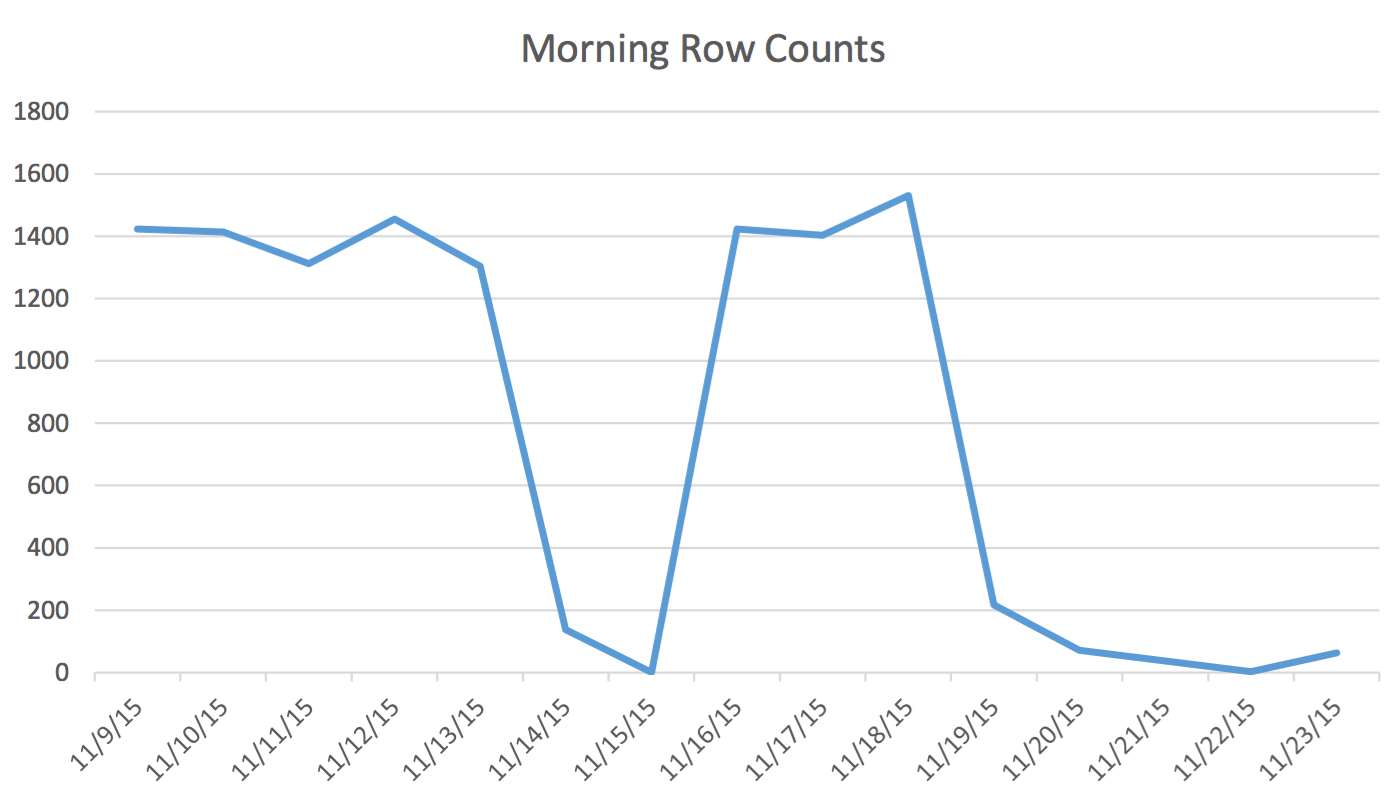
In our application, the Scheduling user is regularly reading and writing data that represents events for tomorrow and the next couple of days. Data for today and earlier is not used by the Scheduler. First thing in the morning, the data set for tomorrow starts at a couple hundred rows and by midday can be 1400 and higher. The following chart will illustrate the row counts. This data was collected on the morning of Wednesday November 18, 2015. Historically, you can see that the regular row count is approximately 1,400 except for weekend days and the next day.
For the Scheduler the only pertinent data is the next few days. What is happening today and happened yesterday isn’t relevant to his activity. So how does this cause a problem? This table has 2,259,205 rows which means the change in row counts from morning to noon will not be enough to trigger a SQL Server initiated statistics update. Furthermore, a manually scheduled job that builds statistics using UPDATE STATISTICS populates the histogram with a sample of all the data in the table but may not include the relevant information. This row count delta is enough to change the plan. However, without a statistics update and an accurate histogram, the plan will not change for the better as the data changes.
A relevant selection of the histogram for this table from a backup dated on 11/4/2015 might look like this:
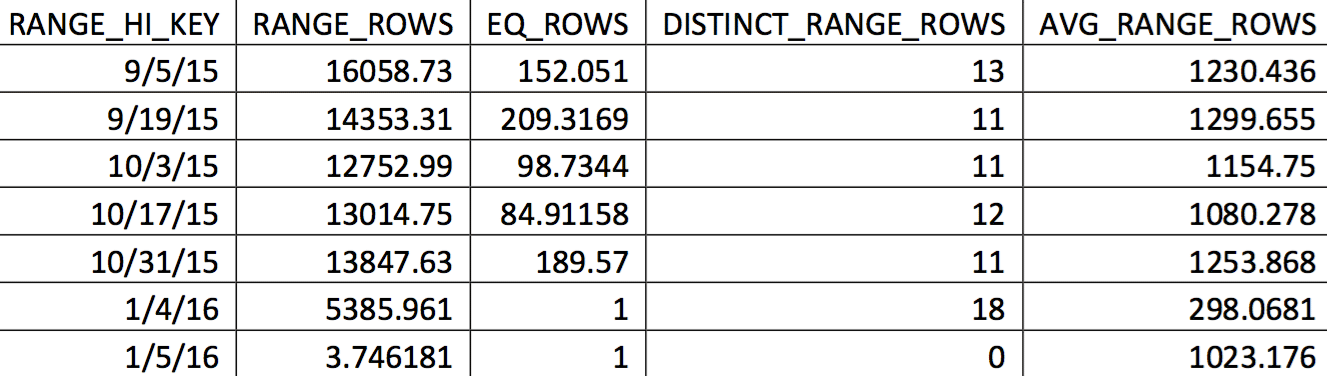
The values of interest are not reflected accurately in the histogram. What would be used for the date of 11/5/2015 would be the high value 1/4/2016. Based on the graph, this histogram is clearly not a good source of information for the optimizer for the date of interest. Forcing the values of use into the histogram isn’t reliable, so how can you do that? My first attempt was to repeatedly use the WITH SAMPLE option of UPDATE STATISTICS and query the histogram until the values I needed were in the histogram (an effort detailed here). Ultimately, that approach proved to be unreliable.
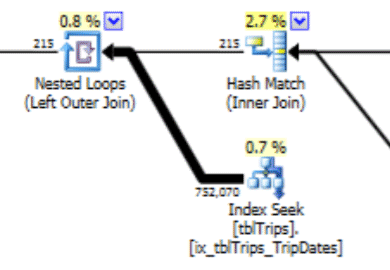
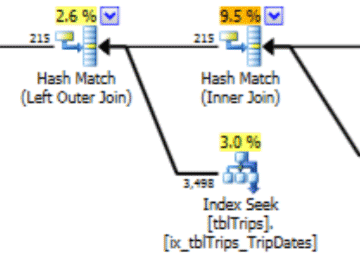
This histogram can lead to a plan with this type of behavior. The underestimate of rows produces a Nested Loop join and an index seek. The reads are subsequently higher than they should be because of this plan choice. This will also have an effect on statement duration.
What would work much better is to create the data exactly how you want it, and here’s how to do that.
There is an unsupported option of UPDATE STATISTICS: STATS_STREAM. This is used by Microsoft Customer Support to export and import statistics so they can get an optimizer recreate without having all the data in the table. We can use that feature. The idea is to create a table that mimics the DDL of the statistic we want to customize. The relevant data is added to the table. The statistics are exported and imported into the original table.
In this case, it is a table with 200 rows of not NULL dates and 1 row that includes the NULL values. Additionally, there is an index on that table that matches the index that has the bad histogram values.
The name of the table is tblTripsScheduled. It has a non-clustered index on (id, TheTripDate) and a clustered index on TheTripDate. There are a handful of other columns, but only the ones involved in the index are important.
Create a table (temp table if you want) that mimics the table and index. The table and index looks like this:
CREATE TABLE #tbltripsscheduled_cix_tripsscheduled(
       id INT NOT NULL
       , tripdate DATETIME NOT NULL
       , PRIMARY KEY NONCLUSTERED(id, tripdate)
);

CREATE CLUSTERED INDEX thetripdate ON #tbltripsscheduled_cix_tripsscheduled(tripdate);
Next, the table needs to be populated with 200 rows of data that the statistics should be based on. For my situation, it is the day-of through the next sixty days. The past and beyond 60 days is populated with a "randomish" selection of every 10 days. (The cnt value in the CTE is a debug value. It does not play a role in the final results.) The descending order for the rn column ensures that the 60 days are included, and then as much of the past as possible.
DECLARE @date DATETIME = '20151104';

WITH tripdates
AS
(
  SELECT thetripdate, COUNT(*) cnt
  FROM dbo.tbltripsscheduled
    WHERE NOT thetripdate BETWEEN @date AND @date
    AND thetripdate < DATEADD(DAY, 60, @date) --only look 60 days out GROUP BY thetripdate
    HAVING DATEDIFF(DAY, 0, thetripdate) % 10 = 0
  UNION ALL
  SELECT thetripdate, COUNT(*) cnt
  FROM dbo.tbltripsscheduled
    WHERE thetripdate BETWEEN @date AND DATEADD(DAY, 60, @date)
    GROUP BY thetripdate
),
tripdate_top_200
AS
(
  SELECT *
  FROM
  (
    SELECT *, ROW_NUMBER() OVER(ORDER BY thetripdate DESC) rn
    FROM tripdates
  ) td
  WHERE rn <= 200
)
INSERT #tbltripsscheduled_cix_tripsscheduled (id, tripdate)
SELECT t.tripid, t.thetripdate
FROM tripdate_top_200 tp
INNER JOIN dbo.tbltripsscheduled t ON t.thetripdate = tp.thetripdate;
Our table is now populated with every row that is valuable for the user today and a selection of historical rows. If the column TheTripdate was nullable, the insert would have also included the following:
UNION ALL
SELECT id, thetripdate
FROM dbo.tbltripsscheduled
WHERE thetripdate IS NULL;
Next, we update the statistics on the index of our temp table.
UPDATE STATISTICS #tbltrips_IX_tbltrips_tripdates (tripdates) WITH FULLSCAN;Now, export those statistics to a temp table. That table looks like this. It matches the output of DBCC SHOW_STATISTICS WITH HISTOGRAM.
CREATE TABLE #stats_with_stream
(
       stream VARBINARY(MAX) NOT NULL
       , rows INT NOT NULL
       , pages INT NOT NULL
);
DBCC SHOW_STATISTICS has an option to export the statistics as a stream. It is that stream that we want. That stream is also the same stream that the UPDATE STATISTICS stream option uses. To do that:
INSERT INTO #stats_with_stream --SELECT * FROM #stats_with_stream
EXEC ('DBCC SHOW_STATISTICS (N''tempdb..#tbltripsscheduled_cix_tripsscheduled'', thetripdate)
  WITH STATS_STREAM,NO_INFOMSGS');
The final step is to create the SQL that updates the statistics of our target table, and then execute it.
DECLARE @sql NVARCHAR(MAX);
SET @sql = (SELECT 'UPDATE STATISTICS tbltripsscheduled(cix_tbltripsscheduled) WITH
STATS_STREAM = 0x' + CAST('' AS XML).value('xs:hexBinary(sql:column("stream"))',
'NVARCHAR(MAX)') FROM #stats_with_stream );
EXEC (@sql);
At this point, we have replaced the histogram with our custom-built one. You can verify by checking the histogram:
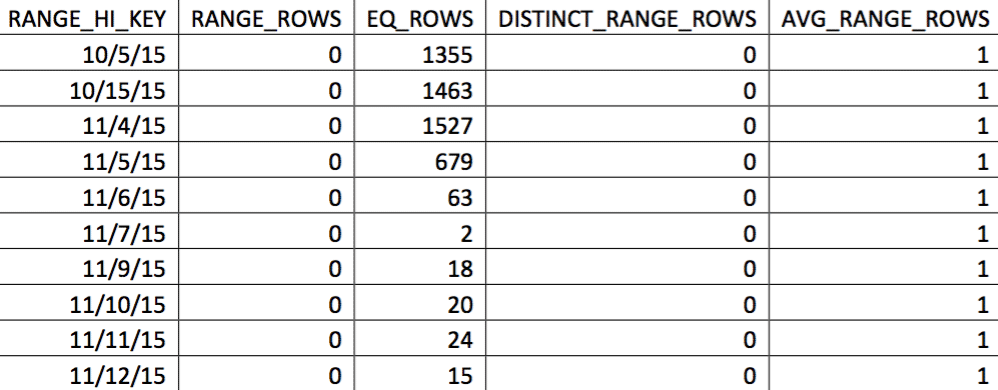
In this selection of the data on 11/4, all the days from 11/4 onwards are represented, and the historical data is represented and accurate. Revisiting the portion of the query plan shown earlier, you can see the optimizer made a better choice based on the corrected statistics:
There is a performance benefit to imported stats. The cost to compute the stats are on an "offline" table. The only downtime for the production table is the duration of the stream import.
This process does use undocumented features and it looks like it could be dangerous, but remember there is an easy undo: the update statistics statement. If something goes wrong, the statistics can always be updated using standard T-SQL.
Scheduling this code to run regularly can greatly help the optimizer produce better plans given a data set that changes over the tipping point but not enough to trigger a statistics update.
When I finished the first draft of this article, the row count on the table in the first chart changed from 217 to 717. That is a 300% change. That is enough to change the behavior of the optimizer but not enough to trigger a statistics update. This data change would have left a bad plan in place. It is with the process described here that this problem is solved.
References:
1 thought on “Custom Built Statistics”
Comments are closed.

This is excellent! I have similar scenarios in my environment where I have very large tables where only the data created in the past 24 hours is typically used. Thank you for sharing.