This article explores some less well-known query optimizer features and limitations, and explains the reasons for extremely poor hash join performance in a specific case.
Sample Data
The sample data creation script that follows relies on an existing table of numbers. If you do not have one of these already, the script below can be used to create one efficiently. The resulting table will contain a single integer column with numbers from one to one million:
WITH Ten(N) AS
(
    SELECT 1 UNION ALL SELECT 1 UNION ALL SELECT 1 UNION ALL
    SELECT 1 UNION ALL SELECT 1 UNION ALL SELECT 1 UNION ALL
    SELECT 1 UNION ALL SELECT 1 UNION ALL SELECT 1 UNION ALL SELECT 1
)
SELECT TOP (1000000)
	n = IDENTITY(int, 1, 1)
INTO   dbo.Numbers
FROM   Ten T10,
       Ten T100,
       Ten T1000,
       Ten T10000,
       Ten T100000,
       Ten T1000000;

ALTER TABLE dbo.Numbers
ADD CONSTRAINT PK_dbo_Numbers_n
PRIMARY KEY CLUSTERED (n)
WITH (SORT_IN_TEMPDB = ON, MAXDOP = 1, FILLFACTOR = 100);
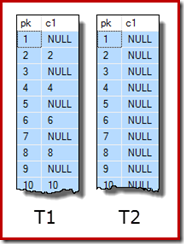
The sample data itself consists of two tables, T1 and T2. Both have a sequential integer primary key column named pk, and a second nullable column named c1. Table T1 has 600,000 rows where even-numbered rows have the same value for c1 as the pk column, and odd-numbered rows are null. Table c2 has 32,000 rows where column c1 is NULL in every row. The following script creates and populates these tables:
CREATE TABLE dbo.T1
(
	pk integer NOT NULL,
	c1 integer NULL,
	CONSTRAINT PK_dbo_T1
		PRIMARY KEY CLUSTERED (pk)
);

CREATE TABLE dbo.T2
(
	pk integer NOT NULL,
	c1 integer NULL,
	CONSTRAINT PK_dbo_T2
		PRIMARY KEY CLUSTERED (pk)
);

INSERT dbo.T1 WITH (TABLOCKX)
	(pk, c1)
SELECT
	N.n,
    CASE
        WHEN N.n % 2 = 1 THEN NULL
        ELSE N.n
    END
FROM dbo.Numbers AS N
WHERE
	N.n BETWEEN 1 AND 600000;

INSERT dbo.T2 WITH (TABLOCKX)
	(pk, c1)
SELECT
	N.n,
    NULL
FROM dbo.Numbers AS N
WHERE
	N.n BETWEEN 1 AND 32000;

UPDATE STATISTICS dbo.T1 WITH FULLSCAN;
UPDATE STATISTICS dbo.T2 WITH FULLSCAN;
The first ten rows of sample data in each table looks like this:
Joining the two tables
This first test involves joining the two tables on column c1 (not the pk column), and returning the pk value from table T1 for rows that join:
SELECT T1.pk
FROM dbo.T1 AS T1
JOIN dbo.T2 AS T2
	ON T2.c1 = T1.c1;
The query will actually return no rows because column c1 is NULL in all rows of table T2, so no rows can match the equality join predicate. This may sound like an odd thing to do, but I am assured it is based on a real production query (greatly simplified for ease of discussion).
Note that this empty result does not depend on the setting of ANSI_NULLS, because that only controls how comparisons with a null literal or variable are handled. For column comparisons, an equality predicate always rejects nulls.
The execution plan for this simple join query has some interesting features. We will look first at the pre-execution ('estimated') plan in SQL Sentry Plan Explorer:

The warning on the SELECT icon is just complaining about a missing index on table T1 for column c1 (with pk as an included column). The index suggestion is irrelevant here.
The first real item of interest in this plan is the Filter:
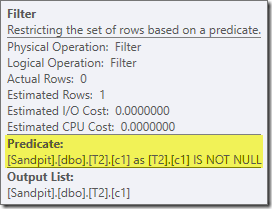
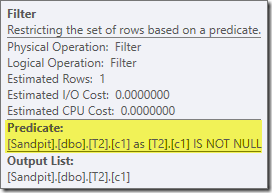
This IS NOT NULL predicate does not appear in the source query, though it is implied in the join predicate as mentioned previously. It is interesting that it has been broken out as an explicit extra operator, and placed before the join operation. Note that even without the Filter, the query would still produce correct results – the join itself would still reject the nulls.
The Filter is curious for other reasons as well. It has an estimated cost of exactly zero (even though it is expected to operate on 32,000 rows), and it has not been pushed down into the Clustered Index Scan as a residual predicate. The optimizer is normally pretty keen to do this.
Both these things are explained by the fact this Filter is introduced in a post-optimization rewrite. After the query optimizer completes its cost-based processing, there are a relatively small number of fixed plan rewrites that are considered. One of these is responsible for introducing the Filter.
We can see the output of cost-based plan selection (before the rewrite) using undocumented trace flags 8607 and the familiar 3604 to direct textual output to the console (messages tab in SSMS):
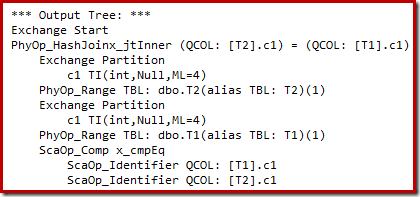
The output tree shows a hash join, two scans, and some parallelism (exchange) operators. There is no null-rejecting Filter on the c1 column of table T2.
The particular post-optimization rewrite looks exclusively at the build input of a hash join. Depending on its assessment of the situation, it may add an explicit Filter to reject rows that are null in the join key. The effect of the Filter on estimated row counts is also written into the execution plan, but because cost-based optimization is already completed, a cost for the Filter is not computed. In case it is not obvious, computing costs is a waste of effort if all cost-based decisions have already been made.
The Filter remains directly on the build input rather than being pushed down into the Clustered Index Scan because main optimization activity has completed. The post-optimization rewrites are effectively last-minute tweaks to a completed execution plan.
A second, and quite separate, post-optimization rewrite is responsible for the Bitmap operator in the final plan (you may have noticed it was also missing from the 8607 output):
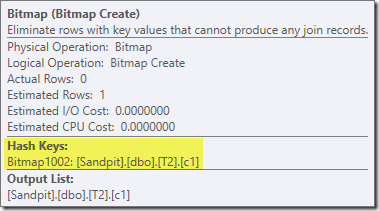
This operator also has a zero estimated cost for both I/O and CPU. The other thing that identifies it as an operator introduced by a late tweak (rather than during cost-based optimization) is that its name is Bitmap followed by a number. There are other types of bitmaps introduced during cost-based optimization as we will see a bit later on.
For now, the important thing about this bitmap is that it records c1 values seen during the build phase of the hash join. The completed bitmap is pushed to the probe side of the join when the hash transitions from build phase to the probe phase. The bitmap is used to perform early semi-join reduction, eliminating rows from the probe side that cannot possibly join. if you need more details on this, please see my previous article on the subject.
The second effect of the bitmap can be seen on the probe-side Clustered Index Scan:
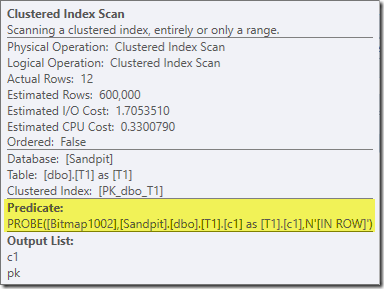
The screenshot above shows the completed bitmap being checked as part of the Clustered Index Scan on table T1. Since the source column is an integer (a bigint would also work) the bitmap check is pushed all the way into the storage engine (as indicated by the 'INROW' qualifier) rather than being checked by the query processor. More generally, the bitmap may be applied to any operator on the probe side, from the exchange down. How far the query processor can push the bitmap depends on the type of the column and the version of SQL Server.
To complete the analysis of the major features of this execution plan, we need to look at the post-execution ('actual') plan:

The first thing to notice is the distribution of rows across threads between the T2 scan and the Repartition Streams exchange immediately above it. On one test run, I saw the following distribution on a system with four logical processors:
![]()
The distribution is not particularly even, as often the case for a parallel scan on a relatively small number of rows, but at least all threads received some work. The thread distribution between the same Repartition Streams exchange and the Filter is very different:
![]()
This shows that all 32,000 rows from table T2 were processed by a single thread. To see why, we need to look at the exchange properties:
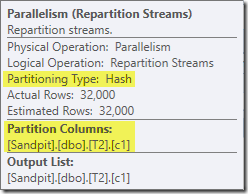
This exchange, like the one on the probe side of the hash join, needs to ensure that rows with the same join key values end up at the same instance of the hash join. At DOP 4, there are four hash joins, each with its own hash table. For correct results, build-side rows and probe-side rows with the same join keys must arrive at the same hash join; otherwise we might check a probe-side row against the wrong hash table.
In a row-mode parallel plan, SQL Server achieves this by repartitioning both inputs using the same hash function on the join columns. In the present case, the join is on column c1, so the inputs are distributed across threads by applying a hash function (partitioning type: hash) to the join key column (c1). The issue here is that column c1 contains only a single value – null – in table T2, so all 32,000 rows are given the same hash value, as so all end up on the same thread.
The good news is that none of this really matters for this query. The post-optimization rewrite Filter eliminates all rows before very much work is done. On my laptop, the query above executes (producing no results, as expected) in around 70ms.
Joining three tables
For the second test, we add an extra join from table T2 to itself on its primary key:
SELECT T1.pk
FROM dbo.T1 AS T1
JOIN dbo.T2 AS T2
	ON T2.c1 = T1.c1
JOIN dbo.T2 AS T3 -- New!
	ON T3.pk = T2.pk;
This does not change the logical results of the query, but it does change the execution plan:

As expected, the self-join of table T2 on its primary key has no effect on the number of rows that qualify from that table:
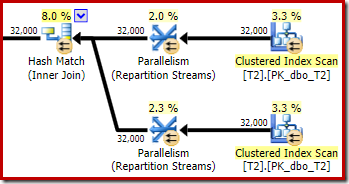
The distribution of rows across threads is also good in this plan section. For the scans, it is similar to before because the parallel scan distributes rows to threads on demand. The exchanges repartition based on a hash of the join key, which is the pk column this time around. Given the range of different pk values, the resulting thread distribution is also very even:
![]()
Turning to the more interesting section of the estimated plan, there are some differences from the two-table test:
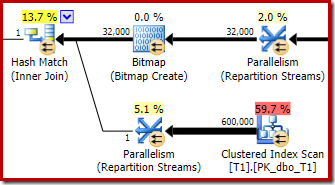
Once again, the build-side exchange ends up routing all rows to the same thread because c1 is the join key, and hence the partitioning column for the Repartition Streams exchanges (remember, c1 is null for all rows in table T2).
There are two other important differences in this section of the plan compared with the previous test. First, there is no Filter to remove null-c1 rows from the build side of the hash join. The explanation for that is tied to the second difference – the Bitmap has changed, though it is not obvious from the picture above:
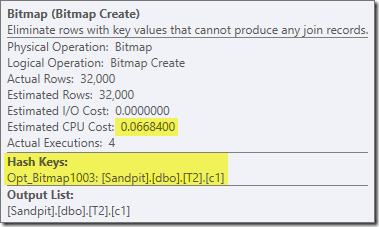
This is an Opt_Bitmap, not a Bitmap. The difference is that this bitmap was introduced during cost-based optimization, not by a last-minute rewrite. The mechanism that considers optimized bitmaps is associated with processing star-join queries. The star-join logic requires at least three joined tables, so this explains why an optimized bitmap was not considered in the two-table join example.
This optimized bitmap has a non-zero estimated CPU cost, and directly affects the overall plan chosen by the optimizer. Its effect on the probe-side cardinality estimate can be seen at the Repartition Streams operator:

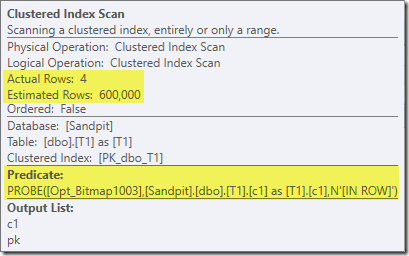
Note the cardinality effect is seen at the exchange, even though the bitmap is eventually pushed all the way down into the storage engine ('INROW') just as we saw in the first test (but note the Opt_Bitmap reference now):
The post-execution ('actual') plan is as follows:

The predicted effectiveness of the optimized bitmap means the separate post-optimization rewrite for the null Filter is not applied. Personally, I think this is unfortunate because eliminating the nulls early with a Filter would negate the need to build the bitmap, populate the hash tables, and perform the bitmap-enhanced scan of table T1. Nevertheless, the optimizer decides otherwise and there is just no arguing with it in this instance.
Despite the extra self-join of table T2, and the extra work associated with the missing Filter, this execution plan still produces the expected result (no rows) in quick time. A typical execution on my laptop takes around 200ms.
Changing the data type
For this third test, we will change the data type of column c1 in both tables from integer to decimal. There is nothing particularly special about this choice; the same effect can be seen with any numeric type that is not integer or bigint.
ALTER TABLE dbo.T1
ALTER COLUMN c1 decimal(9,0) NULL;

ALTER TABLE dbo.T2
ALTER COLUMN c1 decimal(9,0) NULL;

ALTER INDEX PK_dbo_T1 ON dbo.T1
REBUILD WITH (MAXDOP = 1);

ALTER INDEX PK_dbo_T2 ON dbo.T2
REBUILD WITH (MAXDOP = 1);

UPDATE STATISTICS dbo.T1 WITH FULLSCAN;
UPDATE STATISTICS dbo.T2 WITH FULLSCAN;
Reusing the three-join join query:
SELECT T1.pk
FROM dbo.T1 AS T1
JOIN dbo.T2 AS T2
	ON T2.c1 = T1.c1
JOIN dbo.T2 AS T3
	ON T3.pk = T2.pk;
The estimated execution plan looks very familiar:

Aside from the fact that the optimized bitmap can no longer be applied 'INROW' by the storage engine due to the change of data type, the execution plan is essentially identical. The capture below shows the change in scan properties:
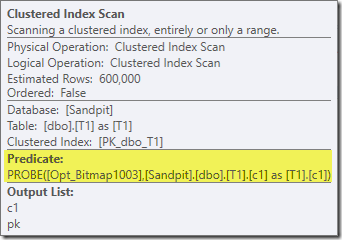
Unfortunately, performance is rather dramatically affected. This query executes not in 70ms or 200ms, but in around 20 minutes. In the test that produced the following post-execution plan, the runtime was actually 22 minutes and 29 seconds:

The most obvious difference is that the Clustered Index Scan on table T1 returns 300,000 rows even after the optimized bitmap filter is applied. This makes some sense, since the bitmap is built on rows that contain only nulls in the c1 column. The bitmap removes non-null rows from the T1 scan, leaving just the 300,000 rows with null values for c1. Remember, half the rows in T1 are null.
Even so, it seems strange that joining 32,000 rows with 300,000 rows should take over 20 minutes. In case you were wondering, one CPU core was pegged at 100% for the entire execution. The explanation for this poor performance and extreme resource usage builds on some ideas we explored earlier:
We already know, for example, that despite the parallel execution icons, all rows from T2 end up on the same thread. As a reminder, the row-mode parallel hash join requires repartitioning on the join columns (c1). All rows from T2 have the same value – null – in column c1, so all rows end up on the same thread. Similarly, all rows from T1 that pass the bitmap filter also have null in column c1, so they also repartition to the same thread. This explains why a single core does all the work.
It might still seem unreasonable that hash joining 32,000 rows with 300,000 rows should take 20 minutes, especially since the join columns on both sides are null, and will not join anyway. To understand this, we need to think about how this hash join works.
The build input (the 32,000 rows) creates a hash table using the join column, c1. Since every build-side row contains the same value (null) for join column c1, this means all 32,000 rows end up in the same hash bucket. When the hash join switches to probing for matches, each probe-side row with a null c1 column also hashes to the same bucket. The hash join must then check all 32,000 entries in that bucket for a match.
Checking the 300,000 probe rows results in 32,000 comparisons being made 300,000 times. This is the worst case for a hash join: All build side rows hash to the same bucket, resulting in what is essentially a Cartesian product. This explains the long execution time and constant 100% processor utilization as the hash follows the long hash bucket chain.
This poor performance helps explain why the post-optimization rewrite to eliminate nulls on the build input to a hash join exists. It is unfortunate that the Filter was not applied in this case.
Workarounds
The optimizer chooses this plan shape because it incorrectly estimates that the optimized bitmap will filter out all the rows from table T1. Though this estimate is shown at the Repartition Streams instead of the Clustered Index Scan, this is still the basis of the decision. As a reminder here is the relevant section of the pre-execution plan again:
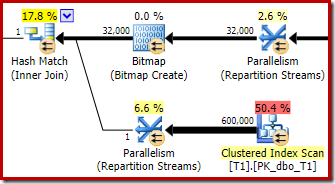
If this were a correct estimate, it would take no time at all to process the hash join. It is unfortunate that the selectivity estimate for the optimized bitmap is so very wrong when the data type is not a simple integer or bigint. It seems a bitmap built on an integer or bigint key is also able to filter out null rows that cannot join. If this is indeed the case, this is a major reason to prefer integer or bigint join columns.
The workarounds that follow are largely based on the idea of eliminating the problematic optimized bitmaps.
Serial Execution
One way to prevent optimized bitmaps being considered is to require a non-parallel plan. Row-mode Bitmap operators (optimized or otherwise) are only seen in parallel plans:
SELECT T1.pk
FROM
(
    dbo.T2 AS T2
    JOIN dbo.T2 AS T3
	ON T3.pk = T2.pk
)
JOIN dbo.T1 AS T1
    ON T1.c1 = T2.c1
OPTION (MAXDOP 1, FORCE ORDER);
That query is expressed using slightly different syntax with a FORCE ORDER hint to generate a plan shape that is more easily comparable with the previous parallel plans. The essential feature is the MAXDOP 1 hint.
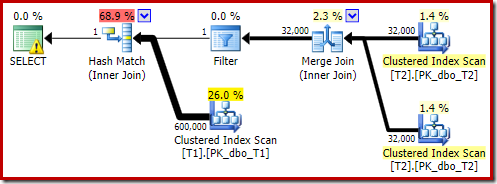
That estimated plan shows the post-optimization rewrite Filter being reinstated:
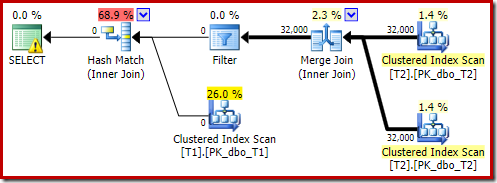
The post-execution version of the plan shows that it filters out all rows from the build input, meaning the probe side scan can be skipped altogether:
As you would expect, this version of the query executes very quickly – about 20ms on average for me. We can achieve a similar effect without the FORCE ORDER hint and query rewrite:
SELECT T1.pk
FROM dbo.T1 AS T1
JOIN dbo.T2 AS T2
	ON T2.c1 = T1.c1
JOIN dbo.T2 AS T3
	ON T3.pk = T2.pk
OPTION (MAXDOP 1);
The optimizer chooses a different plan shape in this case, with the Filter placed directly above the scan of T2:
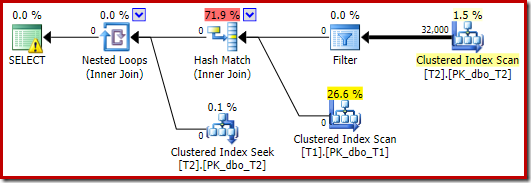
This executes even faster – in about 10ms – as one would expect. Naturally, this would not be a good choice if the number of rows present (and joinable) were much larger.
Turning Off Optimized Bitmaps
There is no query hint to turn off optimized bitmaps, but we can achieve the same effect using a couple of undocumented trace flags. As always, this is just for interest value; you would not want to ever use these in a real system or application:
SELECT T1.pk
FROM dbo.T1 AS T1
JOIN dbo.T2 AS T2
	ON T2.c1 = T1.c1
JOIN dbo.T2 AS T3
	ON T3.pk = T2.pk
OPTION (QUERYTRACEON 7497, QUERYTRACEON 7498);
The resulting execution plan is:

The Bitmap there is a post-optimization rewrite bitmap, not an optimized bitmap:
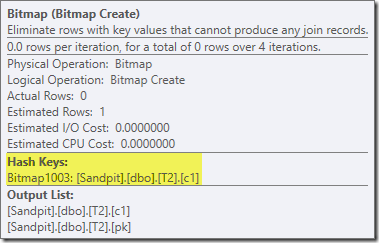
Note the zero cost estimates and Bitmap name (rather than Opt_Bitmap). without an optimized bitmap to skew the cost estimates, the post-optimization rewrite to include a null-rejecting Filter is activated. This execution plan runs in about 70ms.
The same execution plan (with Filter and non-optimized Bitmap) can also be produced by disabling the optimizer rule responsible for generating star join bitmap plans (again, strictly undocumented and not for real-world use):
SELECT T1.pk
FROM dbo.T1 AS T1
JOIN dbo.T2 AS T2
	ON T2.c1 = T1.c1
JOIN dbo.T2 AS T3
	ON T3.pk = T2.pk
OPTION (QUERYRULEOFF StarJoinToHashJoinsWithBitmap);

Including an explicit filter
This is the simplest option, but one would only think to do it if aware of the issues discussed so far. Now that we know we need to eliminate nulls from T2.c1, we can add this to the query directly:
SELECT T1.pk
FROM dbo.T1 AS T1
JOIN dbo.T2 AS T2
	ON T2.c1 = T1.c1
JOIN dbo.T2 AS T3
	ON T3.pk = T2.pk
WHERE
    T2.c1 IS NOT NULL;  -- New!
The resulting estimated execution plan is perhaps not quite what you might be expecting:
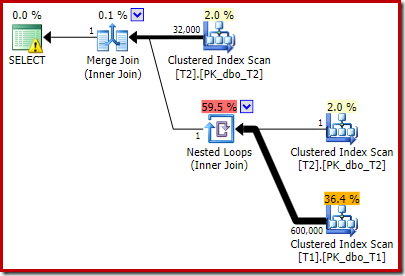
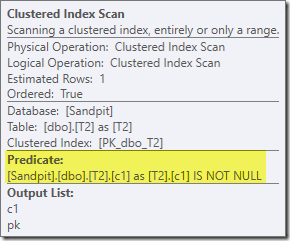
The extra predicate we added has been pushed into the middle Clustered Index Scan of T2:
The post-execution plan is:
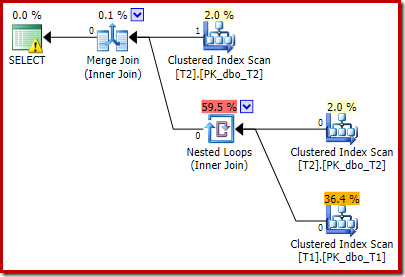
Notice that the Merge Join shuts down after reading one row from its top input, then failing to find a row on its lower input, due to the effect of the predicate we added. The Clustered Index Scan of table T1 is never executed at all, because the Nested Loops join never gets a row on its driving input. This final query form executes in one or two milliseconds.
Final thoughts
This article has covered a fair amount of ground to explore some less well-known query optimizer behaviours, and explain the reasons for extremely poor hash join performance in a specific case.
It might be tempting to ask why the optimizer does not routinely add null-rejecting filters prior to equality joins. One can only suppose that this would not be beneficial in enough common cases. Most joins are not expected to encounter many null = null rejections, and adding predicates routinely could quickly become counter-productive, particularly if many join columns are present. For most joins, rejecting nulls inside the join operator is probably a better option (from a cost model perspective) than introducing an explicit Filter.
It does seem that there is an effort to prevent the very worst cases from manifesting through the post-optimization rewrite designed to reject null join rows before they reach the build input of a hash join. It seems that an unfortunate interaction exists between the effect of optimized bitmap filters and the application of this rewrite. It is also unfortunate that when this performance problem does occur, it is very difficult to diagnose from the execution plan alone.
For now, the best option seems to be aware of this potential performance issue with hash joins on nullable columns, and to add explicit null-rejecting predicates (with a comment!) to ensure an efficient execution plan is produced, if necessary. Using a MAXDOP 1 hint may also reveal an alternative plan with the tell-tale Filter present.
As a general rule, queries that join on integer type columns and go looking for data that exists tend to fit the optimizer model and execution engine capabilities rather better than the alternatives.
Acknowledgements
I want to thank SQL_Sasquatch (@sqL_handLe) for his permission to respond to his original article with a technical analysis. The sample data used here is heavily based on that article.
I also want to thank Rob Farley (blog | twitter) for our technical discussions over the years, and especially one in January 2015 where we discussed the implications of extra null-rejecting predicates for equi-joins. Rob has written about related topics several times, including in Inverse Predicates – look both ways before you cross.


Yeah… except that I completely forgot about that particular conversation until you reminded me of it recently. :)
Interesting work, Paul. Now I'm wondering if I've seen something like this in production before without realising what was wrong.
One small quibble — is this supposed to say *seek* predicate: "and it has not been pushed down into the Clustered Index Scan as a residual predicate"?
Never mind, I see what you mean now and why it could not be a seek predicate (no suitable index).
Just a small matter, but your first example creates a table of one million, not 10 million records.
Well, that shows again, that integer based join columns should always be preferred. ;-)
Thanks, I have corrected that.
How long did the final explicit filter query take?
As an aside this is similar to some poor queries that i have seen recently that use NOT IN / NOT EXISTS and have been improved by using LOJ WHERE col is null filter. Though, yes, the performance is improved , the two are not logically the same, in that NULLS are treated differently. Although the data was never null the column was still nullable and by adding WHERE x IS NOT NULL to the NOT IN/EXISTS query the same plan is seen… Was going to throw a blog up on this, not sure if its worth it now :)
One or two milliseconds. I'll edit that into the post, thanks.
Hi Dave, yeah go on write about it :)
Hi Paul,
An excellent post, however could you provide the exact version of SQL Server you are using down to CU level and any trace flags you might have set which influence the optimizer (4199 etc), I've copied and pasted the SQL you have used to create your tests into management studio, for the query that is taking 20 minutes to run I get a completely different plan, I am using SQL 2016 CTP 3.3 and despite the fact I am 100% confident that you are not using this version, it would still be interesting to know which version you produced these tests against.
Chris
As usual, I validated the results on the latest builds (at the time of writing) of supported versions of SQL Server x64 Developer Edition, including 2016 CTP3.2 with no trace flags. It remains the same on 2016 RC3. It seems you were missing an update statistics command somehow in your test, as we discussed by email. Sorry for the late response – this notification got lost in my inbox.
Hello!
Did you get a chance to write up LEFT OUTER JOIN vs NOT EXISTS?
I got one :-)
Very similar to this example: the join columns are non-indexed NULLABLE NUMERIC(18,0) with very NULL value frequency, in a query with 3 tables. In the original example, left outer join completed in 2 seconds. Equivalent query with NOT EXISTS takes 2 hours, 49 minutes, 30 seconds.
I'll work on simplifying the tables and anonymizing the data, then post to my blog unless you've already worked womething up.
Lonny
Hey Lonny…
Nope i didnt get around to that one, feel free to go for it. If i havent got around to it by now, the odd are unlikely that it will be done in the near future :)
Its interesting – I first saw the issue with NULL-able nonindexed NUMERIC(18,0) columns with lots of NULLs. Changed data type to BIGINT – still a problem. Coalesced NULL to -1. Still a problem. And MAXDOP 1 doesn't help. So it has less in common with the subject of this particular blog post than I thought at first.
But that also means the issue is potentially more widespread.
I've yet to reproduce the issue with the new CE, so far only with Legacy CE.
Aha! I take it back :-) Somehow, Legacy CE has bad performance whether NULL or -1 is the popular value. New CE handles -1 as popular value well, but struggles with NULL as popular value. Time to simplify my dataset so I can write all of this up in a blog post. :-)
"In a row-mode parallel plan, SQL Server achieves this by repartitioning both inputs using the same hash function on the join columns"
Paul,
Would you happen to know what hashing algorithm/function is being used for this purpose? Is its output reproducible via TSQL (e.g. HASHBYTES) ?
The reason I am asking is that I would like to know in advance whether to expect a considerable skew in a parallel hash join plan, before actually running the statement.
Thanks much.
Would the same trap exist in large data sets where a numeric or money field is compared in the merging of the data? Somewhat unrelated, do you know which hashing algorithm the query engine uses to create the hashtable, i.e. Is it md5, sha1, sha2 or some proprietary flavour of these?
I am asking because I work in BI systems where we use a lot of hashes to represent a combination of primary key attributes and also value attributes to logically merge data together and I am still trying to work out which hashing algo will be optimal going forward, my suspicion is that sha256 is specifically turbo boosted for the query engine and will end up being more efficient than the deprecated algos (md5, sha1) going forward.
Another sneaking suspicion I get is that joining on the key attributes and non key values would be more optimal but the trap you explained here could easily be fallen into.