The SQLskills team loves wait statistics. If you look through posts on this blog (see Paul’s posts on Knee-Jerk Wait Statistics) and on the SQLskills site, you’ll see posts from all of us discussing the value of wait stats, what we look for, and why a particular wait is an issue. Paul writes about this the most, but all of us typically start with wait statistics when troubleshooting a performance issue. What does that mean in terms of being proactive?
In order to get a complete picture of what wait statistics mean during a performance issue, you must know what your normal waits are. That means proactively capturing this information and using that baseline as a reference. If you do not have this data, then when a performance issue occurs, you won’t know if PAGELATCH waits are typical in your environment (quite possible) or if you suddenly have an issue related to tempdb due to some new code that was added.
The Wait Statistics Data
I’ve previously published a script I use to capture wait statistics, and it’s a script I’ve been using for a long time for clients. However, I’ve recently made changes to my script and slightly tweaked my method. Let me explain why…
The fundamental premise behind wait statistics is that SQL Server is tracking every time a thread has to wait for “something.” Waiting to read a page from disk? PAGEIOLATCH_XX wait. Waiting to be granted a lock so you make a modification to data? LCX_M_XXX wait. Waiting for a memory grant so a query can execute? RESOURCE_SEMAPHORE wait. All these waits are tracked in the sys.dm_os_wait_stats DMV, and the data just accrues over time… it’s a cumulative representative of the waits.
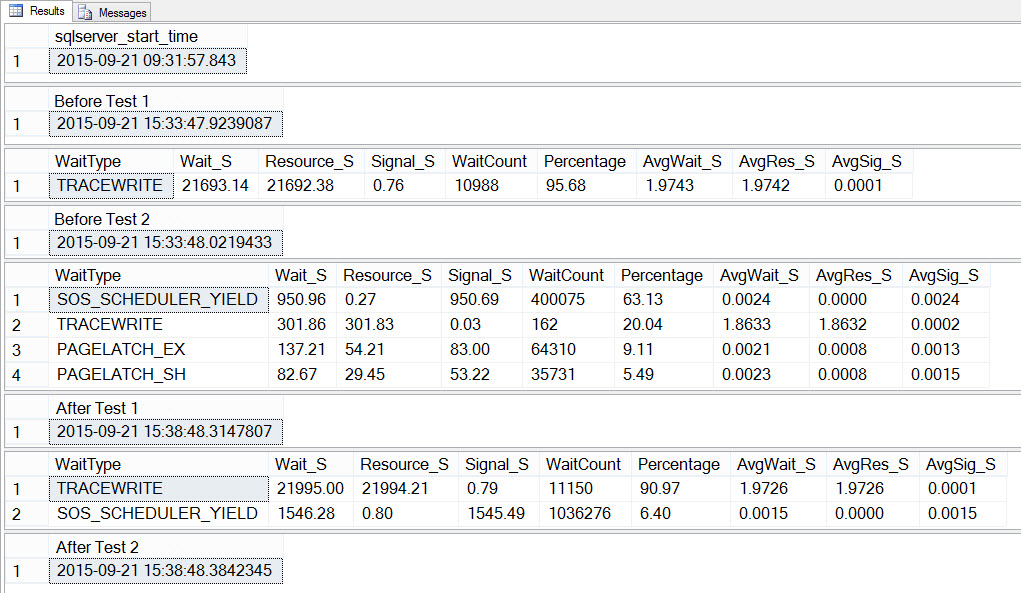
For example, I have a SQL Server 2014 instance in one of my VMs that’s been up and since about 9:30 this morning:
SELECT [sqlserver_start_time] FROM [sys].[dm_os_sys_info];
Now if I look to see what my wait statistics look like (remember, cumulative until now) using Paul’s script, I see that TRACEWRITE is my current “standard” wait:
Ok, now let’s introduce five minutes of tempdb contention, and see how that affects my overall wait statistics. I have a script that Jonathan has used previously to create tempdb contention, and I’ve set it up so that it will run for 5 minutes:
USE AdventureWorks2012;
GO

SET NOCOUNT ON;
GO

DECLARE @CurrentTime SMALLDATETIME = SYSDATETIME(), @EndTime SMALLDATETIME = DATEADD(MINUTE, 5, SYSDATETIME());
WHILE @CurrentTime < @EndTime
BEGIN
  IF OBJECT_ID('tempdb..#temp') IS NOT NULL
  BEGIN
    DROP TABLE #temp;
  END

  CREATE TABLE #temp
  (
    ProductID INT PRIMARY KEY,
    OrderQty INT,
    TotalDiscount MONEY,
    LineTotal MONEY,
    Filler NCHAR(500) DEFAULT(N'') NOT NULL
  );

  INSERT INTO #temp(ProductID, OrderQty, TotalDiscount, LineTotal)
  SELECT
    sod.ProductID,
    SUM(sod.OrderQty),
    SUM(sod.LineTotal),
    SUM(sod.OrderQty + sod.UnitPriceDiscount)
  FROM Sales.SalesOrderDetail AS sod
  GROUP BY ProductID;

  DECLARE
    @ProductNumber NVARCHAR(25),
    @Name NVARCHAR(50),
    @TotalQty INT,
    @SalesTotal MONEY,
    @TotalDiscount MONEY;

  SELECT
    @ProductNumber = p.ProductNumber,
    @Name = p.Name,
    @TotalQty = t1.OrderQty,
    @SalesTotal = t1.LineTotal,
    @TotalDiscount = t1.TotalDiscount
  FROM Production.Product AS p
  JOIN #temp AS t1 ON p.ProductID = t1.ProductID;

  SET @CurrentTime = SYSDATETIME()
END
I used a command prompt to start up 10 sessions that ran this script, and concurrently ran a script that captured my overall wait statistics, a snapshot of the waits over a 5 minute time period, and then the overall wait statistics again. First, a little secret, since we ignore benign waits all the time, it can be useful to stuff them in a table so that you can reference an object instead of constantly having to hard-code a list of exclusion strings in a query. So:
USE SQLskills_WaitStats;
GO

CREATE TABLE dbo.WaitsToIgnore(WaitType SYSNAME PRIMARY KEY);

INSERT dbo.WaitsToIgnore(WaitType) VALUES(N'BROKER_EVENTHANDLER'),
  (N'BROKER_RECEIVE_WAITFOR'), (N'BROKER_TASK_STOP'), (N'BROKER_TO_FLUSH'),
  (N'BROKER_TRANSMITTER'),     (N'CHECKPOINT_QUEUE'), (N'CHKPT'),
  (N'CLR_AUTO_EVENT'),         (N'CLR_MANUAL_EVENT'), (N'CLR_SEMAPHORE'),
  (N'DBMIRROR_DBM_EVENT'),     (N'DBMIRROR_EVENTS_QUEUE'),
  (N'DBMIRROR_WORKER_QUEUE'),  (N'DBMIRRORING_CMD'),  (N'DIRTY_PAGE_POLL'),
  (N'DISPATCHER_QUEUE_SEMAPHORE'),  (N'EXECSYNC'),    (N'FSAGENT'),
  (N'FT_IFTS_SCHEDULER_IDLE_WAIT'), (N'FT_IFTSHC_MUTEX'), (N'HADR_CLUSAPI_CALL'),
  (N'HADR_FILESTREAM_IOMGR_IOCOMPLETIO(N'), (N'HADR_LOGCAPTURE_WAIT'),
  (N'HADR_NOTIFICATION_DEQUEUE'), (N'HADR_TIMER_TASK'), (N'HADR_WORK_QUEUE'),
  (N'KSOURCE_WAKEUP'),         (N'LAZYWRITER_SLEEP'),   (N'LOGMGR_QUEUE'),
  (N'ONDEMAND_TASK_QUEUE'),    (N'PWAIT_ALL_COMPONENTS_INITIALIZED'),
  (N'QDS_PERSIST_TASK_MAIN_LOOP_SLEEP'),
  (N'QDS_CLEANUP_STALE_QUERIES_TASK_MAIN_LOOP_SLEEP'),
  (N'REQUEST_FOR_DEADLOCK_SEARCH'), (N'RESOURCE_QUEUE'), (N'SERVER_IDLE_CHECK'),
  (N'SLEEP_BPOOL_FLUSH'),   (N'SLEEP_DBSTARTUP'), (N'SLEEP_DCOMSTARTUP'),
  (N'SLEEP_MASTERDBREADY'), (N'SLEEP_MASTERMDREADY'), (N'SLEEP_MASTERUPGRADED'),
  (N'SLEEP_MSDBSTARTUP'),   (N'SLEEP_SYSTEMTASK'),    (N'SLEEP_TASK'),
  (N'SLEEP_TEMPDBSTARTUP'), (N'SNI_HTTP_ACCEPT'), (N'SP_SERVER_DIAGNOSTICS_SLEEP'),
  (N'SQLTRACE_BUFFER_FLUSH'), (N'SQLTRACE_INCREMENTAL_FLUSH_SLEEP'),
  (N'SQLTRACE_WAIT_ENTRIES'), (N'WAIT_FOR_RESULTS'), (N'WAITFOR'),
  (N'WAITFOR_TASKSHUTDOW(N'), (N'WAIT_XTP_HOST_WAIT'),
  (N'WAIT_XTP_OFFLINE_CKPT_NEW_LOG'), (N'WAIT_XTP_CKPT_CLOSE'),
  (N'XE_DISPATCHER_JOIN'), (N'XE_DISPATCHER_WAIT'), (N'XE_TIMER_EVENT');
Now we're ready to capture our waits:
/* Capture the instance start time

(in this case, time since waits have been accumulating) */

SELECT [sqlserver_start_time] FROM [sys].[dm_os_sys_info];
GO

/* Get the current time */

SELECT SYSDATETIME() AS [Before Test 1];

/* Get aggregate waits until now */

WITH [Waits] AS
(
  SELECT
    [wait_type],
    [wait_time_ms] / 1000.0 AS [WaitS],
    ([wait_time_ms] - [signal_wait_time_ms]) / 1000.0 AS [ResourceS],
    [signal_wait_time_ms] / 1000.0 AS [SignalS],
    [waiting_tasks_count] AS [WaitCount],
    100.0 * [wait_time_ms] / SUM ([wait_time_ms]) OVER() AS [Percentage],
    ROW_NUMBER() OVER(ORDER BY [wait_time_ms] DESC) AS [RowNum]
  FROM sys.dm_os_wait_stats
  WHERE [wait_type] NOT IN (SELECT WaitType FROM SQLskills_Waits.WaitsToIgnore)
  AND [waiting_tasks_count] > 0
)
SELECT
  MAX ([W1].[wait_type]) AS [WaitType],
  CAST (MAX ([W1].[WaitS]) AS DECIMAL (16,2)) AS [Wait_S],
  CAST (MAX ([W1].[ResourceS]) AS DECIMAL (16,2)) AS [Resource_S],
  CAST (MAX ([W1].[SignalS]) AS DECIMAL (16,2)) AS [Signal_S],
  MAX ([W1].[WaitCount]) AS [WaitCount],
  CAST (MAX ([W1].[Percentage]) AS DECIMAL (5,2)) AS [Percentage],
  CAST ((MAX ([W1].[WaitS]) / MAX ([W1].[WaitCount])) AS DECIMAL (16,4)) AS [AvgWait_S],
  CAST ((MAX ([W1].[ResourceS]) / MAX ([W1].[WaitCount])) AS DECIMAL (16,4)) AS [AvgRes_S],
  CAST ((MAX ([W1].[SignalS]) / MAX ([W1].[WaitCount])) AS DECIMAL (16,4)) AS [AvgSig_S]
FROM [Waits] AS [W1]
INNER JOIN [Waits] AS [W2]
ON [W2].[RowNum] <= [W1].[RowNum]
GROUP BY [W1].[RowNum]
HAVING SUM ([W2].[Percentage]) - MAX ([W1].[Percentage]) < 95; -- percentage threshold
GO

/* Get the current time */

SELECT SYSDATETIME() AS [Before Test 2];

/* Capture a snapshot of waits over a 5 minute period */

IF EXISTS (SELECT * FROM [tempdb].[sys].[objects] WHERE [name] = N'##SQLskillsStats1')
  DROP TABLE [##SQLskillsStats1];

IF EXISTS (SELECT * FROM [tempdb].[sys].[objects] WHERE [name] = N'##SQLskillsStats2')
  DROP TABLE [##SQLskillsStats2];
GO

SELECT [wait_type], [waiting_tasks_count], [wait_time_ms],
  [max_wait_time_ms], [signal_wait_time_ms]
INTO ##SQLskillsStats1
FROM sys.dm_os_wait_stats;
GO

WAITFOR DELAY '00:05:00';
GO

SELECT [wait_type], [waiting_tasks_count], [wait_time_ms],
  [max_wait_time_ms], [signal_wait_time_ms]
INTO ##SQLskillsStats2
FROM sys.dm_os_wait_stats;
GO

WITH [DiffWaits] AS
(
  SELECT    -- Waits that weren't in the first snapshot
      [ts2].[wait_type],
      [ts2].[wait_time_ms],
      [ts2].[signal_wait_time_ms],
      [ts2].[waiting_tasks_count]
    FROM [##SQLskillsStats2] AS [ts2]
    LEFT OUTER JOIN [##SQLskillsStats1] AS [ts1]
    ON [ts2].[wait_type] = [ts1].[wait_type]
    WHERE [ts1].[wait_type] IS NULL
    AND [ts2].[wait_time_ms] > 0
  UNION
  SELECT    -- Diff of waits in both snapshots
      [ts2].[wait_type],
      [ts2].[wait_time_ms] - [ts1].[wait_time_ms] AS [wait_time_ms],
      [ts2].[signal_wait_time_ms] - [ts1].[signal_wait_time_ms] AS [signal_wait_time_ms],
      [ts2].[waiting_tasks_count] - [ts1].[waiting_tasks_count] AS [waiting_tasks_count]
    FROM [##SQLskillsStats2] AS [ts2]
    LEFT OUTER JOIN [##SQLskillsStats1] AS [ts1]
    ON [ts2].[wait_type] = [ts1].[wait_type]
    WHERE [ts1].[wait_type] IS NOT NULL
    AND [ts2].[waiting_tasks_count] - [ts1].[waiting_tasks_count] > 0
    AND [ts2].[wait_time_ms] - [ts1].[wait_time_ms] > 0
),
[Waits] AS
(
  SELECT
    [wait_type],
    [wait_time_ms] / 1000.0 AS [WaitS],
    ([wait_time_ms] - [signal_wait_time_ms]) / 1000.0 AS [ResourceS],
    [signal_wait_time_ms] / 1000.0 AS [SignalS],
    [waiting_tasks_count] AS [WaitCount],
    100.0 * [wait_time_ms] / SUM ([wait_time_ms]) OVER() AS [Percentage],
    ROW_NUMBER() OVER(ORDER BY [wait_time_ms] DESC) AS [RowNum]
  FROM [DiffWaits]
  WHERE [wait_type] NOT IN (SELECT WaitType FROM SQLskills_WaitStats.dbo.WaitsToIgnore)
)
SELECT
  [W1].[wait_type] AS [WaitType],
  CAST ([W1].[WaitS] AS DECIMAL (16, 2)) AS [Wait_S],
  CAST ([W1].[ResourceS] AS DECIMAL (16, 2)) AS [Resource_S],
  CAST ([W1].[SignalS] AS DECIMAL (16, 2)) AS [Signal_S],
  [W1].[WaitCount] AS [WaitCount],
  CAST ([W1].[Percentage] AS DECIMAL (5, 2)) AS [Percentage],
  CAST (([W1].[WaitS] / [W1].[WaitCount]) AS DECIMAL (16, 4)) AS [AvgWait_S],
  CAST (([W1].[ResourceS] / [W1].[WaitCount]) AS DECIMAL (16, 4)) AS [AvgRes_S],
  CAST (([W1].[SignalS] / [W1].[WaitCount]) AS DECIMAL (16, 4)) AS [AvgSig_S]
FROM [Waits] AS [W1]
INNER JOIN [Waits] AS [W2]
ON [W2].[RowNum] <= [W1].[RowNum]
GROUP BY [W1].[RowNum], [W1].[wait_type], [W1].[WaitS],
  [W1].[ResourceS], [W1].[SignalS], [W1].[WaitCount], [W1].[Percentage]
HAVING SUM ([W2].[Percentage]) - [W1].[Percentage] < 95; -- percentage threshold
GO

-- Cleanup

IF EXISTS (SELECT * FROM [tempdb].[sys].[objects] WHERE [name] = N'##SQLskillsStats1')
  DROP TABLE [##SQLskillsStats1];

IF EXISTS (SELECT * FROM [tempdb].[sys].[objects] WHERE [name] = N'##SQLskillsStats2')
  DROP TABLE [##SQLskillsStats2];
GO

/* Get the current time */

SELECT SYSDATETIME() AS [After Test 1];

/* Get aggregate waits again */

WITH [Waits] AS
(
  SELECT
    [wait_type],
    [wait_time_ms] / 1000.0 AS [WaitS],
    ([wait_time_ms] - [signal_wait_time_ms]) / 1000.0 AS [ResourceS],
    [signal_wait_time_ms] / 1000.0 AS [SignalS],
    [waiting_tasks_count] AS [WaitCount],
    100.0 * [wait_time_ms] / SUM ([wait_time_ms]) OVER() AS [Percentage],
    ROW_NUMBER() OVER(ORDER BY [wait_time_ms] DESC) AS [RowNum]
  FROM sys.dm_os_wait_stats
  WHERE [wait_type] NOT IN (SELECT WaitType FROM SQLskills_WaitStats.dbo.WaitsToIgnore)
  AND [waiting_tasks_count] > 0
)
SELECT
  MAX ([W1].[wait_type]) AS [WaitType],
  CAST (MAX ([W1].[WaitS]) AS DECIMAL (16,2)) AS [Wait_S],
  CAST (MAX ([W1].[ResourceS]) AS DECIMAL (16,2)) AS [Resource_S],
  CAST (MAX ([W1].[SignalS]) AS DECIMAL (16,2)) AS [Signal_S],
  MAX ([W1].[WaitCount]) AS [WaitCount],
  CAST (MAX ([W1].[Percentage]) AS DECIMAL (5,2)) AS [Percentage],
  CAST ((MAX ([W1].[WaitS]) / MAX ([W1].[WaitCount])) AS DECIMAL (16,4)) AS [AvgWait_S],
  CAST ((MAX ([W1].[ResourceS]) / MAX ([W1].[WaitCount])) AS DECIMAL (16,4)) AS [AvgRes_S],
  CAST ((MAX ([W1].[SignalS]) / MAX ([W1].[WaitCount])) AS DECIMAL (16,4)) AS [AvgSig_S]
FROM [Waits] AS [W1]
INNER JOIN [Waits] AS [W2]
ON [W2].[RowNum] <= [W1].[RowNum]
GROUP BY [W1].[RowNum]
HAVING SUM ([W2].[Percentage]) - MAX ([W1].[Percentage]) < 95; -- percentage threshold
GO

/* Get the current time */

SELECT SYSDATETIME() AS [After Test 2];
If we look at the output, we can see that while the 10 instances of the script to create tempdb contention were running, SOS_SCHEDULER_YIELD was our most prevalent wait type, and we also had PAGELATCH_XX waits, as expected:

If we look at the average waits AFTER the test completed, we again see TRACEWRITE as the highest wait, and we do see SOS_SCHEDULER_YIELD as a wait. Depending on what else is running in the environment, this wait may or may not persist in our top waits for long, and it may or may not bubble up as a wait type to investigate.
Proactively Capturing Wait Statistics
By default, wait statistics are cumulative. Yes, you can clear them at any time using DBCC SQLPERF, but I find that most people do not do that on a regular basis, they just let them accumulate. And this is fine, but understand how that affects your data. If you only restart your instance when you patch it, or when there’s an issue (which hopefully happens infrequently), then that data could be accumulating for months. The more data you have, the harder it is to see small variations… things that could be performance problems. Even when you have a “big issue” that’s affecting your entire server for several minutes, as we did here with tempdb, it may not create enough of a change in your data to get detected in the cumulated data. Rather, you need to snapshot the data (capture it, wait a few minutes, capture it again, and then diff the data) to see what’s really going on right now.
As such, if you just snapshot wait statistics every few hours, then the data you’ve collected just shows the continued aggregation over time. You can diff those snapshots to get an understanding of performance between the snapshots, but I can tell you from having to write this code against a large data set, it’s a pain (but I’m not a dev, so maybe it’s easy-peasy for you).
My traditional method of capturing wait statistics was to just snapshot sys.dm_os_wait_stats every few hours using Paul’s original script:
USE [BaselineData];
GO

IF NOT EXISTS (SELECT * FROM [sys].[tables] WHERE [name] = N'SQLskills_WaitStats_OldMethod')
BEGIN
  CREATE TABLE [dbo].[SQLskills_WaitStats_OldMethod]
  (
    [RowNum] [bigint] IDENTITY(1,1) NOT NULL,
    [CaptureDate] [datetime] NULL,
    [WaitType] [nvarchar](120) NULL,
    [Wait_S] [decimal](14, 2) NULL,
    [Resource_S] [decimal](14, 2) NULL,
    [Signal_S] [decimal](14, 2) NULL,
    [WaitCount] [bigint] NULL,
    [Percentage] [decimal](4, 2) NULL,
    [AvgWait_S] [decimal](14, 4) NULL,
    [AvgRes_S] [decimal](14, 4) NULL,
    [AvgSig_S] [decimal](14, 4) NULL
  );

  CREATE CLUSTERED INDEX [CI_SQLskills_WaitStats_OldMethod]
    ON [dbo].[SQLskills_WaitStats_OldMethod] ([CaptureDate],[RowNum]);
END
GO

/* Query to use in scheduled job */

USE [BaselineData];
GO

INSERT INTO [dbo].[SQLskills_WaitStats_OldMethod]
(
  [CaptureDate] ,
  [WaitType] ,
  [Wait_S] ,
  [Resource_S] ,
  [Signal_S] ,
  [WaitCount] ,
  [Percentage] ,
  [AvgWait_S] ,
  [AvgRes_S] ,
  [AvgSig_S]
)
EXEC ('WITH [Waits] AS (SELECT
      [wait_type],
      [wait_time_ms] / 1000.0 AS [WaitS],
      ([wait_time_ms] - [signal_wait_time_ms]) / 1000.0 AS [ResourceS],
      [signal_wait_time_ms] / 1000.0 AS [SignalS],
      [waiting_tasks_count] AS [WaitCount],
      100.0 * [wait_time_ms] / SUM ([wait_time_ms]) OVER() AS [Percentage],
      ROW_NUMBER() OVER(ORDER BY [wait_time_ms] DESC) AS [RowNum]
    FROM sys.dm_os_wait_stats
    WHERE [wait_type] NOT IN (SELECT WaitType FROM SQLskills_WaitStats.dbo.WaitsToIgnore)
  )
  SELECT
    GETDATE(),
    [W1].[wait_type] AS [WaitType],
    CAST ([W1].[WaitS] AS DECIMAL(14, 2)) AS [Wait_S],
    CAST ([W1].[ResourceS] AS DECIMAL(14, 2)) AS [Resource_S],
    CAST ([W1].[SignalS] AS DECIMAL(14, 2)) AS [Signal_S],
    [W1].[WaitCount] AS [WaitCount],
    CAST ([W1].[Percentage] AS DECIMAL(4, 2)) AS [Percentage],
    CAST (([W1].[WaitS] / [W1].[WaitCount]) AS DECIMAL (14, 4)) AS [AvgWait_S],
    CAST (([W1].[ResourceS] / [W1].[WaitCount]) AS DECIMAL (14, 4)) AS [AvgRes_S],
    CAST (([W1].[SignalS] / [W1].[WaitCount]) AS DECIMAL (14, 4)) AS [AvgSig_S]
  FROM [Waits] AS [W1]
  INNER JOIN [Waits] AS [W2]
  ON [W2].[RowNum] <= [W1].[RowNum]
  GROUP BY [W1].[RowNum], [W1].[wait_type], [W1].[WaitS], [W1].[ResourceS],
    [W1].[SignalS], [W1].[WaitCount], [W1].[Percentage]
  HAVING SUM ([W2].[Percentage]) - [W1].[Percentage] < 95;'
);
I would then go through and look at the top wait for each snapshot, for example:
SELECT [w].[CaptureDate] ,
  [w].[WaitType] ,
  [w].[Percentage] ,
  [w].[Wait_S] ,
  [w].[WaitCount] ,
  [w].[AvgWait_S]
FROM   [dbo].[SQLskills_WaitStats_OldMethod] w
JOIN
(
  SELECT   MIN([RowNum]) AS [RowNumber] , [CaptureDate]
  FROM     [dbo].[SQLskills_WaitStats_OldMethod]
  WHERE   [CaptureDate] IS NOT NULL
  AND [CaptureDate] > GETDATE() - 60
  GROUP BY [CaptureDate]
) m ON [w].[RowNum] = [m].[RowNumber]
ORDER BY [w].[CaptureDate];
My new, alternate method is to diff a couple snapshots of wait statistics (with a two to three minutes between snapshots) every hour or so. This information then tells me exactly what the system was waiting on at that time:
USE [BaselineData];
GO

IF NOT EXISTS ( SELECT * FROM   [sys].[tables] WHERE   [name] = N'SQLskills_WaitStats')
BEGIN
  CREATE TABLE [dbo].[SQLskills_WaitStats]
  (
    [RowNum] [bigint] IDENTITY(1,1) NOT NULL,
    [CaptureDate] [datetime] NOT NULL DEFAULT (sysdatetime()),
    [WaitType] [nvarchar](60) NOT NULL,
    [Wait_S] [decimal](16, 2) NULL,
    [Resource_S] [decimal](16, 2) NULL,
    [Signal_S] [decimal](16, 2) NULL,
    [WaitCount] [bigint] NULL,
    [Percentage] [decimal](5, 2) NULL,
    [AvgWait_S] [decimal](16, 4) NULL,
    [AvgRes_S] [decimal](16, 4) NULL,
    [AvgSig_S] [decimal](16, 4) NULL
  ) ON [PRIMARY];

  CREATE CLUSTERED INDEX [CI_SQLskills_WaitStats]
    ON [dbo].[SQLskills_WaitStats] ([CaptureDate],[RowNum]);
END

/* Query to use in scheduled job */

USE [BaselineData];
GO

IF EXISTS (SELECT * FROM [tempdb].[sys].[objects] WHERE [name] = N'##SQLskillsStats1')
  DROP TABLE [##SQLskillsStats1];

IF EXISTS (SELECT * FROM [tempdb].[sys].[objects] WHERE [name] = N'##SQLskillsStats2')
  DROP TABLE [##SQLskillsStats2];
GO

/* Capture wait stats */

SELECT [wait_type], [waiting_tasks_count], [wait_time_ms],
  [max_wait_time_ms], [signal_wait_time_ms]
INTO ##SQLskillsStats1
FROM sys.dm_os_wait_stats;
GO

/* Wait some amount of time */

WAITFOR DELAY '00:02:00';
GO

/* Capture wait stats again */

SELECT [wait_type], [waiting_tasks_count], [wait_time_ms],
  [max_wait_time_ms], [signal_wait_time_ms]
INTO ##SQLskillsStats2
FROM sys.dm_os_wait_stats;
GO

/* Diff the waits */

WITH [DiffWaits] AS
(
  SELECT   -- Waits that weren't in the first snapshot
      [ts2].[wait_type],
      [ts2].[wait_time_ms],
      [ts2].[signal_wait_time_ms],
      [ts2].[waiting_tasks_count]
    FROM [##SQLskillsStats2] AS [ts2]
    LEFT OUTER JOIN [##SQLskillsStats1] AS [ts1]
    ON [ts2].[wait_type] = [ts1].[wait_type]
    WHERE [ts1].[wait_type] IS NULL
    AND [ts2].[wait_time_ms] > 0
  UNION
  SELECT   -- Diff of waits in both snapshots
      [ts2].[wait_type],
      [ts2].[wait_time_ms] - [ts1].[wait_time_ms] AS [wait_time_ms],
      [ts2].[signal_wait_time_ms] - [ts1].[signal_wait_time_ms] AS [signal_wait_time_ms],
      [ts2].[waiting_tasks_count] - [ts1].[waiting_tasks_count] AS [waiting_tasks_count]
    FROM [##SQLskillsStats2] AS [ts2]
    LEFT OUTER JOIN [##SQLskillsStats1] AS [ts1]
    ON [ts2].[wait_type] = [ts1].[wait_type]
    WHERE [ts1].[wait_type] IS NOT NULL
    AND [ts2].[waiting_tasks_count] - [ts1].[waiting_tasks_count] > 0
    AND [ts2].[wait_time_ms] - [ts1].[wait_time_ms] > 0
),
[Waits] AS
(
  SELECT
    [wait_type],
    [wait_time_ms] / 1000.0 AS [WaitS],
    ([wait_time_ms] - [signal_wait_time_ms]) / 1000.0 AS [ResourceS],
    [signal_wait_time_ms] / 1000.0 AS [SignalS],
    [waiting_tasks_count] AS [WaitCount],
    100.0 * [wait_time_ms] / SUM ([wait_time_ms]) OVER() AS [Percentage],
    ROW_NUMBER() OVER(ORDER BY [wait_time_ms] DESC) AS [RowNum]
  FROM [DiffWaits]
  WHERE [wait_type] NOT IN (SELECT WaitType FROM SQLskills_WaitStats.dbo.WaitsToIgnore)
)
INSERT INTO [BaselineData].[dbo].[SQLskills_WaitStats]
(
  [WaitType] ,
  [Wait_S] ,
  [Resource_S] ,
  [Signal_S] ,
  [WaitCount] ,
  [Percentage] ,
  [AvgWait_S] ,
  [AvgRes_S] ,
  [AvgSig_S]
)
SELECT
  [W1].[wait_type],
  CAST ([W1].[WaitS] AS DECIMAL (16, 2)) ,
  CAST ([W1].[ResourceS] AS DECIMAL (16, 2)) ,
  CAST ([W1].[SignalS] AS DECIMAL (16, 2)) ,
  [W1].[WaitCount] ,
  CAST ([W1].[Percentage] AS DECIMAL (5, 2)) ,
  CAST (([W1].[WaitS] / [W1].[WaitCount]) AS DECIMAL (16, 4)) ,
  CAST (([W1].[ResourceS] / [W1].[WaitCount]) AS DECIMAL (16, 4)) ,
  CAST (([W1].[SignalS] / [W1].[WaitCount]) AS DECIMAL (16, 4))
FROM [Waits] AS [W1]
INNER JOIN [Waits] AS [W2]
ON [W2].[RowNum] <= [W1].[RowNum]
GROUP BY [W1].[RowNum], [W1].[wait_type], [W1].[WaitS], [W1].[ResourceS],
  [W1].[SignalS], [W1].[WaitCount], [W1].[Percentage]
HAVING SUM ([W2].[Percentage]) - [W1].[Percentage] < 95; -- percentage threshold
GO

/* Clean up the temp tables */

IF EXISTS (SELECT * FROM [tempdb].[sys].[objects] WHERE [name] = N'##SQLskillsStats1')
  DROP TABLE [##SQLskillsStats1];

IF EXISTS (SELECT * FROM [tempdb].[sys].[objects] WHERE [name] = N'##SQLskillsStats2')
  DROP TABLE [##SQLskillsStats2];
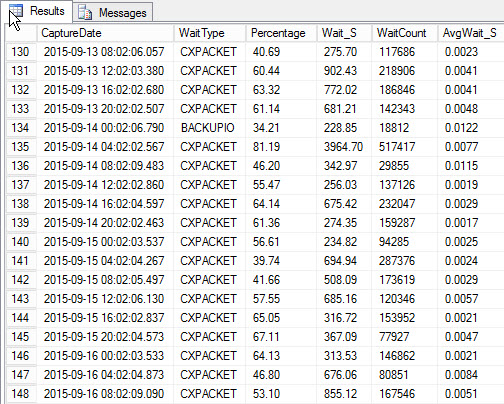
Is my new method better? I think so, as it’s a better representation of what the waits look like right at the time of capture, and it’s still sampling on a regular interval. For both methods, I usually look to see what the highest wait was at the time of capture:
SELECT [w].[CaptureDate] ,
  [w].[WaitType] ,
  [w].[Percentage] ,
  [w].[Wait_S] ,
  [w].[WaitCount] ,
  [w].[AvgWait_S]
FROM   [dbo].[SQLskills_WaitStats] w
JOIN
(
  SELECT MIN([RowNum]) AS [RowNumber], [CaptureDate]
  FROM     [dbo].[SQLskills_WaitStats]
  WHERE   [CaptureDate] > GETDATE() - 30
  GROUP BY [CaptureDate]
) m
ON [w].[RowNum] = [m].[RowNumber]
ORDER BY [w].[CaptureDate];
Results:
 Top wait for each snapshot (sample output)
The drawback, which existed with my original script, is that it’s still just a snapshot. I can trend the highest waits over time, but if there is an issue that occurs between snapshots, it’s not going to show up. So what can you do?
You could increase the frequency of your captures. Perhaps instead of capturing wait statistics every hour, you capture them every 15 minutes. Or maybe every 10. The more frequently you capture the data, the better chance you have to trap a performance issue.
Your other option would be to use a third-party application, such as SQL Sentry Performance Advisor, to monitor waits. Performance Advisor pulls the exact same information from the sys.dm_os_wait_stats DMV. It queries sys.dm_os_wait_stats every 10 seconds with a very simple query:
SELECT * FROM sys.dm_os_wait_stats WHERE wait_time_ms > 0;
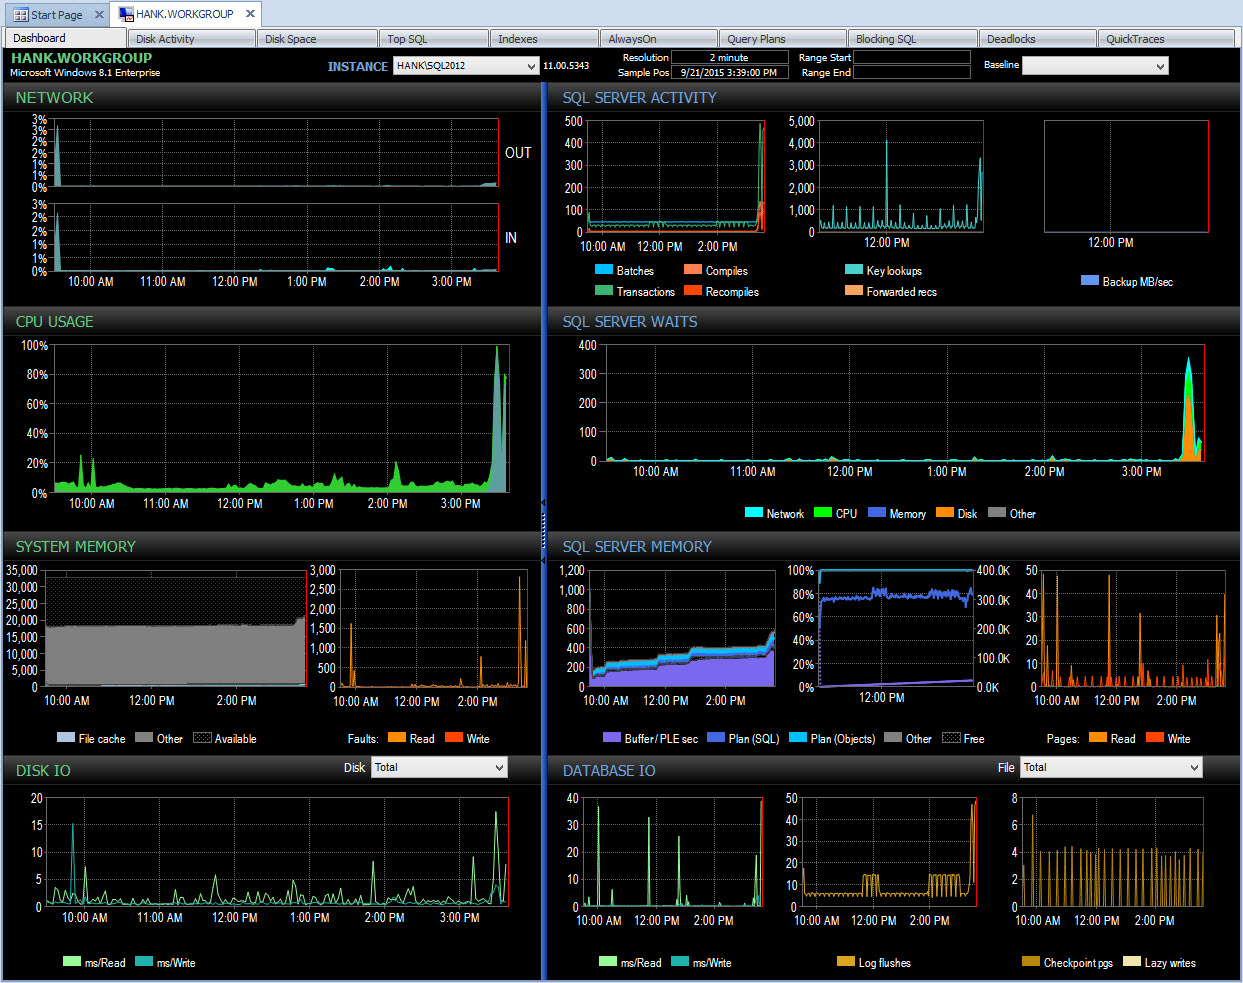
Behind the scenes, Performance Advisor then takes this data and adds it to its monitoring database. When you see the data, benign waits are removed, and the deltas are calculated for you. In addition, Performance Advisor has a fantastic display (looking at the dashboard is much nicer than the text output above) and you can customize the collection if you want. If we look at Performance Advisor and look at data from the entire day, I can easily see where I had an issue in the SQL Server Waits pane:
 Performance Advisor Dashboard for the day
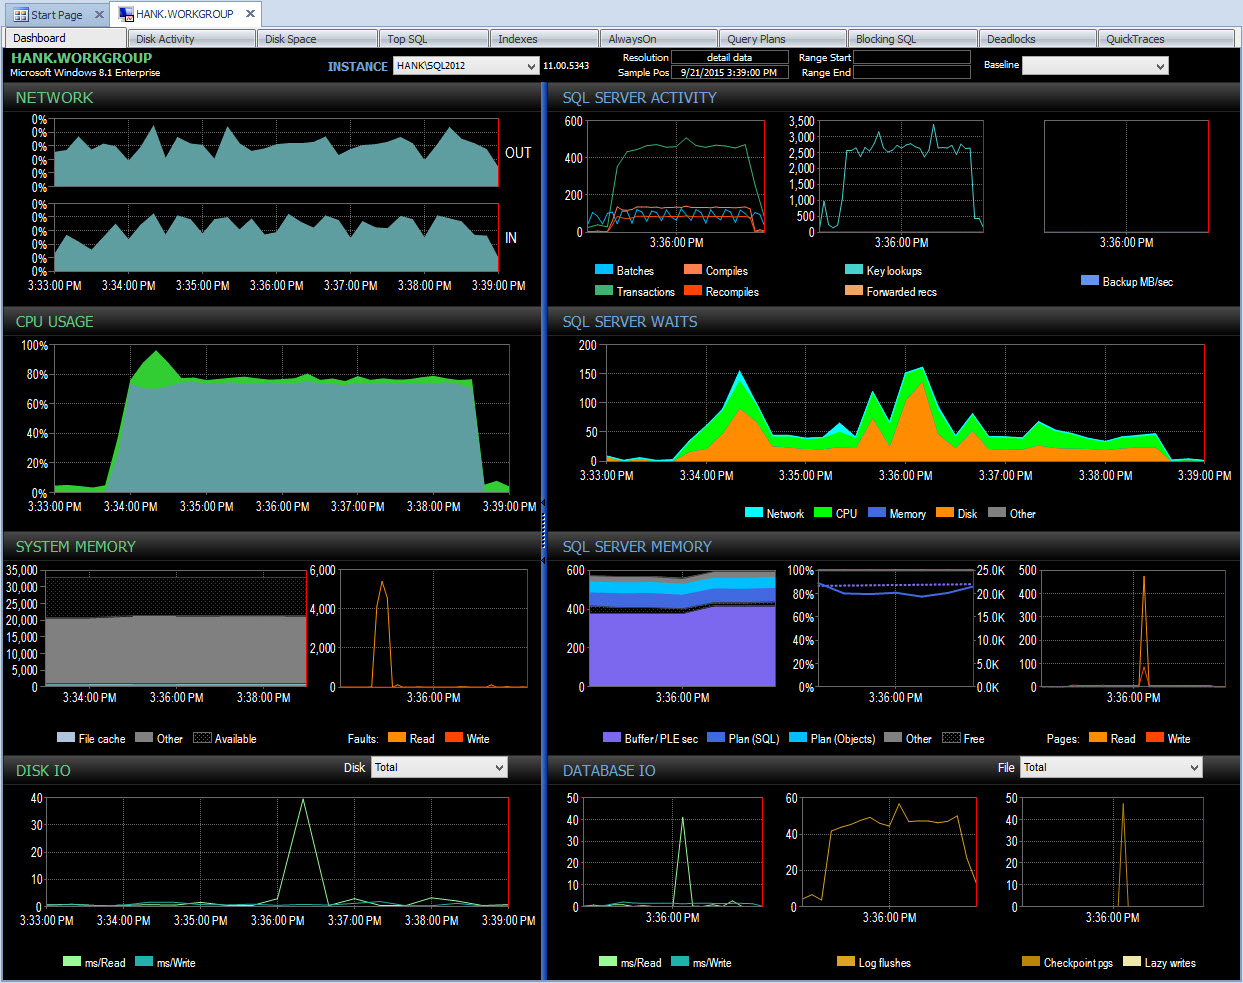
And I can then drill into that time period after 3PM to further investigate what happened:
 Drill down in PA during performance issue
Monitoring on my own, unless I happened to snapshot wait statistics at that same time with a script, I'll have missed capturing any data about that performance issue. Because Performance Advisor stores the information for an extended period of time, if you have a blip in performance, you do have the wait stats data (along with a lot of other information) available to help research the issue, and you also have historical data so you understand what normal waits exist in your environment.
Summary
Whatever method you choose to monitor waits, it’s first important to understand how SQL Server stores wait information, so that you understand the data you’re seeing if you capture it regularly. If you have to roll your own scripts to capture waits, you’re limited in that you might not capture deviations as easily as you could with third party software. But that’s ok – having some amount of baseline data so you can start to understand what is “normal” is better than having nothing at all. As you build your repository and start to become familiar with an environment, you can tailor your capture scripts as necessary to solve any problems which may exist. If you do have the benefit of third party software, use that information to its fullest, and make sure you understand how waits are being collected and stored.


Good tip to WHERE wait_time_ms > 0;
I've been accumulating way too much raw wait stat information. This will help get it down!
Erin is my favorite blogger because I also had education degree on mechanical engineering.
My approach to wait stat is different. On Oct. 13 2015, I gave a talk at Idera GeekSync online; and on Nov.10 2015, I gave the same talk on Wisconsin User Group online. I capture the differential values at each interval on scheduled job. When I go back to check health history, the values captured are exactly the increment for that interval of time, matching up Active Session History that tells me exactly what is happening on my server. I call this approach "Texas two steps" (lol).
The enhanced talk and demo will be given one more time again on SQL Saturday 514, Houston, TX May 14th, 2016.
http://dbace.us
http://www.dbace.us
Regards,
Jason Wong
Hello Erin,
Great Post, thanks much.
However, a small correction is needed to the section which creates the table "WaitsToIgnore", one of the wait type has an extra character.
HADR_FILESTREAM_IOMGR_IOCOMPLETIO(N
Fixed, thanks for the catch!