While Jeff Atwood and Joe Celko seem to think that the cost of GUIDs is no big deal (see Jeff's blog post, "Primary Keys: IDs versus GUIDs," and this newsgroup thread, entitled "Identity Vs. Uniqueidentifier"), other experts – more specifically index and architecture experts focusing on the SQL Server space – tend to disagree. For example, Kimberly Tripp goes over some details in her post, "Disk Space is Cheap – THAT'S NOT THE POINT!", where she explains that the impact isn't just on disk space and fragmentation, but more importantly on index size and memory footprint.
What Kimberly says is really true – I come across the "disk space is cheap" justification for GUIDs all the time (example from just last week). There are other justifications for GUIDs, including the need to generate unique identifiers outside the database (and sometimes before the row is actually created), and the need for unique identifiers across separate distributed systems (and where identity ranges are not practical). But I really want to dispel the myth that GUIDs don't cost all that much, because they do, and you need to weigh these costs into your decision.
I set out on this mission to test the performance of different key sizes, given the same data across the same number of rows, with the same indexes, and roughly the same workload (replaying the *exact* same workload can be quite challenging). Not only did I want to measure the basic things like index size and index fragmentation, but also the effects these have down the line, such as:
- impact on buffer pool usage
- frequency of "bad" page splits
- overall impact on realistic workload duration
- impact on average runtimes of individual queries
- impact on runtime duration of after triggers
- impact on tempdb usage
I will use a variety of techniques to investigate this data, including Extended Events, the default trace, tempdb-related DMVs, and SQL Sentry Performance Advisor.
Setup
First, I created a million customers to put into a seed table using some built-in SQL Server metadata; this would ensure that the "random" customers would consist of the same natural data throughout each test.
CREATE TABLE dbo.CustomerSeeds
(
  rn INT PRIMARY KEY CLUSTERED,
  FirstName NVARCHAR(64),
  LastName NVARCHAR(64),
  EMail NVARCHAR(320) NOT NULL UNIQUE,
  Active BIT
);

INSERT dbo.CustomerSeeds WITH (TABLOCKX) (rn, FirstName, LastName, EMail, [Active])
SELECT rn = ROW_NUMBER() OVER (ORDER BY n), fn, ln, em, a
FROM
(
  SELECT TOP (1000000) fn, ln, em, a = MAX(a), n = MAX(NEWID())
  FROM
  (
    SELECT fn, ln, em, a, r = ROW_NUMBER() OVER (PARTITION BY em ORDER BY em)
    FROM
    (
      SELECT TOP (2000000)
        fn = LEFT(o.name, 64),
        ln = LEFT(c.name, 64),
        em = LEFT(o.name, LEN(c.name)%5+1) + '.'
             + LEFT(c.name, LEN(o.name)%5+2) + '@'
             + RIGHT(c.name, LEN(o.name+c.name)%12 + 1)
             + LEFT(RTRIM(CHECKSUM(NEWID())),3) + '.com',
        a  = CASE WHEN c.name LIKE '%y%' THEN 0 ELSE 1 END
      FROM sys.all_objects AS o CROSS JOIN sys.all_columns AS c
      ORDER BY NEWID()
    ) AS x
  ) AS y WHERE r = 1
  GROUP BY fn, ln, em
  ORDER BY n
) AS z
ORDER BY rn;
GO

SELECT TOP (10) * FROM dbo.CustomerSeeds ORDER BY rn;
GO
Your mileage may vary, but on my system, this population took 86 seconds. Ten representative rows (click to enlarge):
Next, I needed tables to house the seed data for each use case, with a few extra indexes to simulate some sort of reality, and I came up with short suffixes to make all kinds of diagnostics easier later:
| data type | default | compression | use case suffix |
|---|---|---|---|
| INT | IDENTITY | none | I |
| INT | IDENTITY | page + row | Ic |
| BIGINT | IDENTITY | none | B |
| BIGINT | IDENTITY | page + row | Bc |
| UNIQUEIDENTIFIER | NEWID() | none | G |
| UNIQUEIDENTIFIER | NEWID() | page + row | Gc |
| UNIQUEIDENTIFIER | NEWSEQUENTIALID() | none | S |
| UNIQUEIDENTIFIER | NEWSEQUENTIALID() | page + row | Sc |
Table 1: Use cases, data types, and suffixes
Eight tables all told, all borne from the same template (I would just change the comments around to match the use case, and replace $use_case$ with the appropriate suffix from the table above):
CREATE TABLE dbo.Customers_$use_case$ -- I,Ic,B,Bc,G,Gc,S,Sc
(
  CustomerID INT NOT NULL IDENTITY(1,1),
  --CustomerID BIGINT NOT NULL IDENTITY(1,1),
  --CustomerID UNIQUEIDENTIFIER NOT NULL DEFAULT NEWID(),
  --CustomerID UNIQUEIDENTIFIER NOT NULL DEFAULT NEWSEQUENTIALID(),
  FirstName NVARCHAR(64) NOT NULL,
  LastName NVARCHAR(64) NOT NULL,
  EMail NVARCHAR(320) NOT NULL,
  Active BIT NOT NULL DEFAULT 1,
  Created DATETIME NOT NULL DEFAULT SYSDATETIME(),
  Updated DATETIME NULL,
  CONSTRAINT C_PK_Customers_$use_case$ PRIMARY KEY (CustomerID)
) --WITH (DATA_COMPRESSION = PAGE)
GO
;
CREATE UNIQUE INDEX C_Email_Customers_$use_case$ ON dbo.Customers_$use_case$(EMail)
  --WITH (DATA_COMPRESSION = PAGE)
;
GO
CREATE INDEX C_Active_Customers_$use_case$ ON dbo.Customers_$use_case$(FirstName, LastName, EMail)
  WHERE Active = 1
  --WITH (DATA_COMPRESSION = PAGE)
;
GO
CREATE INDEX C_Name_Customers_$use_case$ ON dbo.Customers_$use_case$(LastName, FirstName)
  INCLUDE (EMail)
  --WITH (DATA_COMPRESSION = PAGE)
;
GO
Once the tables were created, I proceeded to populate the tables and measure many of the metrics I alluded to above. I restarted the SQL Server service in between each test to be sure they were all starting from the same baseline, that DMVs would be reset, etc.
Uncontested Inserts
My eventual goal was to fill the table with 1,000,000 rows, but first I wanted to see the impact of the data type and compression on raw inserts with no contention. I generated the following query – which would populate the table with the first 200,000 contacts, 2000 rows at a time – and ran it against each table:
DECLARE @i INT = 1;
WHILE @i <= 100
BEGIN
  INSERT dbo.Customers_$use_case$(FirstName, LastName, Email, Active)
    SELECT FirstName, LastName, Email, Active
    FROM dbo.CustomerSeeds AS c
    ORDER BY rn
    OFFSET 2000 * (@i-1) ROWS
    FETCH NEXT 2000 ROWS ONLY;
  SET @i += 1;
END
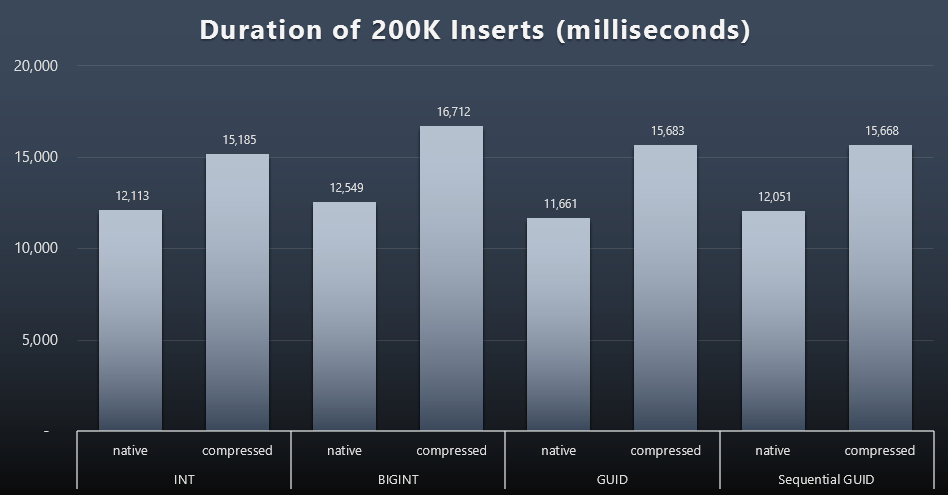
Results (click to enlarge):
Each case took about 12 seconds (without compression) and 16 seconds (with compression), with no clear winner in either storage mode. The effect of compression (mainly on CPU overhead) is pretty consistent, but since this is running on a fast SSD, the I/O impact of the different data types is negligible. In fact the compression against BIGINT seemed to have the biggest impact (and this makes sense, since every single value less than 2 billion would be compressed).
More Contentious Workload
Next I wanted to see how a mixed workload would compete for resources and generally perform against each data type. So I created these procedures (replacing $use_case$ and $data_type$ appropriately for each test):
-- random singleton updates to data in more than one index
CREATE PROCEDURE [dbo].[Customers_$use_case$_RandomUpdate]
  @Customers_$use_case$ $data_type$
AS
BEGIN
  SET NOCOUNT ON;

  UPDATE dbo.Customers_$use_case$
    SET LastName = COALESCE(STUFF(LastName, 4, 1, 'x'),'x')
    WHERE CustomerID = @Customers_$use_case$;
END
GO

-- reads ("pagination") - supporting multiple sorts
-- use dynamic SQL to track query stats separately
CREATE PROCEDURE [dbo].[Customers_$use_case$_Page]
  @PageNumber INT = 1,
  @PageSize   INT = 100,
  @sort       SYSNAME
AS
BEGIN
  SET NOCOUNT ON;

  DECLARE @sql NVARCHAR(MAX) = N'SELECT CustomerID,
     FirstName, LastName, Email, Active, Created, Updated
    FROM dbo.Customers_$use_case$
    ORDER BY ' + @sort + N' OFFSET ((@pn-1)*@ps)
    ROWS FETCH NEXT @ps ROWS ONLY;';

  EXEC sys.sp_executesql @sql, N'@pn INT, @ps INT',
    @PageNumber, @PageSize;
END
GO
Then I created jobs that would call those procedures repeatedly, with slight delays, and also - simultaneously - finish populating the remaining 800,000 contacts. This script creates all 32 jobs, and also prints output that can be used later to call all of the jobs for a specific test asynchronously:
USE msdb;
GO

DECLARE @typ TABLE(use_case VARCHAR(2), data_type SYSNAME);
INSERT @typ(use_case, data_type) VALUES
('I', N'INT'),              ('Ic',N'INT'),
('B', N'BIGINT'),           ('Bc', N'BIGINT'),
('G', N'UNIQUEIDENTIFIER'), ('Gc', N'UNIQUEIDENTIFIER'),
('S', N'UNIQUEIDENTIFIER'), ('Sc', N'UNIQUEIDENTIFIER');

DECLARE @jobs TABLE(name SYSNAME, cmd NVARCHAR(MAX));
INSERT @jobs(name, cmd) VALUES
(  N'Random update workload',
   N'DECLARE @CustomerID $data_type$, @i INT = 1;
     WHILE @i <= 500
     BEGIN
       SELECT TOP (1) @CustomerID = CustomerID FROM dbo.Customers_$use_case$ ORDER BY NEWID();
       EXEC dbo.Customers_$use_case$_RandomUpdate @Customers_$use_case$ = @CustomerID;
       WAITFOR DELAY ''00:00:01'';
       SET @i += 1;
     END'),
(  N'Populate customers',
   N'SET QUOTED_IDENTIFIER ON;
     DECLARE @i INT = 101;
     WHILE @i <= 500
     BEGIN
       INSERT dbo.Customers_$use_case$(FirstName, LastName, Email, Active)
         SELECT FirstName, LastName, Email, Active
         FROM dbo.CustomerSeeds AS c
         ORDER BY rn
         OFFSET 2000 * (@i-1) ROWS
         FETCH NEXT 2000 ROWS ONLY;
       WAITFOR DELAY ''00:00:01'';
       SET @i += 1;
     END'),
(  N'Paging workload 1',
   N'DECLARE @i INT = 1, @sql NVARCHAR(MAX);
     WHILE @i <= 1001
     BEGIN -- sort by CustomerID
       SET @sql = N''EXEC dbo.Customers_$use_case$_Page @PageNumber = @i, @sort = N''''CustomerID'''';'';
       EXEC sys.sp_executesql @sql, N''@i INT'', @i;
       WAITFOR DELAY ''00:00:01'';
       SET @i += 2;
     END'),
(  N'Paging workload 2',
   N'DECLARE @i INT = 1, @sql NVARCHAR(MAX);
     WHILE @i <= 1001
     BEGIN -- sort by LastName, FirstName
       SET @sql = N''EXEC dbo.Customers_$use_case$_Page @PageNumber = @i, @sort = N''''LastName, FirstName'''';'';
       EXEC sys.sp_executesql @sql, N''@i INT'', @i;
       WAITFOR DELAY ''00:00:01'';
       SET @i += 2;
     END');

DECLARE @n SYSNAME, @c NVARCHAR(MAX);

DECLARE c CURSOR LOCAL FAST_FORWARD FOR
SELECT name = t.use_case + N' ' + j.name,
       cmd  = REPLACE(REPLACE(j.cmd, N'$use_case$', t.use_case),
              N'$data_type$', t.data_type)
  FROM @typ AS t CROSS JOIN @jobs AS j;

OPEN c; FETCH c INTO @n, @c;

WHILE @@FETCH_STATUS <> -1
BEGIN
  IF EXISTS (SELECT 1 FROM msdb.dbo.sysjobs WHERE name = @n)
  BEGIN
    EXEC msdb.dbo.sp_delete_job @job_name = @n;
  END

  EXEC msdb.dbo.sp_add_job
    @job_name  = @n,
    @enabled   = 0,
    @notify_level_eventlog = 0,
    @category_id = 0,
    @owner_login_name = N'sa';

  EXEC msdb.dbo.sp_add_jobstep
    @job_name  = @n,
    @step_name = @n,
    @command   = @c,
    @database_name = N'IDs';

  EXEC msdb.dbo.sp_add_jobserver
    @job_name = @n,
    @server_name = N'(local)';

  PRINT 'EXEC msdb.dbo.sp_start_job @job_name = N''' + @n + ''';';

  FETCH c INTO @n, @c;
END
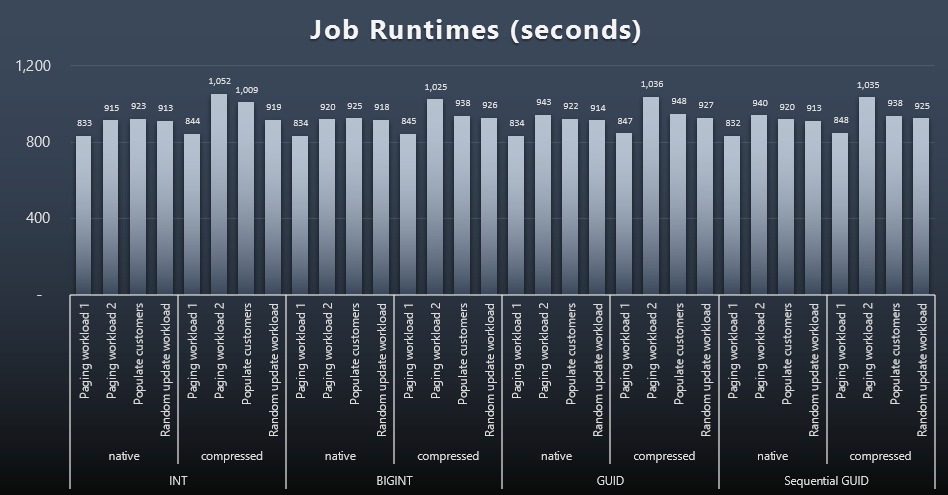
Measuring the job timings in each case was trivial - I could check start/end dates in msdb.dbo.sysjobhistory or pull them from SQL Sentry Event Manager. Here are the results (click to enlarge):
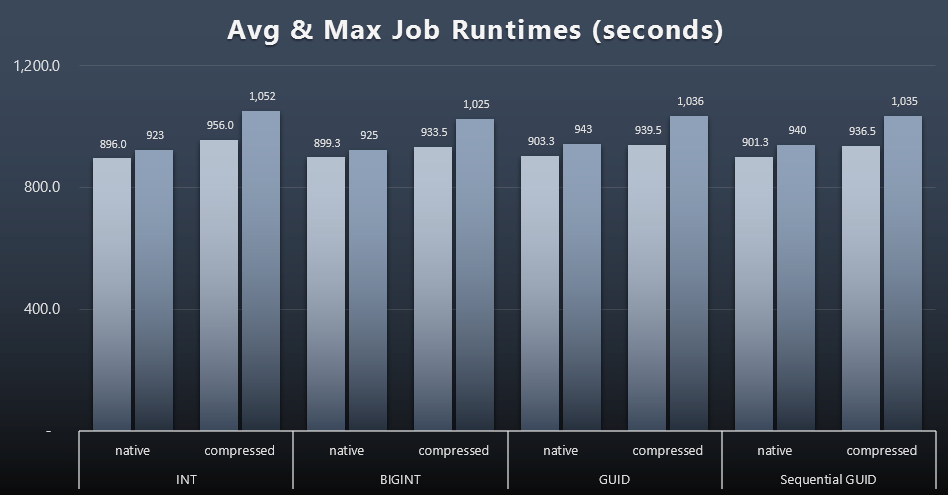
And if you wanted to have a little less to digest, just look at the average and maximum runtimes across the four jobs (click to enlarge):
But even in this second graph there is not really enough variance to make a compelling case for or against any of the approaches.
Query Runtimes
I took some metrics from sys.dm_exec_query_stats and sys.dm_exec_trigger_stats to determine how long individual queries were taking on average.
Population
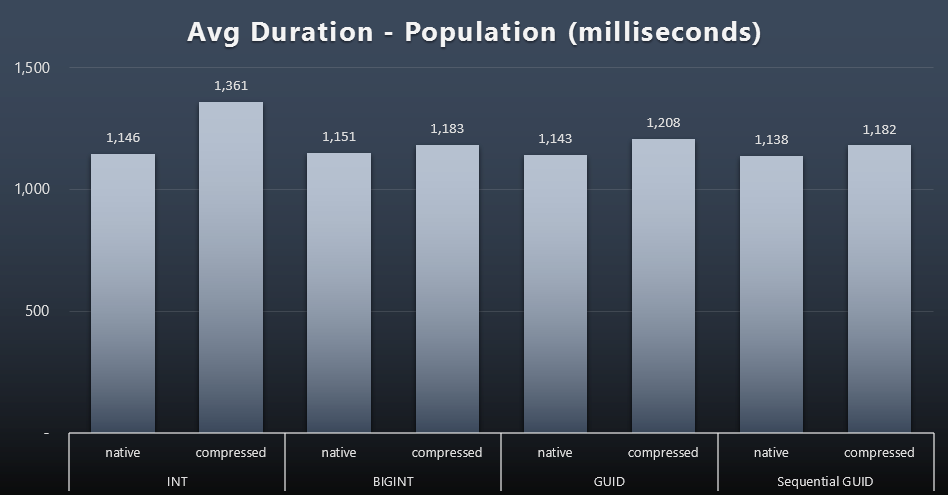
The first 200,000 customers were loaded quite quickly - under 20 seconds - due to no competing workloads. Once the four jobs were running simultaneously, however, there was a significant impact on write durations due to concurrency. The remaining 800,000 rows required at least an order of magnitude more time to complete, on average. Here are the results of averaging out each 2,000 customer insert (click to enlarge):
We see here that compressing an INT was the only real outlier - I have some theories on that, but nothing conclusive yet.
Paging Workloads
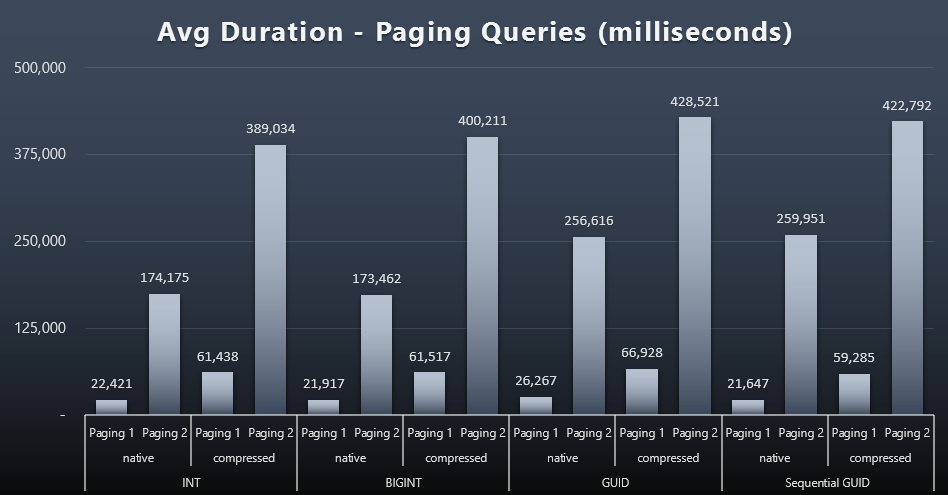
The average runtimes of the paging queries also seem to have been significantly affected by concurrency compared to my test runs in isolation. Here are the results (click to enlarge):
(Paging 1 = order by CustomerID, Paging 2 = order by LastName, FirstName.)
We see that for both Paging 1 (order by CustomerID) and Paging 2 (order by names), there is a significant impact on run time due to compression (up to ~700%). Both GUIDs seem to be the slowest horses in this race, with NEWID() performing the worst.
Update Workloads
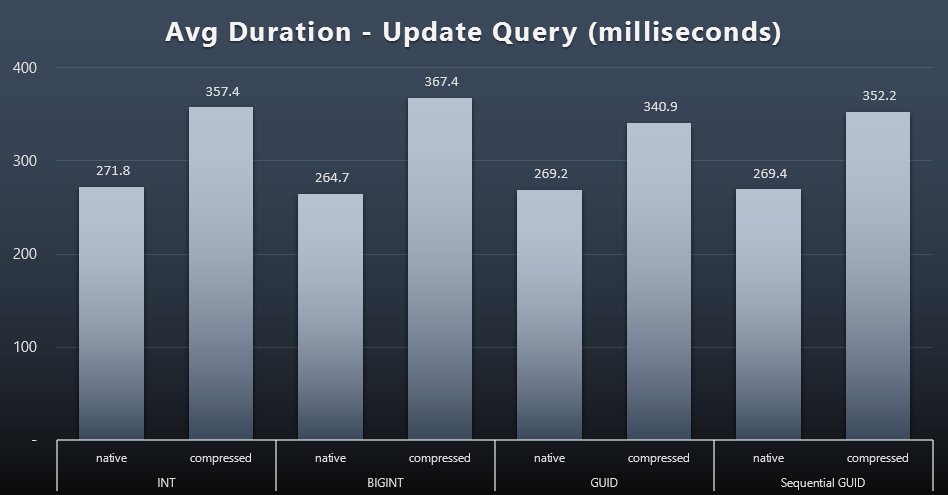
The singleton updates were quite fast even under heavy concurrency, but there were still some noticeable differences due to compression, and even some surprising differences across data types (click to enlarge):
Most notably, the updates to the rows containing GUID values were actually faster than the updates containing INT/BIGINT, when compression was in use. With native storage, the differences were less noteworthy (but INT was still a loser there).
Trigger Statistics
Here are the average and maximum runtimes for the simple trigger in each case (click to enlarge):
Compression seems to have a much larger impact here than data type choice (though this would likely be more pronounced if some of my update workload had updated many rows instead of consisting solely of single-row seeks). The maximum for sequential GUID is clearly an outlier of some sort that I did not investigate (you can tell it is insignificant based on the average still being in line across the board).
What were these queries waiting on?
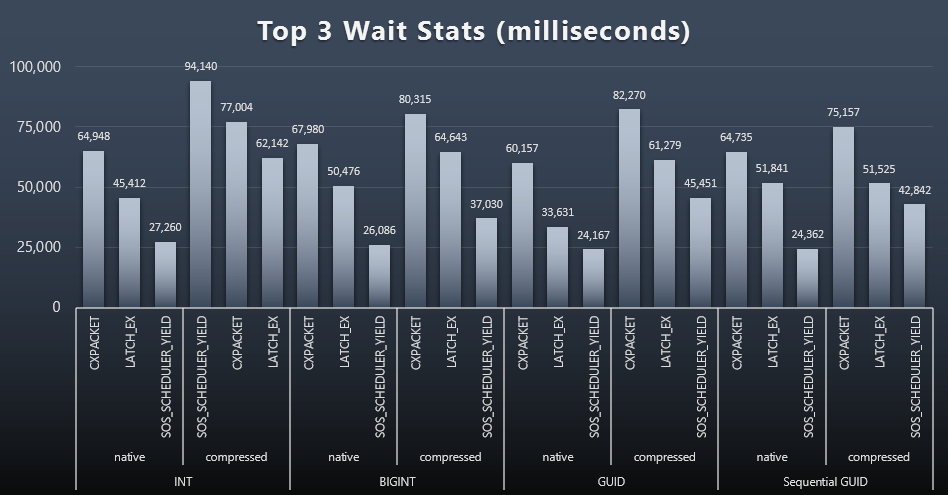
After each workload, I also took a look at the top waits on the system, throwing away obvious queue/timer waits (as described by Paul Randal), and irrelevant activity from monitoring software (like TRACEWRITE). Here were the top 3 waits in each case (click to enlarge):
In most cases, the waits were CXPACKET, then LATCH_EX, then SOS_SCHEDULER_YIELD. In the use case involving integers and compression, though, SOS_SCHEDULER_YIELD took over, which implies to me some inefficiency in the algorithm for compressing integers (which may be completely unrelated to the algorithm used to squeeze BIGINTs into INTs). I did not investigate this further, nor did I find justification for tracking waits per individual query.
Disk Space / Fragmentation
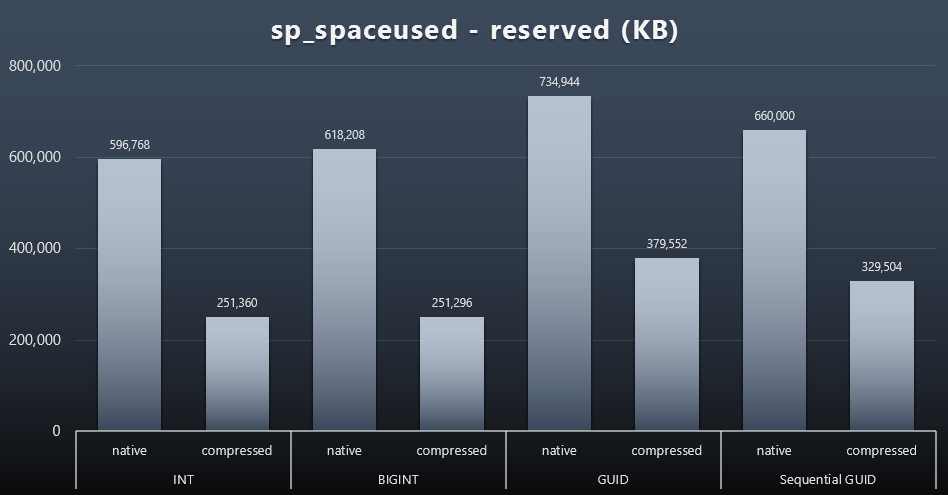
While I tend to agree that it's not about the disk space, it's still a metric worth presenting. Even in this very simplistic case where there is only one table and the key is not present in all of the other related tables (which would surely exist in a real application), the difference is significant. First let's just look at the reserved column from sp_spaceused (click to enlarge):
Here, BIGINT only took a little more space than INT, and GUID (as expected) had a bigger jump. Sequential GUID had a less significant increase in space used, and compressed a lot better than traditional GUID, too. Again, no surprises here - a GUID is bigger than a number, full stop. Now, GUID proponents might argue that the price you pay in terms of disk space is not that much (18% over BIGINT without compression, around 50% with compression). But remember that this is a single table of 1 million rows. Imagine how that will extrapolate when you have 10 million customers and many of them have 10, 30, or 500 orders - those keys could be repeated in a dozen other tables, and take up the same extra space in each row.
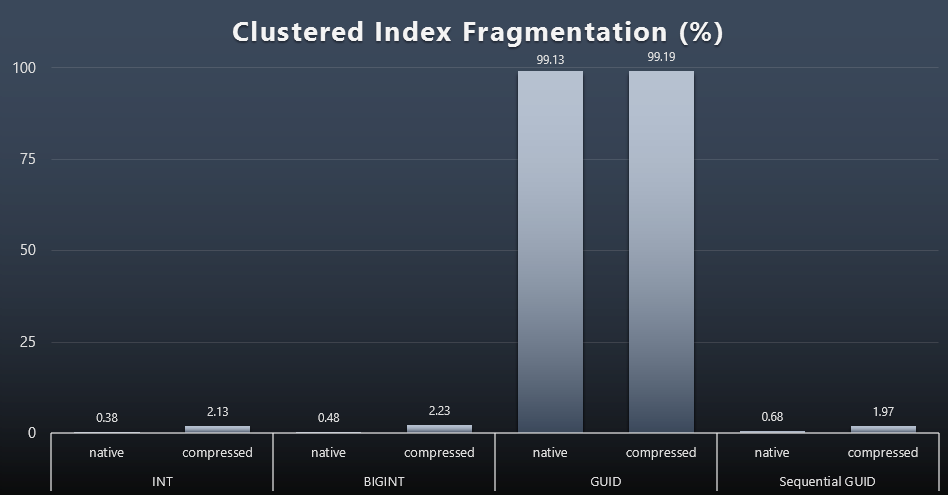
When I looked at fragmentation after each workload (remember, no index maintenance is being performed) using this query:
SELECT index_id,
  FROM sys.dm_db_index_physical_stats
  (DB_ID(), OBJECT_ID('dbo.Customers_$use_case$'), -1, 0, 'DETAILED');
The results made for much less interesting visuals; all non-clustered indexes were fragmented over 99%. The clustered indexes, however, were either very highly fragmented, or not fragmented at all (click to enlarge):
Fragmentation is another metric that often means much less when we're talking about SSDs, but it is important to note all the same, since not all systems can afford to be blissfully unaware of the impact fragmentation can have on I/O patterns. I believe that using non-sequential GUIDs, on a more I/O-bound system, the impact of this fragmentation alone would be drastically amplified on most of the other metrics in this test.
Buffer Pool Usage
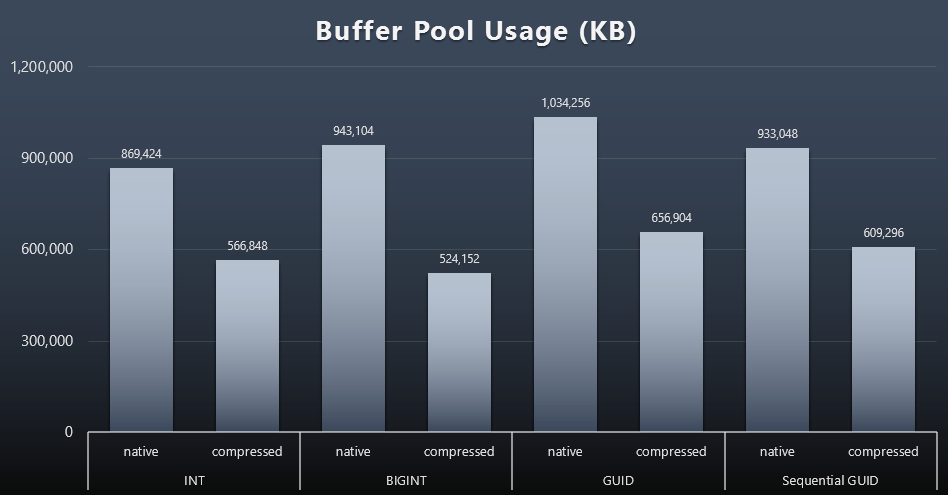
This is where being judicious about the amount of disk space used by your tables really pays off - the bigger your tables are, the more space they take up in the buffer pool. Moving data in and out of the buffer pool is expensive, and again, this is a very simplistic case where the tests were run in isolation and there weren't other applications and databases on the instance competing for precious memory.
This is a simple measure of the following query at the end of each workload:
SELECT total_kb
  FROM sys.dm_os_memory_broker_clerks
  WHERE clerk_name = N'Buffer Pool';
Results (click to enlarge):
While most of this graph is not surprising at all - GUID takes more space than BIGINT, BIGINT more than INT - I did find it interesting that a Sequential GUID took up less space than a BIGINT, even without compression. I've made a note to perform some page-level forensics to determine what kind of efficiencies are taking place here under the covers.
tempdb Usage
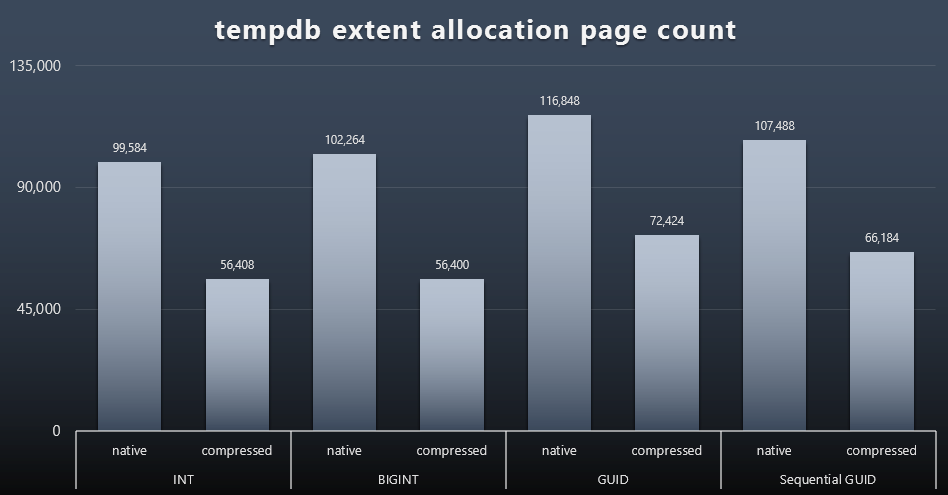
I'm not sure what I was expecting here, but after each workload, I gathered the contents of the three tempdb-related space usage DMVs, sys.dm_db_file|session|task_space_usage. The only one that seemed to show any volatility based on data type was sys.dm_db_file_space_usage's extent_allocation_page_count. This shows that - at least in my configuration and this specific workload - GUIDs will put tempdb through a slightly more thorough workout (click to enlarge):
"Bad" Page Splits
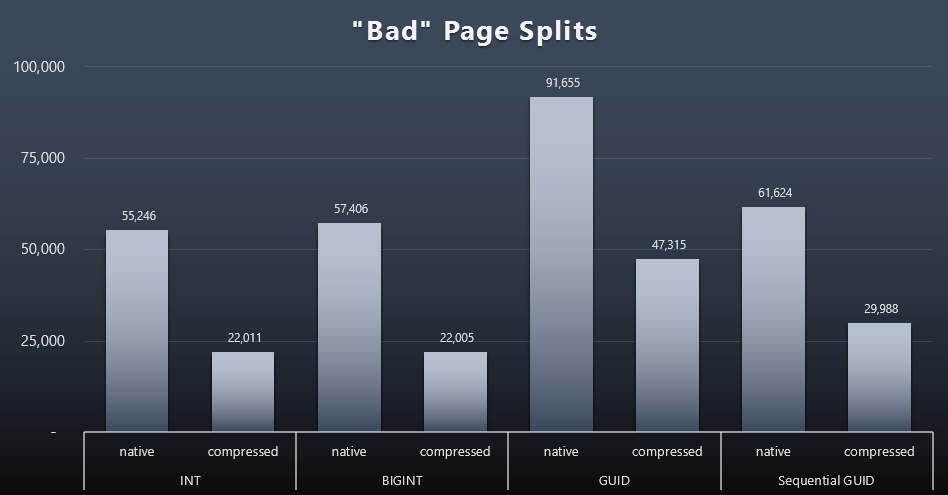
One of the things I wanted to measure was the impact on page splits - not normal page splits (when you add a new page) but when you actually have to move data between pages to make room for more rows. Jonathan Kehayias talks about this in more depth in his blog post, "Tracking Problematic Pages Splits in SQL Server 2012 Extended Events – No Really This Time!," which also provides the basis for the Extended Events session I used to capture the data:
CREATE EVENT SESSION [BadPageSplits] ON SERVER
  ADD EVENT sqlserver.transaction_log
  (WHERE operation = 11 AND database_id = 10)
  ADD TARGET package0.histogram
  (
    SET filtering_event_name = 'sqlserver.transaction_log',
        source_type = 0,
        source = 'alloc_unit_id'
  );
GO
ALTER EVENT SESSION [BadPageSplits] ON SERVER STATE = START;
GO
And the query I used to plot it:
SELECT t.name, SUM(tab.split_count)
FROM
(
  SELECT
    n.value('(value)[1]', 'bigint') AS alloc_unit_id,
    n.value('(@count)[1]', 'bigint') AS split_count
  FROM
  (
    SELECT CAST(target_data as XML) target_data
      FROM sys.dm_xe_sessions AS s
      INNER JOIN sys.dm_xe_session_targets AS t
          ON s.address = t.event_session_address
      WHERE s.name = 'BadPageSplits'
      AND t.target_name = 'histogram'
  ) AS x
  CROSS APPLY target_data.nodes('HistogramTarget/Slot') as q(n)
) AS tab
INNER JOIN sys.allocation_units AS au
    ON tab.alloc_unit_id = au.allocation_unit_id
INNER JOIN sys.partitions AS p
    ON au.container_id = p.partition_id
INNER JOIN sys.tables AS t
    ON p.object_id = t.[object_id]
GROUP BY t.name;
And here are the results (click to enlarge):
Although I've already noted that in my scenario (where I'm running on fast SSDs) the indisputable difference in I/O activity does not directly impact overall run time, this is still a metric you'll want to consider - particularly if you don't have SSDs or if your workload is already I/O-bound.
Conclusion
While these tests have opened my eyes a little wider about how long-running perceptions I've had have been altered by more modern hardware, I'm still quite staunchly against wasting space on disk or in memory. While I tried to demonstrate some balance and let GUIDs shine, there is very little here from a performance perspective to support switching from INT/BIGINT to either form of UNIQUEIDENTIFIER - unless you need it for other less tangible reasons (such as creating the key in the application or maintaining unique key values across disparate systems). A quick summary, showing that NEWID() is the worst choice across many of the metrics where there was a substantial difference (and in most of those cases, NEWSEQUENTIALID() was a close second)):
| Metric | Clear Loser(s)? |
|---|---|
| Uncontested Inserts | - draw - |
| Concurrent Workload | - draw - |
| Individual queries - Population | INT (compressed) |
| Individual queries - Paging | NEWID() / NEWSEQUENTIALID() |
| Individual queries - Update | INT (native) / BIGINT (compressed) |
| Individual queries - AFTER trigger | - draw - |
| Disk Space | NEWID() |
| Clustered Index Fragmentation | NEWID() |
| Buffer Pool Usage | NEWID() |
| tempdb Usage | NEWID() |
| "Bad" Page Splits | NEWID() |
Table 2: Biggest Losers
Feel free to test these things out for yourself; I can assemble my full set of scripts if you'd like to run them in your own environment. The short-winded purpose of this entire post is quite simple: there are many important metrics to consider aside from the predictable impact on disk space, so it shouldn't be used alone as an argument in either direction.
Now, I don't want this line of thinking to be restricted to keys, per se. It really should be thought about whenever any data type choice is being made. I see datetime being chosen often, for example, when only a date or smalldatetime is needed. On transactional tables, this too can yield to a lot of wasted disk space, and this trickles down to some of these other resources as well.
In a future test I'd like to compare results for a much larger table (> 2 billion rows). I can simulate this with INT by setting the identity seed to -2 billion, allowing for ~4 billion rows. And I'd like the workload and disk space/memory footprint comparisons to involve more than a single table, since one of the advantages to a skinny key is when that key is represented in dozens of related tables. I was monitoring for autogrow events, but there were none, since the database was pre-sized large enough to accommodate the growth, and I didn't think to measure actual log usage inside the existing log file, so I'd like to test again with the defaults for log size and autogrowth, and this time measuring DBCC SQLPERF(LOGSPACE);. Would also be interesting to time rebuilds and measure log usage as a result of those operations, too. Finally, I'd like to make I/O a more relevant factor by finding a server with mechanical hard disks - I know there are plenty out there, but in some shops they're pretty scarce.





I understand that all tables in this test were cached in buffer pool. That makes most IO problems disappear. Even random writes are partially sequentialized by lazy flushing of bigger batches of pages.
When you run this workload out-of-memory you surely can provoke a 100x difference in performance. In my mind that's the main problem with random keys – out-of-memory workloads.
tobi, the concurrent workload was all run as I was populating the table (that was kind of the point). I don't know how to do that without having the data in the buffer pool. :-) Plus, as many people will point out, RAM is a very cheap solution if the problem really is that your data doesn't fit into memory, and this doesn't change whether you've picked GUIDs or numerics.
In the conclusion, I stated that I wanted to test on a much bigger table, and mentioned rows. I also meant that I want to be sure (a) the table is wider, and more realistic, and (b) does *not* fit into memory. Hopefully this will lead to much more satisfying results.
I love the phrase, disk is cheap. Managing the SQL environment for a multi-billion dollar company, we consumed a lot of disk. I learned through multiple budget meetings that enterprise storage is NOT cheap. 10k for a TB of enterprise fast spinning disk is pretty expensive. We couldn't run out to Best Buy and grab some extra disk for our SQL Servers, well not the ones we cared about.
Great article.
While not explicitly tested here, what is easily overlooked is the impact increased data-volume in real life complex queries over complex data-models brings. Single table tests will never truly capture the resources wasted. Such as longer duration locks and the increased contention that results. Or that the buffer pool usage, that results in extra I/O, or the fatter indexes that result in the same and then some. What about spills to tempdb that would otherwise not happen? And above all the increase in logspace usage and the impact on back-ups.
Testing one table at a time will only show signs / hints, but under pressure of real workloads performance can take a really much deeper dive. Each way of modelling and querying that model has a breaking point from where things not only do not scale, but performance collapses. It becomes akin to working a queue as fast as one can, but that over time keeps getting longer regardless. Inefficiencies tend to reinforce each-other when you least want them to.
Not being wasteful in the modeling stage is one of the best things that can be done to keep that point far beyond the expected server load. In general, it leads to leaner/better query plans without further effort. It also makes tuning easier when there is need for it as smaller data volumes are easier to handle and allow for more targeted indexes if that turns out to be the only way.
It looks like you used a clustered PK for the guids which doesn't really make sense, because that would randomly distribute the results. However, when I changed that it (surprising to me) did not seem to make a difference on the tests I ran.
"Doesn't really make sense" yet I see this all the time. And at the kigh end, folks like Thomas Kejser advocate this approach precisely for the reason that random distribution increases overall I/O throughput.