In my last post ("Dude, who owns that #temp table?"), I suggested that in SQL Server 2012 and above, you could use Extended Events to monitor the creation of #temp tables. This would allow you to correlate specific objects taking up a lot of space in tempdb with the session that created them (for example, to determine if the session could be killed to try to free up the space). What I didn't discuss is the overhead of this tracking – we expect Extended Events to be lighter than trace, but no monitoring is completely free.
Since most people leave the default trace enabled, we'll leave that in place. We'll test both heaps using SELECT INTO (which the default trace won't collect) and clustered indexes (which it will), and we'll time the batch on its own as a baseline, then run the batch again with the Extended Events session running. We'll also test against both SQL Server 2012 and SQL Server 2014. The batch itself is pretty simple:
SET NOCOUNT ON;

SELECT SYSDATETIME();
GO

-- run this portion for only the heap batch:
SELECT TOP (100) [object_id]
  INTO #foo
  FROM sys.all_objects
  ORDER BY [object_id];
DROP TABLE #foo;

-- run this portion for only the CIX batch:
CREATE TABLE #bar(id INT PRIMARY KEY);
INSERT #bar(id)
  SELECT TOP (100) [object_id]
  FROM sys.all_objects
  ORDER BY [object_id];
DROP TABLE #bar;

GO 100000

SELECT SYSDATETIME();
Both instances have tempdb configured with four data files and with TF 1117 and TF 1118 enabled, in a VM with four CPUs, 16GB of memory, and only SSD. I intentionally created small #temp tables to amplify any observed impact on the batch itself (which would get drowned out if creating the #temp tables took a long time or caused excessive autogrowth events).
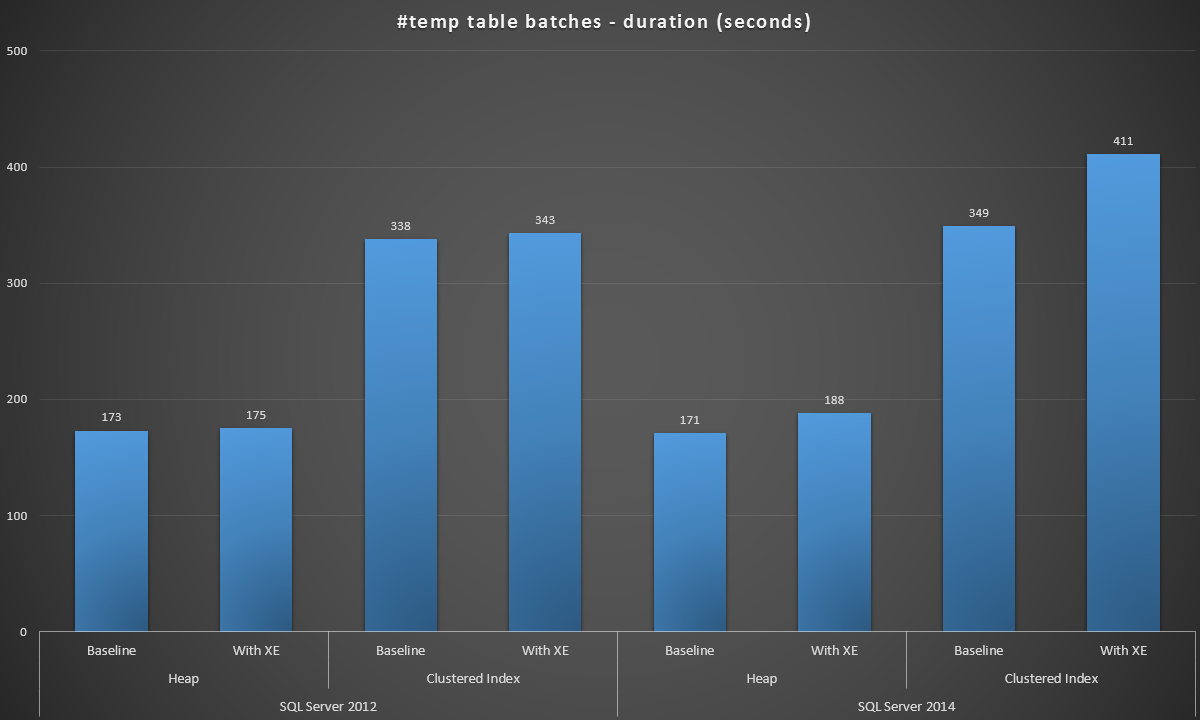
I ran these batches in each scenario, and here were the results, measured in batch duration in seconds:

Batch duration, in seconds, of creating 100,000 #temp tables
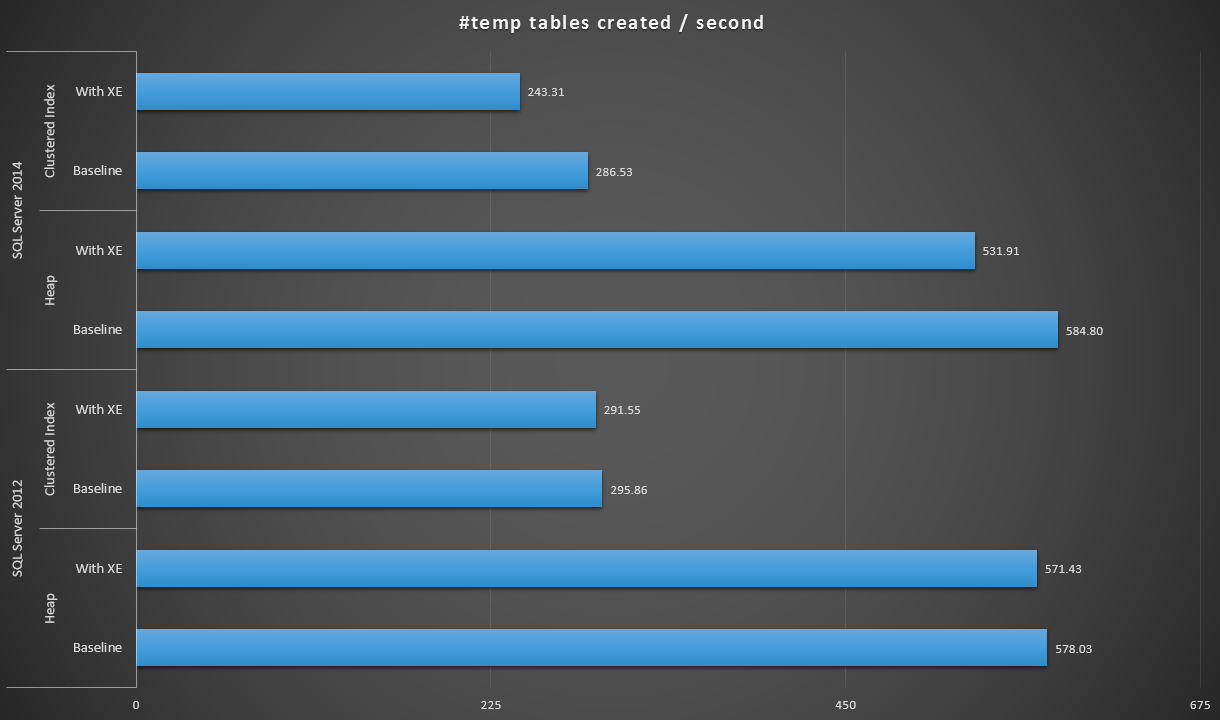
Expressing the data a little bit differently, if we divide 100,000 by the duration, we can show the number of #temp tables we can create per second in each scenario (read: throughput). Here are those results:

#temp tables created per second under each scenario
The results were a little surprising to me – I expected that, with the SQL Server 2014 improvements in eager write logic, the heap population at the very least would run a lot faster. The heap in 2014 was two measly seconds faster than 2012 at the baseline configuration, but Extended Events drove the time up quite a bit (roughly a 10% increase over baseline); while the clustered index time was comparable to 2012 at the baseline, but went up by nearly 18% with Extended Events enabled. In 2012, the deltas for heaps and clustered indexes were much more modest – 1.1% and 1.5% respectively. (And to be clear, no autogrow events occurred during any of the tests.)
So, I thought, what if I created a leaner, meaner Extended Events session? Surely I could remove some of those action columns – maybe I only need login name and spid, and can ignore the app name, host name, and potentially expensive sql_text. Perhaps I could drop the additional filter against the commit (collecting twice as many events, but less CPU spent on filtering) and allow multiple event loss to reduce potential impact on the workload. This leaner session looks like this:
CREATE EVENT SESSION [TempTableCreation2014_LeanerMeaner] ON SERVER
ADD EVENT sqlserver.object_created
(
  ACTION
  (
    sqlserver.server_principal_name,
    sqlserver.session_id
  )
  WHERE
  (
    sqlserver.like_i_sql_unicode_string([object_name], N'#%')
  )
)
ADD TARGET package0.asynchronous_file_target
(
  SET FILENAME = 'c:\temp\TempTableCreation2014_LeanerMeaner.xel',
      MAX_FILE_SIZE = 32768,
      MAX_ROLLOVER_FILES = 10
)
WITH
(
  EVENT_RETENTION_MODE = ALLOW_MULTIPLE_EVENT_LOSS
);
GO
ALTER EVENT SESSION [TempTableCreation2014_LeanerMeaner] ON SERVER STATE = START;
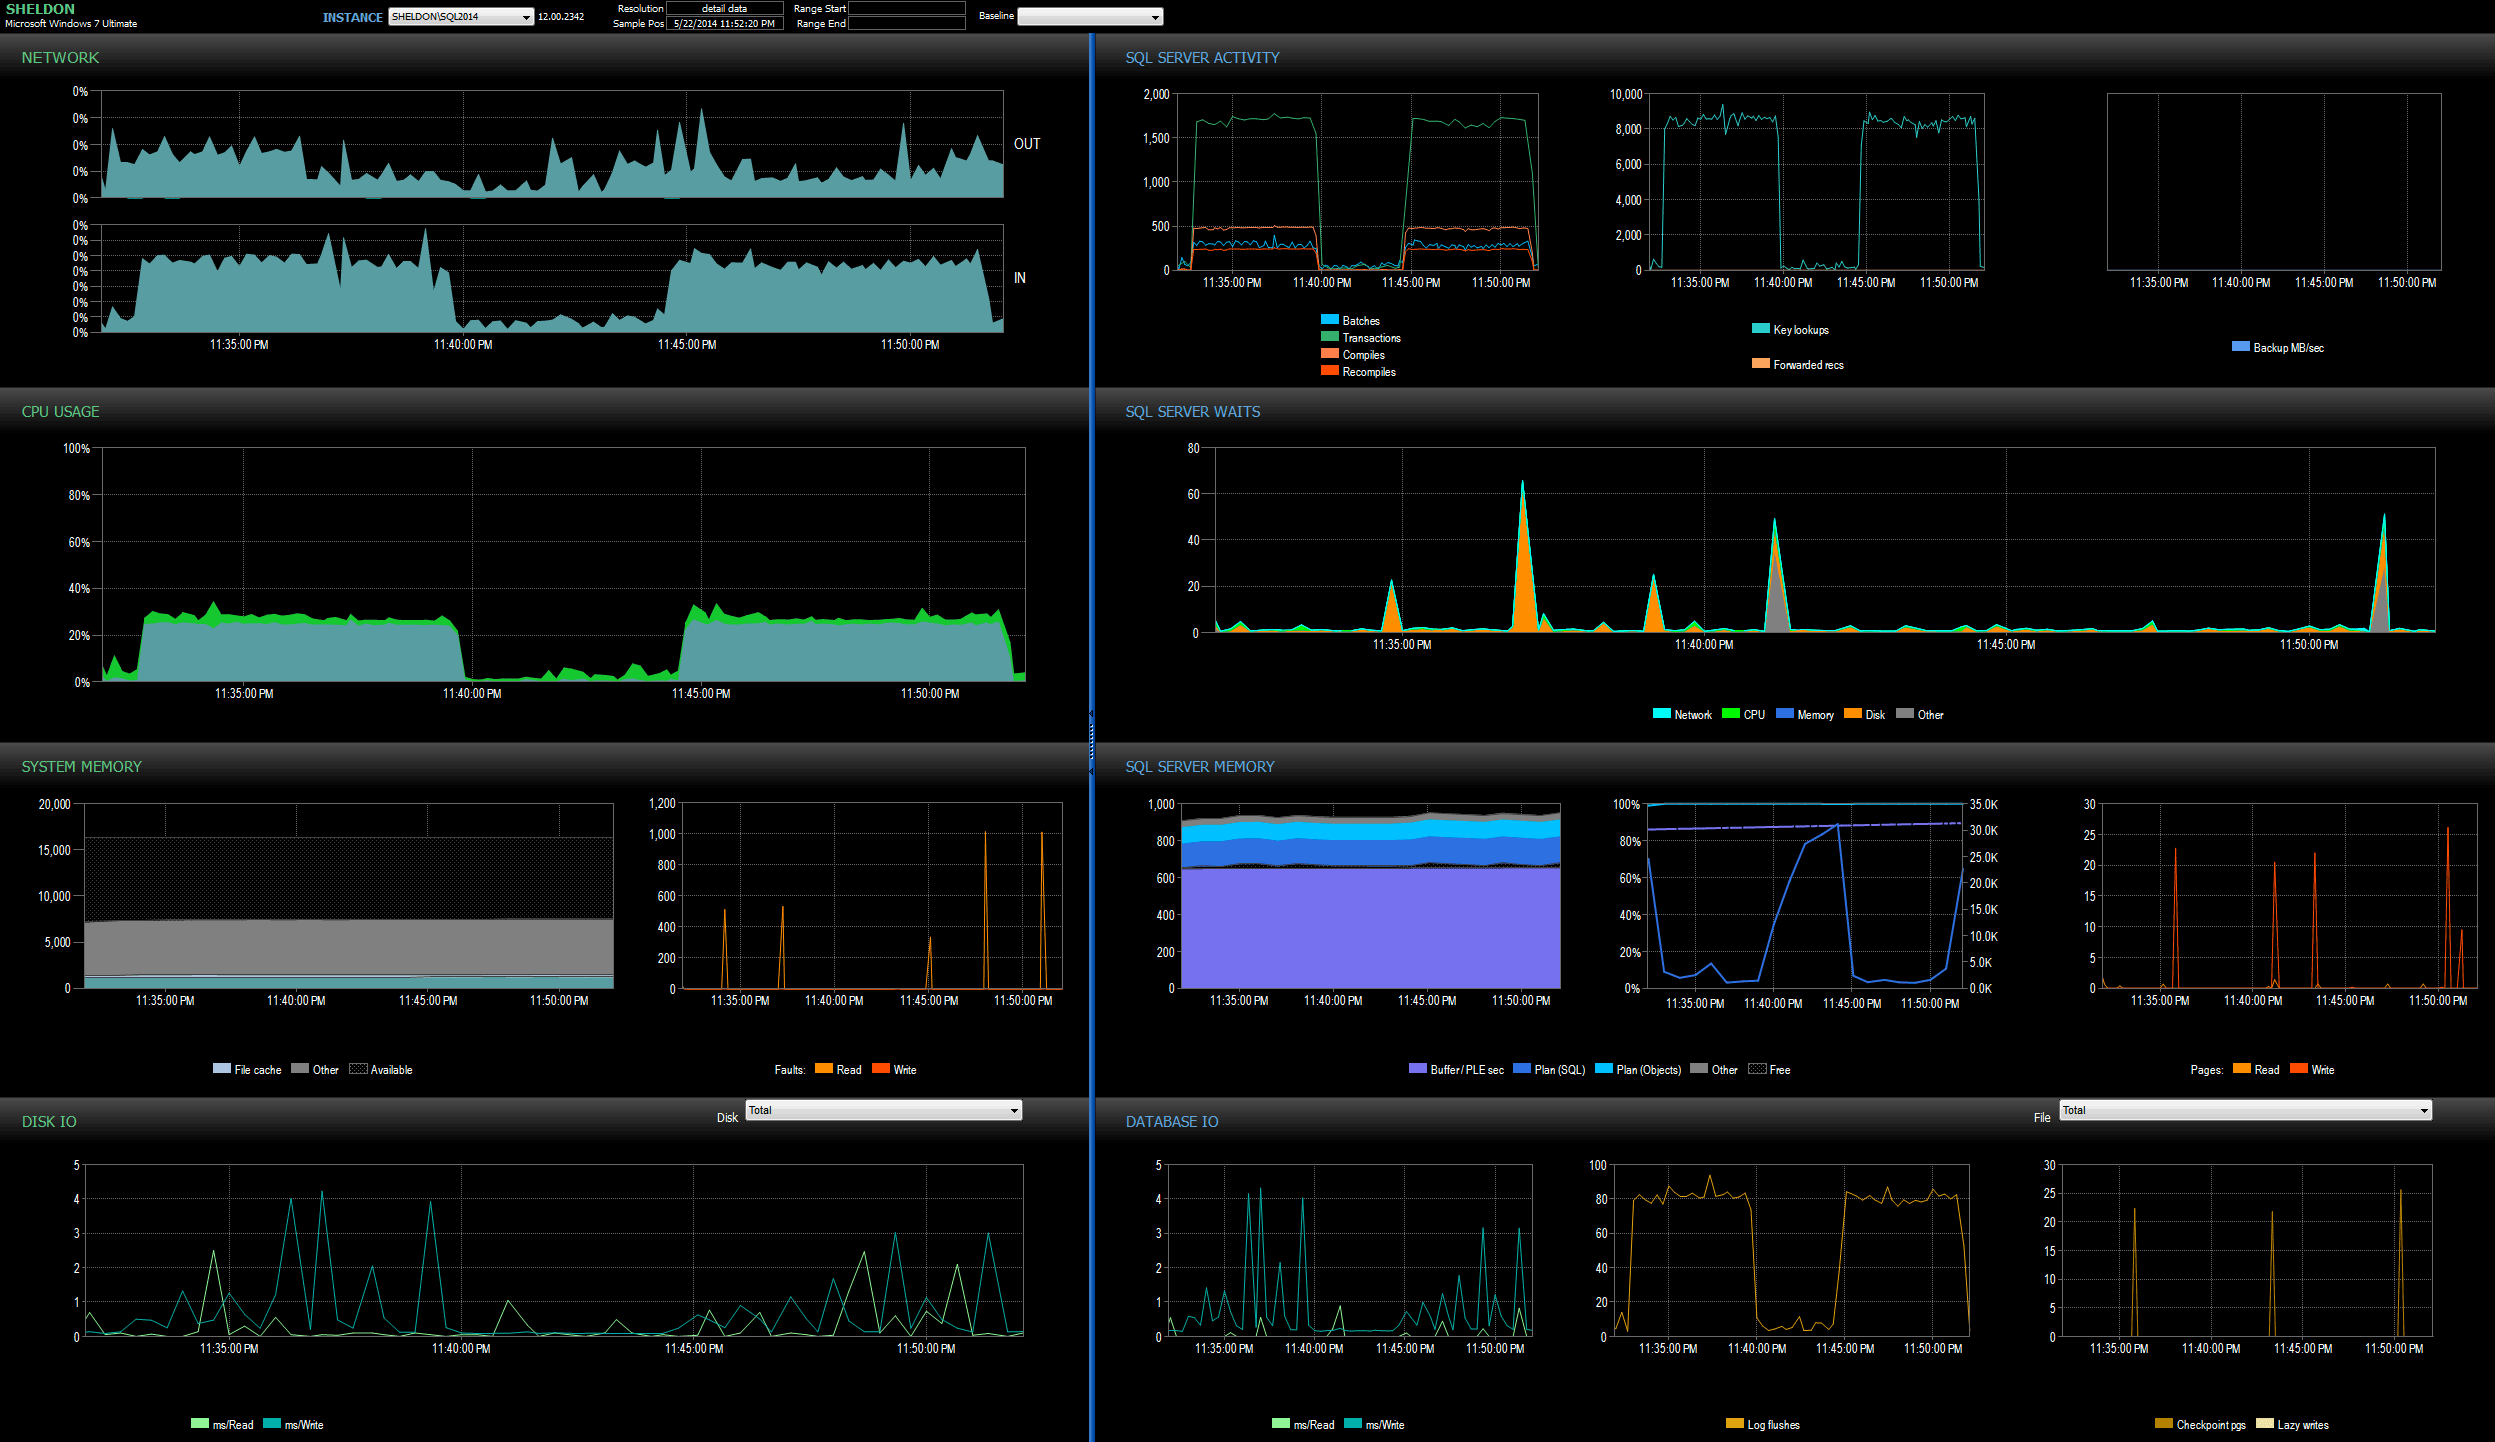
Alas, no, same results. Just over three minutes for the heap, and just under seven minutes for the clustered index. In order to dig deeper into where the extra time was being spent, I watched the 2014 instance with SQL Sentry, and ran just the clustered index batch without any Extended Events sessions configured. Then I ran the batch again, this time with the lighter XE session configured. The batch times were 5:47 (347 seconds) and 6:55 (415 seconds) – so very much in line with the previous batch (I was happy to see that our monitoring did not contribute any further to the duration :-)). I validated that no events were dropped, and again that no autogrow events occurred.
I looked at the SQL Sentry dashboard in history mode, which allowed me to quickly view the performance metrics of both batches side by side:

SQL Sentry dashboard, in history mode, showing both batches
Both batches were virtually identical in terms of network, CPU, transactions, compiles, key lookups, etc. There is some slight difference in the Waits – the spikes during the first batch were exclusively WRITELOG, while there were some minor CXPACKET waits found in the second batch. My working theory well after midnight is that perhaps a good portion of the delay observed was due to context switching caused by the Extended Events process. Since we don't have any visibility into exactly what XE is doing under the covers, nor do we know what underlying mechanics have changed in XE between 2012 and 2014, that's the story I'm going to stick with for now, until I am more comfortable with xperf and/or WinDbg.
Conclusion
In any event, it is clear that tracking #temp table creation is not free, and the cost may vary depending on the type of #temp tables you are creating, the amount of information you are collecting in your XE sessions, and even the version of SQL Server you are using. So you can run similar tests to what I have done here, and decide how valuable collecting this information is in your environment.


1 thought on “The overhead of #temp table creation tracking”
Comments are closed.