In my last post, I demonstrated that at small volumes, a memory-optimized TVP can deliver substantial performance benefits to typical query patterns.
To test at slightly higher scale, I made a copy of the SalesOrderDetailEnlarged table, which I had expanded to roughly 5,000,000 rows thanks to this script by Jonathan Kehayias (blog | @SQLPoolBoy)).
DROP TABLE dbo.SalesOrderDetailEnlarged;
GO

SELECT * INTO dbo.SalesOrderDetailEnlarged
  FROM AdventureWorks2012.Sales.SalesOrderDetailEnlarged; -- 4,973,997 rows

CREATE CLUSTERED INDEX PK_SODE
  ON dbo.SalesOrderDetailEnlarged(SalesOrderID, SalesOrderDetailID);
I also created three in-memory versions of this table, each with a different bucket count (fishing for a "sweet spot") – 16,384, 131,072, and 1,048,576. (You can use rounder numbers, but they get rounded up to the next power of 2 anyway.) Example:
CREATE TABLE [dbo].[SalesOrderDetailEnlarged_InMem_16K] -- and _131K and _1MM
(
	[SalesOrderID] [int] NOT NULL,
	[SalesOrderDetailID] [int] NOT NULL,
	[CarrierTrackingNumber] [nvarchar](25) COLLATE SQL_Latin1_General_CP1_CI_AS NULL,
	[OrderQty] [smallint] NOT NULL,
	[ProductID] [int] NOT NULL,
	[SpecialOfferID] [int] NOT NULL,
	[UnitPrice] [money] NOT NULL,
	[UnitPriceDiscount] [money] NOT NULL,
	[LineTotal] [numeric](38, 6) NOT NULL,
	[rowguid] [uniqueidentifier] NOT NULL,
	[ModifiedDate] [datetime] NOT NULL
 PRIMARY KEY NONCLUSTERED HASH
 (
	[SalesOrderID],
	[SalesOrderDetailID]
 ) WITH ( BUCKET_COUNT = 16384) -- and 131072 and 1048576
) WITH ( MEMORY_OPTIMIZED = ON , DURABILITY = SCHEMA_AND_DATA );
GO

INSERT dbo.SalesOrderDetailEnlarged_InMem_16K
  SELECT * FROM dbo.SalesOrderDetailEnlarged;

INSERT dbo.SalesOrderDetailEnlarged_InMem_131K
  SELECT * FROM dbo.SalesOrderDetailEnlarged;

INSERT dbo.SalesOrderDetailEnlarged_InMem_1MM
  SELECT * FROM dbo.SalesOrderDetailEnlarged;
GO
Notice I changed the bucket size from the previous example (256). When building the table, you want to pick the "sweet spot" for bucket size – you want to optimize the hash index for point lookups, meaning you want as many buckets as possible with as few rows in each bucket as possible. Of course if you create ~5 million buckets (since in this case, perhaps not a very good example, there are ~5 million unique combinations of values), you will have some memory utilization and garbage collection trade-offs to deal with. However if you try to stuff ~5 million unique values into 256 buckets, you're also going to experience some problems. In any case, this discussion goes way beyond the scope of my tests for this post.
To test against the standard table, I made similar stored procedures as in the previous tests:
CREATE PROCEDURE dbo.SODE_InMemory
  @InMemory dbo.InMemoryTVP READONLY
AS
BEGIN
  SET NOCOUNT ON;

  DECLARE @tn NVARCHAR(25);

  SELECT @tn = CarrierTrackingNumber
    FROM dbo.SalesOrderDetailEnlarged AS sode
    WHERE EXISTS (SELECT 1 FROM @InMemory AS t
    WHERE sode.SalesOrderID = t.Item);
END
GO

CREATE PROCEDURE dbo.SODE_Classic
  @Classic dbo.ClassicTVP READONLY
AS
BEGIN
  SET NOCOUNT ON;

  DECLARE @tn NVARCHAR(25);

  SELECT @tn = CarrierTrackingNumber
    FROM dbo.SalesOrderDetailEnlarged AS sode
    WHERE EXISTS (SELECT 1 FROM @Classic AS t
    WHERE sode.SalesOrderID = t.Item);
END
GO
So first, to look at the plans for, say, 1,000 rows being inserted into the table variables, and then running the procedures:
DECLARE @InMemory dbo.InMemoryTVP;
INSERT @InMemory SELECT TOP (1000) SalesOrderID
  FROM dbo.SalesOrderDetailEnlarged
  GROUP BY SalesOrderID ORDER BY NEWID();

DECLARE @Classic dbo.ClassicTVP;
INSERT @Classic SELECT Item FROM @InMemory;

EXEC dbo.SODE_Classic  @Classic  = @Classic;
EXEC dbo.SODE_InMemory @InMemory = @InMemory;
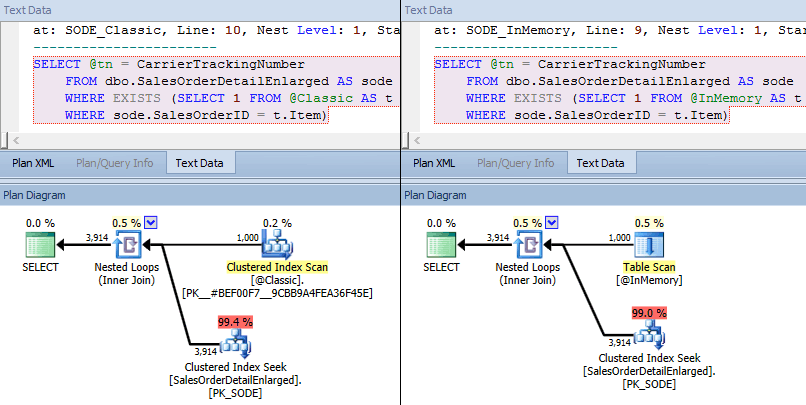
This time, we see that in both cases, the optimizer has chosen a clustered index seek against the base table and a nested loops join against the TVP. Some costing metrics are different, but otherwise the plans are quite similar:
 Similar plans for in-memory TVP vs. classic TVP at higher scale
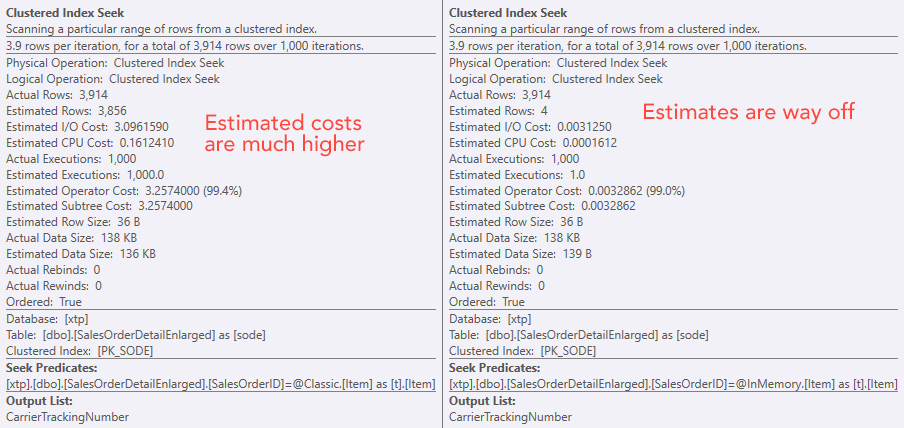
 Comparing seek operator costs – Classic on the left, In-Memory on the right
The absolute value of the costs makes it seem like the classic TVP would be a lot less efficient than the In-Memory TVP. But I wondered if this would be true in practice (especially since the Estimated Number of Executions figure on the right seemed suspect), so of course, I ran some tests. I decided to check against 100, 1,000, and 2,000 values to be sent to the procedure.
DECLARE @values INT = 100; -- 1000, 2000

DECLARE @Classic dbo.ClassicTVP;
DECLARE @InMemory dbo.InMemoryTVP;

INSERT @Classic(Item)
SELECT TOP (@values) SalesOrderID
  FROM dbo.SalesOrderDetailEnlarged
  GROUP BY SalesOrderID ORDER BY NEWID();

INSERT @InMemory(Item) SELECT Item FROM @Classic;

DECLARE @i INT = 1;

SELECT SYSDATETIME();

WHILE @i <= 10000
BEGIN
  EXEC dbo.SODE_Classic  @Classic  = @Classic;
  SET @i += 1;
END

SELECT SYSDATETIME();

SET @i = 1;

WHILE @i <= 10000
BEGIN
  EXEC dbo.SODE_InMemory @InMemory = @InMemory;
  SET @i += 1;
END

SELECT SYSDATETIME();
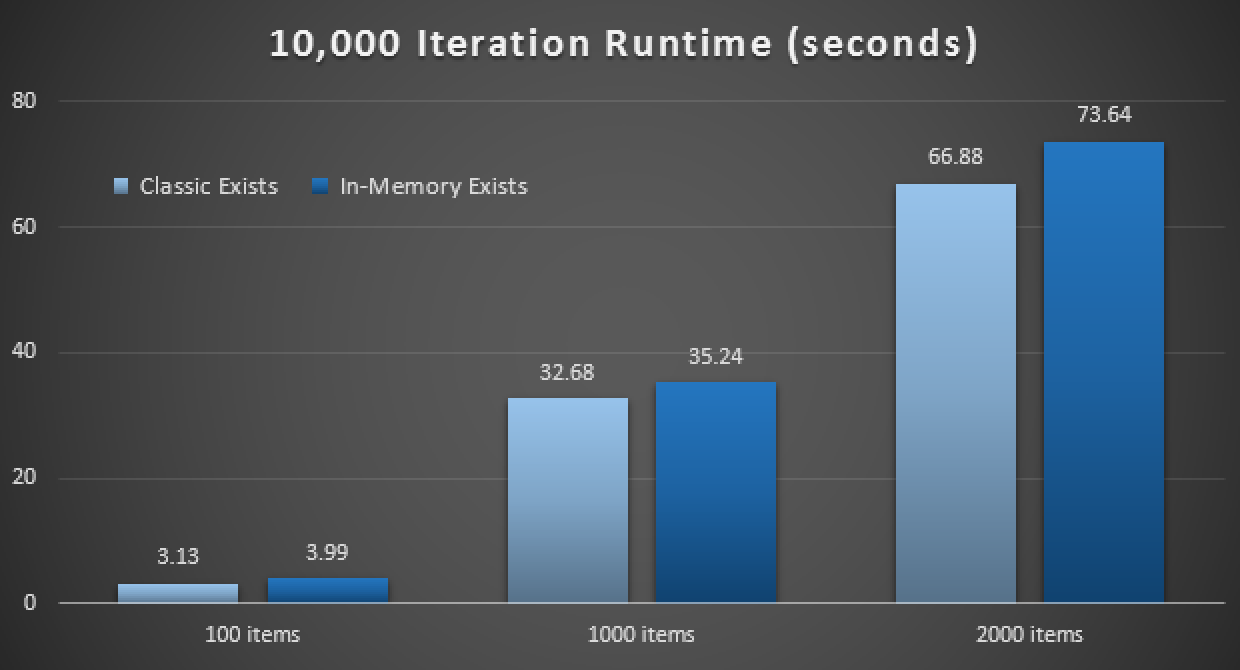
The performance results show that, at larger numbers of point lookups, using an In-Memory TVP leads to slightly diminishing returns, being slightly slower every time:

Results of 10,000 executions using classic and in-memory TVPs
So, contrary to the impression you may have taken from my previous post, using an in-memory TVP is not necessarily beneficial in all cases.
Earlier I also looked at natively compiled stored procedures and in-memory tables, in combination with in-memory TVPs. Could this make a difference here? Spoiler: absolutely not. I created three procedures like this:
CREATE PROCEDURE [dbo].[SODE_Native_InMem_16K] -- and _131K and _1MM
  @InMemory dbo.InMemoryTVP READONLY
WITH NATIVE_COMPILATION, SCHEMABINDING, EXECUTE AS OWNER
AS
  BEGIN ATOMIC WITH (TRANSACTION ISOLATION LEVEL = SNAPSHOT, LANGUAGE = N'us_english');

  DECLARE @tn NVARCHAR(25);

  SELECT @tn = CarrierTrackingNumber
    FROM dbo.SalesOrderDetailEnlarged_InMem_16K AS sode -- and _131K and _1MM
    INNER JOIN @InMemory AS t -- no EXISTS allowed here
    ON sode.SalesOrderID = t.Item;
END
GO
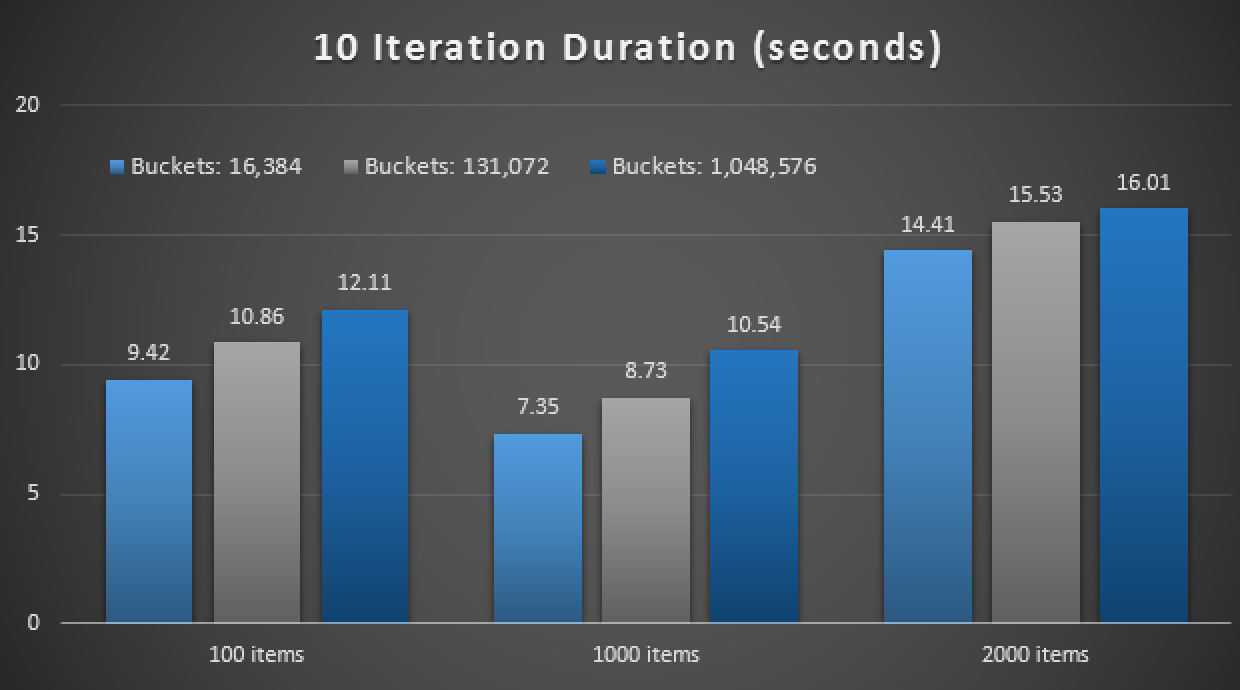
Another spoiler: I wasn't able to run these 9 tests with an iteration count of 10,000 - it took way too long. Instead I looped through and ran each procedure 10 times, ran that set of tests 10 times, and took the average. Here are the results:

Results of 10 executions using in-memory TVPs and natively compiled stored procedures
Overall, this experiment was rather disappointing. Just looking at the sheer magnitude of the difference, with an on-disk table, the average stored procedure call was completed in an average of 0.0036 seconds. However, when everything was using in-memory technologies, the average stored procedure call was 1.1662 seconds. Ouch. It is highly likely I have just chosen a poor use case to demo overall, but it seemed at the time to be an intuitive "first try."
Conclusion
There is plenty more to test around this scenario, and I have more blog posts to follow. I haven't yet identified the optimal use case for in-memory TVPs at a larger scale, but hope that this post serves as a reminder that even though a solution seems optimal in one case, it is never safe to assume it is equally applicable to different scenarios. This is exactly how In-Memory OLTP should be approached: as a solution with a narrow set of use cases that absolutely must be validated before implemented in production.


How could it take 1 second to look up 100 items in Hekaton tables? Something is wrong here… And why is 10x the amount of data faster? Is there some high startup cost to these tests?
Hi Tobi, I completely understand your apprehension. I can't fully explain why the lookups are so inefficient in this particular case, or why 1000 items optimizes better across the board compared to 100 or 2000. Another sweet spot?
As for high startup costs, they aren't involved with the tests themselves. I didn't measure the duration of clearing the cache, populating the base TVPs, or gathering metrics – the duration checks were directly before and after the stored procedure calls themselves. The only overhead there would be the loop scaffolding, but those were the same in every single test.
I can also assure you that this was not some one-off test gone wrong, or that I am running one test differently from others – I have run the same tests over and over again and in every scenario the results were quite linear to what I show above. Based on your comments I did a little more digging to see if I could figure out where the delays are coming from. I used an adaptation of Paul Randal's wait collection extended events session for each set of calls, added stats IO and stats time, and collated the results here:
HekatonTestResults.png
As you can see, the results here jive with what I showed in the article – the times for queries against the on-disk tables were negligible, while even single executions against the in-memory versions of the same table approached 1000+ ms. The time was not spent in parse/compile (though this isn't displayed for native procedures), stats I/O doesn't give any clues (perhaps a CTP2 limitation), and waits were limited to NETWORK_IO, WRITELOG and PAGEIOLATCH_EX (one more time, perhaps because in-memory-related wait types are not (yet) exposed to this particular extended events session). So no good clues there – the waits didn't even factor into the elapsed times of the stored procedures; I think all I was really able to capture were the waits associated with logging the event session data before stopping the session.
I also compared the plans, and there is nothing that really stands out…
Hekaton_Plans.sqlplan.zip
…except that the estimated number of rows for queries against the in-memory versions of the table happen to be exactly the number of buckets, even though the table scan shows an actual number of rows equal to the size of the table (4.7MM). This may cause some skew, and even though all queries output 428 rows in this specific test, the cost estimates (e.g. CPU) vary wildly. Again, since this is still CTP2, I'm not sure what information is still being left out of the execution plan (or at least not displayed in the graphical plan / tooltips). Please feel free to take a look at the plans and see if you can spot anything that I've missed.
Next step I suppose would be to dig into all of the xtp-related DMVs to track down what causes this to be slow, but in the meantime, my conclusion is going to remain the same: something about this scenario (be it bucket counts, key size, what have you) does not make it a good candidate. Which was kind of the whole point: demonstrating that Hekaton is not the answer to every single scenario. Keep in mind, too, that I've only touched on reads here, and only of a single query pattern, since the reporting queries etc. are the ones that usually have the highest scrutiny in terms of end user or pointy-haired boss perceptions. I'm sure the different logging mechanism will make for a better overall write workload too, but I did not even come close to inventing one and testing it here.
Ok, given the scrutiny that you have applied it is probably a performance bug. We are orders of magnitude away from expected performance levels.
Was the CPU loaded according to taskmgr or was it idle? In some cases I like to look at OS-reported CPU usage rather than SQL Server's metrics. That way we can differentiate between actual inefficient work and some kind of blocking/synchronization problem. I'm sure not all SQL Server internal mutex waits are reported in the DMV's.
In the interests of minimizing observer impact, I did not have any additional monitoring going on, but if I get a chance today I will try again.
Adding a bit of perfmon fun, I ran the tests again (100 items, 100 times each) and came up with the following graph. Sorry about all the free-hand and how busy it is, but it seems clear that the CPU profile is equivalent across the Hekaton tables regardless of what type of TVP is used – and I think this leads more to the fact that many point lookups simply does not scale.
Hekaton-CPU-Profile.png
I think this also answers a question from Klaus about whether in-memory TVPs generate log activity – the answer seems to be a resounding no, as the percent log used metric was flatlined; however, I did not measure tempdb activity so for all I know I'm a big liar and log is generated there for some reason.
The CPU was hot one one core. We could try to use sample-based profiling. Perfview makes that very easy. You just have to configure symbols, collect some data and look at the hot CPU call stacks. The call stack function names often tell what SQL Server did under the hood.
Is there a script I can easily use to repro the issue? I have a CTP 1 or 2 (can't remember) VM handy.
tobi, I'm just an observer here. If this isn't performing (and if it should be – after all, maybe my use case makes no sense whatsoever), it isn't really my job to fix it. :-) I am just pointing out that not all use cases are going to be automatic wins for Hekaton, and if the use case itself is going to guide whether there will be an improvement or not, then a lot of people are going to pick the wrong use cases. If you'd like to dig deeper and determine where the CPU is going wrong, then by all means, have fun. Unless you can convince Microsoft to fix whatever problems you find, though, I'm not sure where it gets anyone. My point is still simply that you can't just turn Hekaton on and sit back and watch your servers run faster.
Is the e-mail address you registered here with one I can use to send you materials to help you facilitate a repro?
Yes, the e-mail address is valid. I'll take a look.