
What Virtual Filestats Do, and Do Not, Tell You About I/O Latency
Background
One of the first things I look at when I'm troubleshooting a performance issue is wait statistics via the sys.dm_os_wait_stats DMV. To see what SQL Server is waiting on, I use the query from Glenn Berry’s current set of SQL Server Diagnostic Queries. Depending on the output, I start digging into specific areas within SQL Server.
As an example, if I see high CXPACKET waits I check the number of cores on the server, the number of NUMA nodes, and the values for max degree of parallelism and cost threshold for parallelism. This is background information that I use to understand the configuration. Before I even consider making any changes, I gather more quantitative data, as a system with CXPACKET waits does not necessarily have an incorrect setting for max degree of parallelism.
Similarly, a system that has high waits for I/O-related wait types such as PAGEIOLATCH_XX, WRITELOG, and IO_COMPLETION does not necessarily have an inferior storage subsystem. When I see I/O-related wait types as the top waits, I immediately want to understand more about the underlying storage. Is it direct-attached storage or a SAN? What is the RAID level, how many disks exist in the array, and what are the speed of the disks? I also want to know if other files or databases share the storage. And while it's important to understand the configuration, a logical next step is to look at virtual file stats via the sys.dm_io_virtual_file_stats DMV.
Introduced in SQL Server 2005, this DMV is a replacement for the fn_virtualfilestats function that those of you who ran on SQL Server 2000 and earlier probably know and love. The DMV contains cumulative I/O information for each database file, but the data resets on instance restart, when a database is closed, taken offline, detached and reattached, etc. It's critical to understand that virtual file stats data is not representative of current performance – it is a snapshot that is an aggregation of I/O data since the last clearing by one of the aforementioned events. Even though the data is not point-in-time, it can still be useful. If the highest waits for an instance are I/O-related, but the average wait time is less than 10 ms, storage is probably not an issue – but correlating the output with what you see in sys.dm_io_virtual_stats is still worthwhile to confirm low latencies. Further, even if you see high latencies in sys.dm_io_virtual_stats, you still haven’t proven that storage is a problem.
The Setup
To look at virtual file stats, I set up two copies of the AdventureWorks2012 database, which you can download from Codeplex. For the first copy, hereafter known as EX_AdventureWorks2012, I ran Jonathan Kehayias' script to expand the Sales.SalesOrderHeader and Sales.SalesOrderDetail tables to 1.2 million and 4.9 million rows, respectively. For the second database, BIG_AdventureWorks2012, I used the script from my previous partitioning post to create a copy of the Sales.SalesOrderHeader table with 123 million rows. Both databases were stored on an external USB drive (Seagate Slim 500GB), with tempdb on my local disk (SSD).
Before testing, I created four custom stored procedures in each database (Create_Custom_SPs.zip), which would serve as my "normal" workload. My testing process was as follows for each database:
- Restart the instance.
- Capture virtual file stats.
- Run the "normal" workload for two minutes (procedures called repeatedly via a PowerShell script).
- Capture virtual file stats.
- Rebuild all indexes for the appropriate SalesOrder table(s).
- Capture virtual file stats.
The Data
To capture virtual file stats, I created a table to hold historical information, and then used a variation of Jimmy May's query from his DMV All-Stars script for the snapshot:
USE [msdb];
GO

CREATE TABLE [dbo].[SQLskills_FileLatency]
(
	[RowID] [INT] IDENTITY(1,1) NOT NULL,
	[CaptureID] [INT] NOT NULL,
	[CaptureDate] [DATETIME2](7) NULL,
	[ReadLatency] [BIGINT] NULL,
	[WriteLatency] [BIGINT] NULL,
	[Latency] [BIGINT] NULL,
	[AvgBPerRead] [BIGINT] NULL,
	[AvgBPerWrite] [BIGINT] NULL,
	[AvgBPerTransfer] [BIGINT] NULL,
	[Drive] [NVARCHAR](2) NULL,
	[DB] [NVARCHAR](128) NULL,
	[database_id] [SMALLINT] NOT NULL,
	[file_id] [SMALLINT] NOT NULL,
	[sample_ms] [INT] NOT NULL,
	[num_of_reads] [BIGINT] NOT NULL,
	[num_of_bytes_read] [BIGINT] NOT NULL,
	[io_stall_read_ms] [BIGINT] NOT NULL,
	[num_of_writes] [BIGINT] NOT NULL,
	[num_of_bytes_written] [BIGINT] NOT NULL,
	[io_stall_write_ms] [BIGINT] NOT NULL,
	[io_stall] [BIGINT] NOT NULL,
	[size_on_disk_MB] [NUMERIC](25, 6) NULL,
	[file_handle] [VARBINARY](8) NOT NULL,
	[physical_name] [NVARCHAR](260) NOT NULL
) ON [PRIMARY];
GO

CREATE CLUSTERED INDEX CI_SQLskills_FileLatency ON [dbo].[SQLskills_FileLatency] ([CaptureDate], [RowID]);

CREATE NONCLUSTERED INDEX NCI_SQLskills_FileLatency ON [dbo].[SQLskills_FileLatency] ([CaptureID]);

DECLARE @CaptureID INT;

SELECT @CaptureID = MAX(CaptureID) FROM [msdb].[dbo].[SQLskills_FileLatency];

PRINT (@CaptureID);

IF @CaptureID IS NULL
BEGIN
  SET @CaptureID = 1;
END
ELSE
BEGIN
  SET @CaptureID = @CaptureID + 1;
END

INSERT INTO [msdb].[dbo].[SQLskills_FileLatency]
(
	[CaptureID],
	[CaptureDate],
	[ReadLatency],
	[WriteLatency],
	[Latency],
	[AvgBPerRead],
	[AvgBPerWrite],
	[AvgBPerTransfer],
	[Drive],
	[DB],
	[database_id],
	[file_id],
	[sample_ms],
	[num_of_reads],
	[num_of_bytes_read],
	[io_stall_read_ms],
	[num_of_writes],
	[num_of_bytes_written],
	[io_stall_write_ms],
	[io_stall],
	[size_on_disk_MB],
	[file_handle],
	[physical_name]
)
SELECT
    --virtual file latency
	@CaptureID,
	GETDATE(),
	CASE
		WHEN [num_of_reads] = 0
			THEN 0
		ELSE ([io_stall_read_ms]/[num_of_reads])
	END [ReadLatency],
	CASE
		WHEN [io_stall_write_ms] = 0
			THEN 0
		ELSE ([io_stall_write_ms]/[num_of_writes])
	END [WriteLatency],
	CASE
		WHEN ([num_of_reads] = 0 AND [num_of_writes] = 0)
             THEN 0
		ELSE ([io_stall]/([num_of_reads] + [num_of_writes]))
	END [Latency],
	--avg bytes per IOP
	CASE
		WHEN [num_of_reads] = 0
			THEN 0
		ELSE ([num_of_bytes_read]/[num_of_reads])
	END [AvgBPerRead],
	CASE
		WHEN [io_stall_write_ms] = 0
			THEN 0
		ELSE ([num_of_bytes_written]/[num_of_writes])
	END [AvgBPerWrite],
	CASE
		WHEN ([num_of_reads] = 0 AND [num_of_writes] = 0)
			THEN 0
		ELSE (([num_of_bytes_read] + [num_of_bytes_written])/([num_of_reads] + [num_of_writes]))
	END [AvgBPerTransfer],
	LEFT([mf].[physical_name],2) [Drive],
	DB_NAME([vfs].[database_id]) [DB],
	[vfs].[database_id],
	[vfs].[file_id],
	[vfs].[sample_ms],
	[vfs].[num_of_reads],
	[vfs].[num_of_bytes_read],
	[vfs].[io_stall_read_ms],
	[vfs].[num_of_writes],
	[vfs].[num_of_bytes_written],
	[vfs].[io_stall_write_ms],
	[vfs].[io_stall],
	[vfs].[size_on_disk_bytes]/1024/1024. [size_on_disk_MB],
	[vfs].[file_handle],
	[mf].[physical_name]
FROM [sys].[dm_io_virtual_file_stats](NULL,NULL) AS vfs
JOIN [sys].[master_files] [mf]
    ON [vfs].[database_id] = [mf].[database_id]
    AND [vfs].[file_id] = [mf].[file_id]
ORDER BY [Latency] DESC;
I restarted the instance and then immediately captured file stats. When I filtered the output to only view the EX_AdventureWorks2012 and tempdb database files, only tempdb data was captured as no data had been requested from the EX_AdventureWorks2012 database:

Output from initial capture of sys.dm_os_virtual_file_stats
I then ran the "normal" workload for two minutes (the number of executions of each stored procedure varied slightly), and after it completed captured file stats again:

Output from sys.dm_os_virtual_file_stats after normal workload
We see a latency of 57ms for the EX_AdventureWorks2012 data file. Not ideal, but over time with my normal workload, this would probably even out. There is minimal latency for tempdb, which is expected as the workload I ran doesn’t generate much tempdb activity. Next I rebuilt all indexes for the Sales.SalesOrderHeaderEnlarged and Sales.SalesOrderDetailEnlarged tables:
USE [EX_AdventureWorks2012];
GO
ALTER INDEX ALL ON Sales.SalesOrderHeaderEnlarged REBUILD;
ALTER INDEX ALL ON Sales.SalesOrderDetailEnlarged REBUILD;
The rebuilds took less than a minute, and notice the spike in read latency for the EX_AdventureWorks2012 data file, and the spikes in write latency for the EX_AdventureWorks2012 data and log files:

Output from sys.dm_os_virtual_file_stats after index rebuild
According to that snapshot of file stats, latency is horrible; over 600ms for writes! If I saw this value for a production system it would be easy to immediately suspect problems with storage. However, it's also worth noting that AvgBPerWrite increased as well, and bigger block writes take longer to complete. The AvgBPerWrite increase is expected for the index rebuild task.
Understand that as you look at this data, you are not getting a complete picture. A better way to look at latencies using virtual file stats is to take snapshots and then calculate latency for the elapsed time period. For example, the script below uses two snapshots (Current and Previous) and then calculates the number of reads and writes in that time period, the difference in io_stall_read_ms and io_stall_write_ms values, and then divides io_stall_read_ms delta by number of reads, and io_stall_write_ms delta by number of writes. With this method, we calculate the amount of time SQL Server was waiting on I/O for reads or writes, and then divide it by the number of reads or writes to determine latency.
DECLARE @CurrentID INT, @PreviousID INT;
SET @CurrentID = 3;
SET @PreviousID = @CurrentID - 1;

WITH [p] AS (	SELECT
				[CaptureDate],
				[database_id],
				[file_id],
				[ReadLatency],
				[WriteLatency],
				[num_of_reads],
				[io_stall_read_ms],
				[num_of_writes],
				[io_stall_write_ms]
			FROM [msdb].[dbo].[SQLskills_FileLatency]
			WHERE [CaptureID] = @PreviousID
		)
SELECT
	[c].[CaptureDate] [CurrentCaptureDate],
	[p].[CaptureDate] [PreviousCaptureDate],
	DATEDIFF(MINUTE, [p].[CaptureDate], [c].[CaptureDate]) [MinBetweenCaptures],
	[c].[DB],
	[c].[physical_name],
	[c].[ReadLatency] [CurrentReadLatency],
	[p].[ReadLatency] [PreviousReadLatency],
	[c].[WriteLatency] [CurrentWriteLatency],
	[p].[WriteLatency] [PreviousWriteLatency],
	[c].[io_stall_read_ms]- [p].[io_stall_read_ms] [delta_io_stall_read],
	[c].[num_of_reads] - [p].[num_of_reads] [delta_num_of_reads],
	[c].[io_stall_write_ms] - [p].[io_stall_write_ms] [delta_io_stall_write],
	[c].[num_of_writes] - [p].[num_of_writes] [delta_num_of_writes],
	CASE
		WHEN ([c].[num_of_reads] - [p].[num_of_reads]) = 0 THEN NULL
		ELSE ([c].[io_stall_read_ms] - [p].[io_stall_read_ms])/([c].[num_of_reads] - [p].[num_of_reads])
	END [IntervalReadLatency],
	CASE
		WHEN ([c].[num_of_writes] - [p].[num_of_writes]) = 0 THEN NULL
		ELSE ([c].[io_stall_write_ms] - [p].[io_stall_write_ms])/([c].[num_of_writes] - [p].[num_of_writes])
	END [IntervalWriteLatency]
FROM [msdb].[dbo].[SQLskills_FileLatency] [c]
JOIN [p] ON [c].[database_id] = [p].[database_id] AND [c].[file_id] = [p].[file_id]
WHERE [c].[CaptureID] = @CurrentID
AND [c].[database_id] IN (2, 11);
When we execute this to calculate latency during the index rebuild, we get the following:

Latency calculated from sys.dm_io_virtual_file_stats during index rebuild for EX_AdventureWorks2012
Now we can see that the actual latency during that time was high – which we would expect. And if we then went back to our normal workload and ran it for a few hours, the average values calculated from virtual file stats would decrease over time. In fact, if we look at PerfMon data which was captured during the test (and then processed through PAL), we see significant spikes in Avg. Disk sec/Read and Avg. Disk sec/Write which correlates to the time that the index rebuild was running. But at other times, the latency values are well below acceptable values:
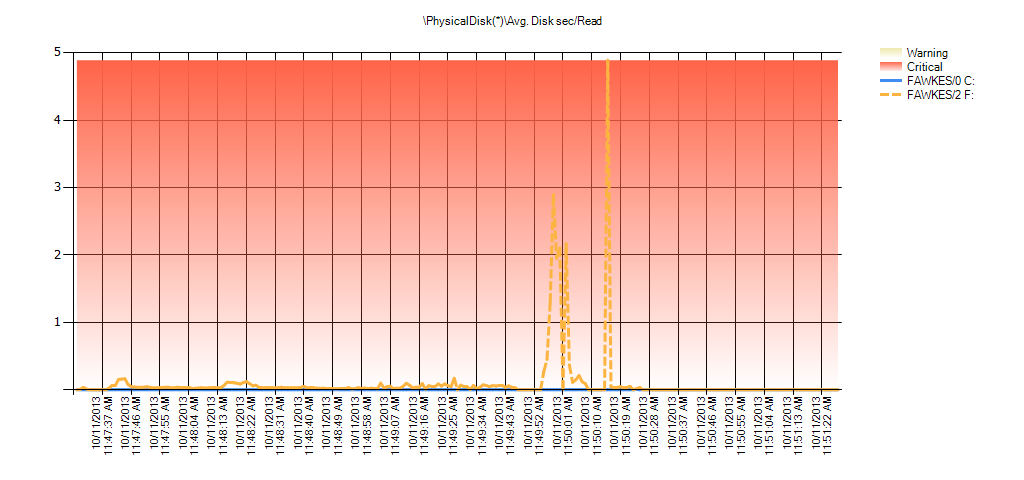
Summary of Avg Disk Sec/Read from PAL for EX_AdventureWorks2012 during testing
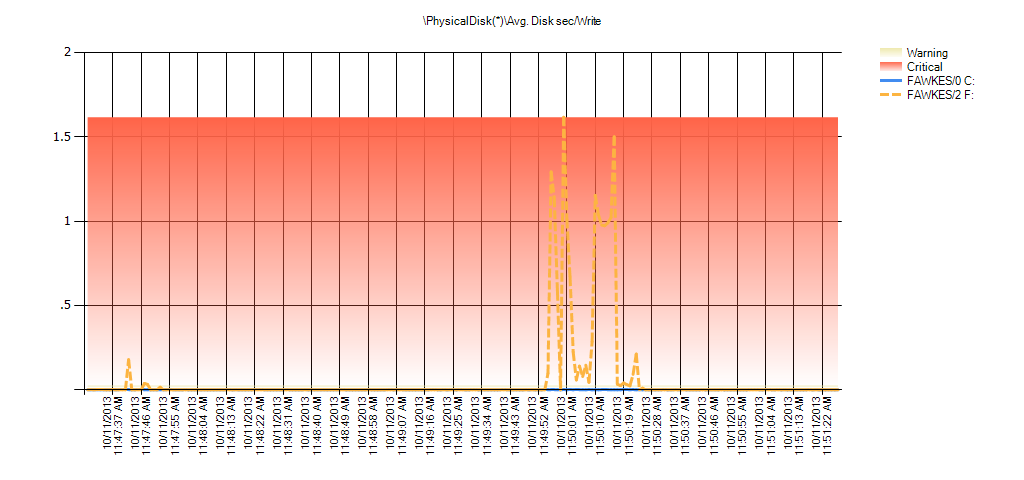
Summary of Avg Disk Sec/Write from PAL for EX_AdventureWorks2012 during testing
You can see the same behavior for the BIG_AdventureWorks 2012 database. Here is the latency information based on the virtual file stats snapshot before the index rebuild and after:

Latency calculated from sys.dm_io_virtual_file_stats during index rebuild for BIG_AdventureWorks2012
And Performance Monitor data shows the same spikes during the rebuild:
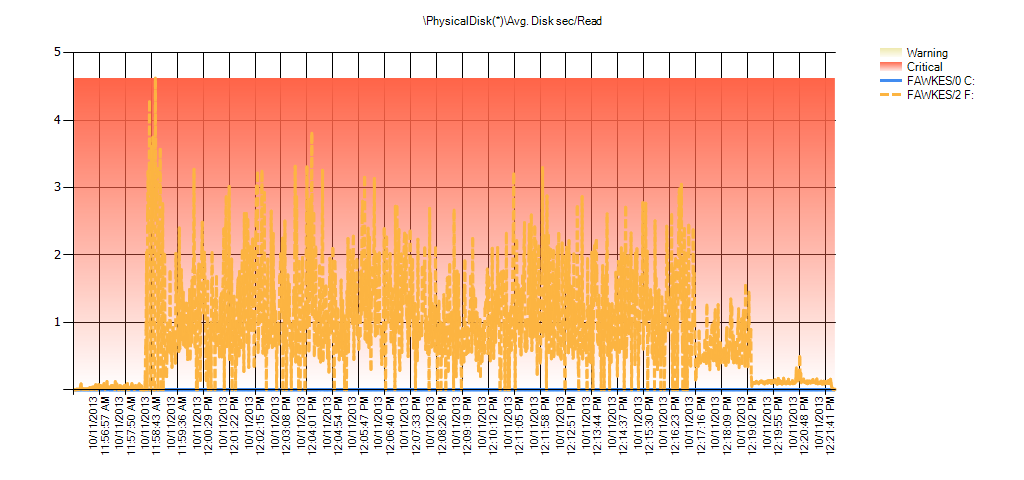
Summary of Avg Disk Sec/Read from PAL for BIG_AdventureWorks2012 during testing
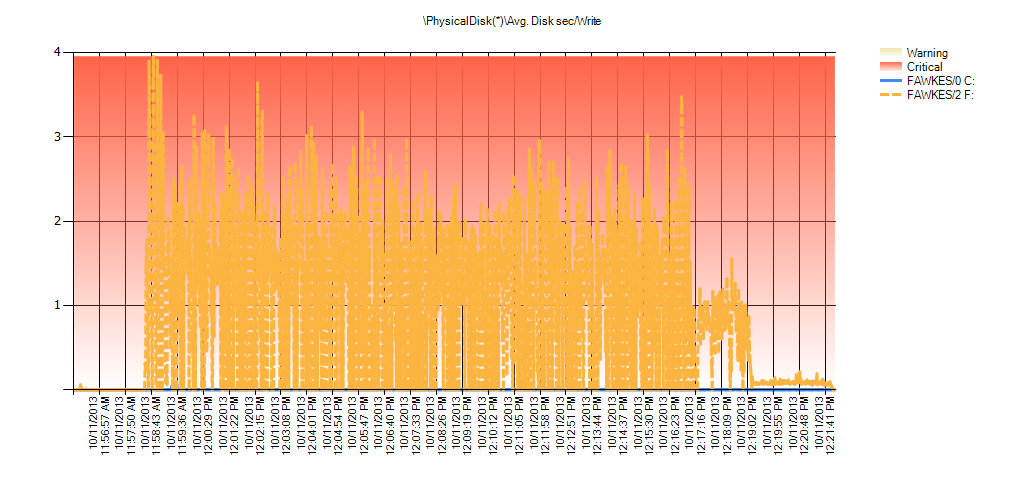
Summary of Avg Disk Sec/Write from PAL for BIG_AdventureWorks2012 during testing
Conclusion
Virtual file stats are a great starting point when you want to understand I/O performance for a SQL Server instance. If you see I/O-related waits when looking at wait statistics, looking at sys.dm_io_virtual_file_stats is a logical next step. However, understand that the data you're viewing is an aggregate since the stats last cleared by one of the associated events (instance restart, offline of database, etc). If you see low latencies, then the I/O subsystem is keeping up with the performance load. However, if you see high latencies, it's not a foregone conclusion that storage is a problem. To really know what's going on you can start to snapshot file stats, as shown here, or you can simply use Performance Monitor to look at latency in real time. It's very easy to create a Data Collector Set in PerfMon that captures the Physical Disk counters Avg. Disk Sec/Read and Avg. Disk Sec/Read for all disks that host database files. Schedule the Data Collector to start and stop on a regular basis, and sample every n seconds (e.g. 15), and once you've captured PerfMon data for an appropriate time, run it through PAL to examine latency over time.
If you do find that I/O latency occurs during your normal workload, and not just during maintenance tasks that drive I/O, you still cannot point to storage as the underlying problem. Storage latency can exist for a variety of reasons, such as:
- SQL Server has to read too much data as a result of inefficient query plans or missing indexes
- Too little memory is allocated to the instance and the same data is read from disk over and over because it cannot stay in memory
- Implicit conversions cause index or table scans
- Queries perform SELECT * when not all columns are required
- Forwarded record problems in heaps cause additional I/O
- Low page densities from index fragmentation, page splits, or incorrect fill factor settings cause additional I/O
Whatever the root cause, what's essential to understand about performance – particularly as it relates to I/O – is that there is rarely one data point that you can use to pinpoint the problem. Finding the true issue takes multiple facts that, when pieced together, help you uncover the problem.
Finally, note that in some cases the storage latency may be completely acceptable. Before you demand faster storage or changes to code, review the workload patterns and Service Level Agreement (SLA) for the database. In the case of a Data Warehouse that services reports to users, the SLA for queries is probably not the same sub-second values you would expect for a high-volume OLTP system. In the DW solution, I/O latencies greater than one second might be perfectly acceptable and expected. Understand the expectations of the business and its users, and then determine what action, if any, to take. And if changes are required, gather the quantitative data you need to support your argument, namely wait statistics, virtual file statistics, and latencies from Performance Monitor.
11 thoughts on “What Virtual Filestats Do, and Do Not, Tell You About I/O Latency”
Comments are closed.

I agree simply looking at sys.dm_os_virtual_file_stats is the first step however the difficulty I'm having is comparing 15 seconds snapshots of sys.dm_os_virtual_file_stats vs perfmon. For my initial test perfmon indicated high disk io at specific times yet sys.dm_os_virtual_file_stats didn't show that.
Hi-
Did you confirm that there are no other non-database files on the same disk? Remember that PerfMon is capturing IO at the disk level, and dm_os_virtual_file_stats is capturing it at the database file level. If you have other files, that are not database files, on the same disk, and they are generating IO, that will be reflected in PerfMon but not in dm_os_virtual_file_stats.
Hope that helps,
Erin
These LUNs or Disks are dedicated to database systems now of course they are shared by SQL , Oracle, DB2, etc. My thought and corret me if I'm wroing is using dm_os_virtual_file_stats to identify potential bottlenecks regarding high disk latency. If I see that then leverage perfmon to isolate specific patterns of disk latency to really identify the problem. When I ran my test I expected to see high latency in dmv but i didn't that is what confused me.
thanks for your response…
I really think it depends on how high the read/write latencies are. Let's say the box is up for 100 days and on your tempdb data files you see 1000 write latency. Sure, it's an aggregated average but that means something at some point caused that 1000 to happen. You aren't likely to tune your way out of those numbers.
The shared SAN model is really bad. I believe Erin is also saying that wait stats be included. Are you seeing high PAGEIOLATCH or WRITELOG waits in conjunction with your database file latencies?
Agreed, sometimes you can't tune because the values spike due to maintenance tasks like rebuilds or CHECKDB. Those are designed to drive IO and I don't want to throttle them back just to keep my latencies low. The goal is to figure out when those latencies are increasing, with the snapshots, and then dig in from there.
I forgot to say nice article. I like your writing style and you PS courses are great also. Any on the way – PS courses? Thanks again Erin.
Erin
one of my managers asked if we could measure the disk usage and I thought of virtualfile io – You have been a life saver as you have saved me the task of running a snapshot …
Respect and
exec thank you ;
go 10000;
Thanks Mark, glad it helped!
Hi Erin,
I was using the script below (also by Jimmy May) to look at IO latencies at the drive/volume level and was getting very high latency for the tempdb drive (close to 1,000 ms/transfer).
I then read your post and realized I was misinterpreting the results and should be looking at differentials over time, not the absolute values.
My question is, could high virtual-file-io-stats values signify fragmentation at the file level, as opposed to disk latency per se?
A highly fragmented data file, for example, could be an IO bottleneck even on a disk with no IO issues.
Thank you for this post,
Marios
PS. Here is the script I was using – taken from Glen Berry's script library
–http://www.sqlskills.com/blogs/glenn/sql-server-diagnostic-information-queries-for-january-2016/
— Drive level latency information (Query 22) (Drive Level Latency)
— Based on code from Jimmy May
SELECT
tab.[Drive],
tab.volume_mount_point AS [Volume Mount Point],
CASE
WHEN num_of_reads = 0 THEN 0
ELSE (io_stall_read_ms/num_of_reads)
END AS [Read Latency (ms/Read)],
CASE
WHEN io_stall_write_ms = 0 THEN 0
ELSE (io_stall_write_ms/num_of_writes)
END AS [Write Latency (ms/Write)],
CASE
WHEN (num_of_reads = 0 AND num_of_writes = 0) THEN 0
ELSE (io_stall/(num_of_reads + num_of_writes))
END AS [Overall Latency (ms/Transfer)],
CASE
WHEN num_of_reads = 0 THEN 0
ELSE (num_of_bytes_read/num_of_reads)
END AS [Avg Bytes/Read],
CASE
WHEN io_stall_write_ms = 0 THEN 0
ELSE (num_of_bytes_written/num_of_writes)
END AS [Avg Bytes/Write],
CASE
WHEN (num_of_reads = 0 AND num_of_writes = 0) THEN 0
ELSE ((num_of_bytes_read + num_of_bytes_written)/(num_of_reads + num_of_writes))
END AS [Avg Bytes/Transfer]
FROM
(
SELECT
LEFT(UPPER(mf.physical_name), 2) AS Drive,
SUM(num_of_reads) AS num_of_reads,
SUM(io_stall_read_ms) AS io_stall_read_ms,
SUM(num_of_writes) AS num_of_writes,
SUM(io_stall_write_ms) AS io_stall_write_ms,
SUM(num_of_bytes_read) AS num_of_bytes_read,
SUM(num_of_bytes_written) AS num_of_bytes_written,
SUM(io_stall) AS io_stall,
vs.volume_mount_point
FROM
sys.dm_io_virtual_file_stats(NULL, NULL) AS vfs
INNER JOIN
sys.master_files AS mf WITH (NOLOCK)
ON
vfs.database_id = mf.database_id
AND vfs.[file_id] = mf.[file_id]
CROSS APPLY
sys.dm_os_volume_stats(mf.database_id, mf.[file_id]) AS vs
GROUP BY
LEFT(UPPER(mf.physical_name), 2), vs.volume_mount_point
) AS tab
ORDER BY
[Overall Latency (ms/Transfer)] DESC
OPTION (RECOMPILE);
— Shows you the drive-level latency for reads and writes, in milliseconds
— Latency above 20-25ms is usually a problem
Hi Marios-
So can you explain what you mean by "high virtual-file-io-stats values" – specifically, what column of the output is high? Is it number of IOs, is it total bytes of IO, is it the latency value itself? I ask because yes, a high number of IOs *could* indicate a fragmentation issue in an index. Meaning, the index is highly fragmented because there are pages that are out of order and pages that are not full, so reading data from the index takes more IO requests. But, that is not exactly the same as "fragmentation at the disk level". When you say "fragmentation at the disk level," then I think of a spinning disk and having the pages for an object spread around to different sectors on the disk. But for most environments nowadays (e.g. those with SAN solutions), this type of fragmentation isn't an issue. If you're thinking of direct attached storage with not very many disks in a RAID array, then I suppose you could have file fragmentation that affects performance.
Erin