There are two complementary skills that are very useful in query tuning. One is the ability to read and interpret execution plans. The second is knowing a bit about how the query optimizer works to translate SQL text into an execution plan. Putting the two things together can help us spot times when an expected optimization was not applied, resulting in an execution plan that is not as efficient as it could be. The lack of documentation around exactly which optimizations SQL Server can apply (and in what circumstances) means that a lot of this comes down to experience, however.
An Example
The sample query for this article is based on question asked by SQL Server MVP Fabiano Amorim a few months ago, based on a real-world problem he encountered. The schema and test query below is a simplification of the real situation, but it retains all the important features.
CREATE TABLE dbo.T1 (pk integer PRIMARY KEY, c1 integer NOT NULL);
CREATE TABLE dbo.T2 (pk integer PRIMARY KEY, c1 integer NOT NULL);
CREATE TABLE dbo.T3 (pk integer PRIMARY KEY, c1 integer NOT NULL);
GO
CREATE INDEX nc1 ON dbo.T1 (c1);
CREATE INDEX nc1 ON dbo.T2 (c1);
CREATE INDEX nc1 ON dbo.T3 (c1);
GO
CREATE VIEW dbo.V1
AS
    SELECT c1 FROM dbo.T1
    UNION ALL
    SELECT c1 FROM dbo.T2
    UNION ALL
    SELECT c1 FROM dbo.T3;
GO
-- The test query
SELECT MAX(c1)
FROM dbo.V1;
Test 1 – 10,000 rows, SQL Server 2005+
The specific table data does not really matter for these tests. The following queries simply load 10,000 rows from a numbers table to each of the three test tables:
INSERT dbo.T1 (pk, c1)
SELECT n, n
FROM dbo.Numbers AS N
WHERE n BETWEEN 1 AND 10000;

INSERT dbo.T2 (pk, c1)
SELECT pk, c1 FROM dbo.T1;

INSERT dbo.T3 (pk, c1)
SELECT pk, c1 FROM dbo.T1;
With the data loaded, the execution plan produced for the test query is:
SELECT MAX(c1) FROM dbo.V1;
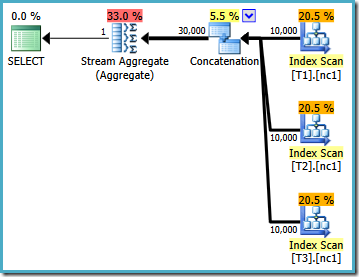
This execution plan is a pretty direct implementation of the logical SQL query (after the view reference V1 is expanded). The optimizer sees the query after view expansion, almost as if the query had been written out in full:
SELECT MAX(c1)
FROM
(
    SELECT c1 FROM dbo.T1
    UNION ALL
    SELECT c1 FROM dbo.T2
    UNION ALL
    SELECT c1 FROM dbo.T3
) AS V1;
Comparing the expanded text to the execution plan, the directness of the query optimizer’s implementation is clear. There is an Index Scan for each read of the base tables, a Concatenation operator to implement the UNION ALL, and a Stream Aggregate for the final MAX aggregate.
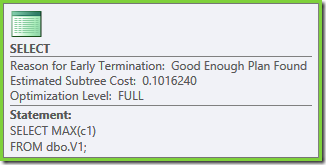
The execution plan properties show that cost-based optimization was started (optimization level is FULL), but that it terminated early because a ‘good enough’ plan was found. The estimated cost of the selected plan is 0.1016240 magic optimizer units.
Test 2 – 50,000 rows, SQL Server 2008 and 2008 R2
Run the following script to reset the test environment to run with 50,000 rows:
TRUNCATE TABLE dbo.T1;
TRUNCATE TABLE dbo.T2;
TRUNCATE TABLE dbo.T3;

INSERT dbo.T1 (pk, c1)
SELECT n, n
FROM dbo.Numbers AS N
WHERE n BETWEEN 1 AND 50000;

INSERT dbo.T2 (pk, c1)
SELECT pk, c1 FROM dbo.T1;

INSERT dbo.T3 (pk, c1)
SELECT pk, c1 FROM dbo.T1;

SELECT MAX(c1)
FROM dbo.V1;
The execution plan for this test depends on the version of SQL Server you are running. In SQL Server 2008 and 2008 R2, we get the following plan:
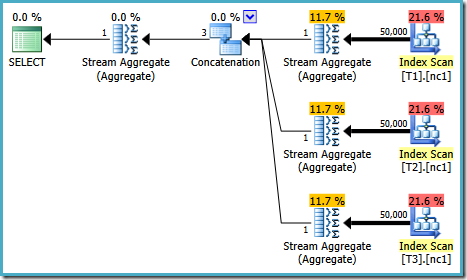
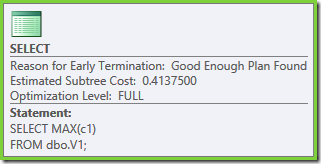
The plan properties show that cost-based optimization still ended early for the same reason as before. The estimated cost is higher than before at 0.41375 units but that is expected due to the higher cardinality of the base tables.
Test 3 – 50,000 rows, SQL Server 2005 and 2012
The same query run on 2005 or 2012 produces a different execution plan:
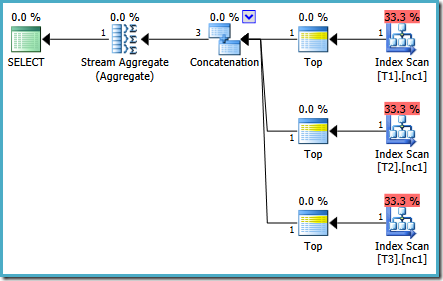
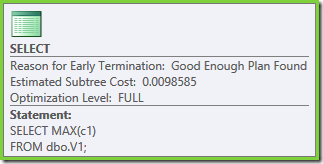
Optimization ended early again, but the estimated plan cost for 50,000 rows per base table is down to 0.0098585 (from 0.41375 on SQL Server 2008 and 2008 R2).
Explanation
As you may know, the SQL Server query optimizer separates optimization effort into multiple stages, with later stages adding more optimization techniques and allowing more time. The optimization stages are:
- Trivial plan
- Cost-based optimization
- Transaction Processing (search 0)
- Quick Plan (search 1)
- Quick Plan with parallelism enabled
- Full Optimization (search 2)
None of the tests performed here qualify for a trivial plan because the aggregate and unions have multiple implementation possibilities, requiring a cost-based decision.
Transaction Processing
The Transaction Processing (TP) stage requires that a query contains at least three table references, otherwise cost-based optimization skips this stage and moves straight on to Quick Plan. The TP stage is aimed at the low-cost navigational queries typical of OLTP workloads. It tries a limited number of optimization techniques, and is limited to finding plans with Nested Loop Joins (unless a Hash Join is needed to generate a valid plan).
In some respects it is surprising that the test query qualifies for a stage aimed at finding OLTP plans. Although the query contains the required three table references, it does not contain any joins. The three table requirement is just a heuristic, so I won’t labour the point.
Which Optimizer Stages Were Run?
There are a number of methods, the documented one being to compare the contents of sys.dm_exec_query_optimizer_info before and after compilation. This is fine, but it records instance-wide information so you need to be careful that yours is the only query compilation that happens between snapshots.
An undocumented (but reasonably well-known) alternative that works on all currently supported versions of SQL Server is to enable trace flags 8675 and 3604 while compiling the query.
Test 1
This test produces trace flag 8675 output similar to the following:

The estimated cost of 0.101624 after the TP stage is low enough that the optimizer does not go on to look for cheaper plans. The simple plan we end up with is quite reasonable given the relatively low cardinality of the base tables, even if it is not truly optimal.
Test 2
With 50,000 rows in each base table, the trace flag reveals different information:
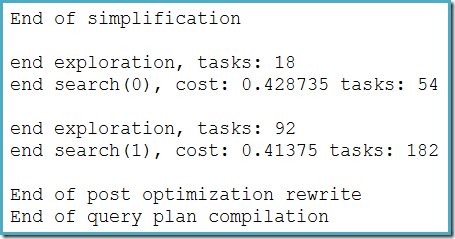
This time, the estimated cost after the TP stage is 0.428735 (more rows = higher cost). This is enough to encourage the optimizer into the Quick Plan stage. With more optimization techniques available, this stage finds a plan with a cost of 0.41375. This does not represent a huge improvement over the test 1 plan, but it is lower than the default cost threshold for parallelism, and not enough to enter Full Optimization, so again optimization ends early.
Test 3
For the SQL Server 2005 and 2012 run, the trace flag output is:
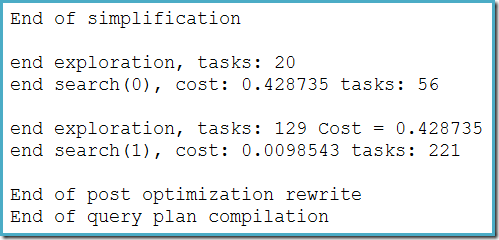
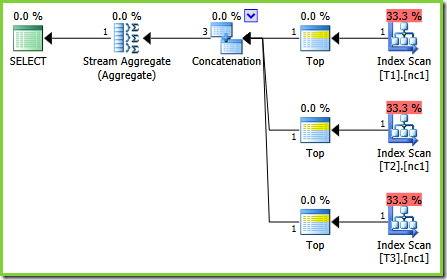
There are minor differences in the number of tasks run between versions, but the important difference is that on SQL Server 2005 and 2012, the Quick Plan stage finds a plan costing only 0.0098543 units. This is the plan that contains Top operators instead of the three Stream Aggregates below the Concatenation operator seen in the SQL Server 2008 and 2008 R2 plans.
Bugs and Undocumented Fixes
SQL Server 2008 and 2008 R2 contain a regression bug (compared with 2005) that was fixed under trace flag 4199, but not documented as far as I can tell. There is documentation for TF 4199 that lists fixes made available under separate trace flags before becoming covered by 4199, but as that Knowledge Base article says:
This one trace flag can be used to enable all the fixes that were previously made for the query processor under many trace flags. In addition, all future query processor fixes will be controlled by using this trace flag.
The bug in this case is one of those ‘future query processor fixes’. A particular optimization rule, ScalarGbAggToTop, is not applied to the new aggregates seen in the test 2 plan. With trace flag 4199 enabled on suitable builds of SQL Server 2008 and 2008 R2, the bug is fixed and the optimal plan from test 3 is obtained:
-- Trace flag 4199 required for 2008 and 2008 R2
SELECT MAX(c1)
FROM dbo.V1
OPTION (QUERYTRACEON 4199);
Conclusion
Once you know that the optimizer can transform a scalar MIN or MAX aggregate to a TOP (1) on an ordered stream, the plan shown in test 2 seems strange. The scalar aggregates above an index scan (which can provide order if asked to do so) stand out as a missed optimization that would normally be applied.
This is the point I was making in the introduction: once you get a feel for the sorts of things the optimizer can do, it can help you recognise cases where something has gone wrong.
The answer will not always be to enable trace flag 4199, since you might come across issues that have not yet been fixed. You also might not want the other QP fixes covered by the trace flag to apply in a particular case – optimizer fixes do not always make things better. If they did, there would be no need to protect against unfortunate plan regressions using this flag.
The solution in other cases might be to formulate the SQL query using different syntax, to break the query up into more optimizer-friendly chunks, or something else entirely. Whatever the answer turns out to be, it still pays to know a bit about optimizer internals so you can recognise that there was a problem in the first place :)


Hi, Paul! Very interesting note about Loop/Hash Join and TP phase!
Interesting thing happens, when the cost is low enough to stop on TP. Then, even joining three tables by columns that are clustered ascending keys, and even specifying “order by” by that key – QO will end up with good enough plan that will have Hash join + Sort (both stop and go and memory consuming)! Of course, normally that is not an issue, because there are not so many rows (so the cost is also low), if there will be more – optimization would continue and end up with merge join. But if we imagine that this query will be executed very often – for example modeling this situation by executing it in a loop – than the query with hash joins is 2 times slower, than the query with merge join (forced by hint, and optimized on search1).
My question is – have you ever observed similar situation in real life on very high load systems? Could it be a problem in a real world from your point of view? And the second question is – do you know an easy way to look at the available optimizations on each phase? I’d like to investigate more on this topic and may be post something…
Thanks,
Dima
I really have trouble accepting the early stop conditions the query optimizer implements. Most queries are compiled once and executed many times. The compilation time can amortize over many executions. Any optimization failure is also magnified by orders of magnitude.
tobi,
This is really interesting, are you sure that suboptimal plan is exactlly because optimizer gives up early, there might be a lot of other reasons? But, If so, it would be nice, if you post any example or plan with more information somewhere, for instance here in Q&A section.
I don't have any specific plan in mind. The plans in this blog post are good examples of early terminations. In my mind timeouts should be greatly extended in the QO, and also most queries should directly be optimized at the last and most powerful stage. Compiling a query is on the order of 10 to a few hundred milliseconds. As is this cost is only paid once per query most workloads would have no trouble bearing it.
Hi Dima,
Yes, that's another example of why knowing what the optimizer can and can't do is useful. Most systems have a relatively small number of critical queries, so being able to read execution plans and understand the optimizer's reasoning can lead to huge performance benefits. There isn't an easy way to see which transformations are available in each stage, and the details have changed over time.
Paul
Hi Tobi,
SQL Server has a general-purpose optimizer, so there will always be cases when it could do better, or we might wish that it would take a different approach. I don't fully agree that the plans in this post show poor plans due to early termination. We might argue that the heuristic used to enter the Transaction Processing stage is too loose. If TP is skipped (e.g. with TF8750), we get a good plan pretty immediately (assuming optimizer fixes are enabled).
On your second point, it rather depends on the workload. You and I might most frequently encounter systems where spending extra time on optimization could be intuitively 'worth it', but that doesn't mean our experience matches the majority of SQL Server installations worldwide. In any case, we would always have to set some limits, and there's no perfect way to pick that number.
This is a huge topic for discussion, so there's probably no way I am going to convince you that the current arrangement represents a very reasonable compromise in the space I have here.
Paul
Great article, Paul.
"… suitable builds of SQL Server 2008 and 2008 R2…" does suitable builds mean "all but the current CU" should have the "Fix everything else" trace flag ?
Johan
I mostly agree with your reply. I also observe the fact that I cannot make this decision from outside Microsoft not knowing what Microsoft knows. I guess what I'm saying is that from the outside it looks implausible that the current query optimizer is well-tuned regarding the aspect we are talking about. That is a much weaker statement. A trace flag would be appreciated ;-)
And another idea to add to this: If "optimize for ad hoc workloads" is turned on, the first compilation of a given query could use the current (fast) heuristics. The 2nd one would use the slower-but-better compilation mode. That would remedy the perf hit on badly written applications sending concatenated SQL queries with literals embedded.
Trace flag 4199 covers a wide range of optimizer fixes, not just the one highlighted in the post. This particular fix isn't documented, so I can't say which builds of 2008 or 2008 R2 support it, but there is no build that will apply the fix without using 4199 – not even the most recent cumulative update. The only way to be sure is to test it on your particular build. The decision to enable 4199 shouldn't be taken lightly – there's always the possibility of plan regressions.
There's a trace flag for (almost) everything, but there are some I do not publicize because they would be misapplied and end up causing more harm than good.
Hi Paul,
It's a great article. I have a question about the optimization phase though. Are the phases inclusive or exclusive? I mean, does the upper level only uses techniques that lower level doesn't use, or it contains all the techniques by adding new ones to the original ones of the lower level? If it is inclusive, then full optimization contains all techniques available to use?
Thanks,
Zhan
The phases are arranged so that search_0 covers the fewest, search_1 can use more, and search_2 can use all of them. I don't know for sure if there are any transformations available in search_0 that are not enabled for search_1. Broadly inclusive though, is the short answer :)
Wow great article Paul, very informative and well written.