In the course of monitoring performance or troubleshooting a problem such as system slowness, it may be necessary to find or capture queries that have high duration, high CPU, or generate significant I/O during execution. You can use the DMVs or Query Store to get information about query performance, but the information in both sources is an aggregate. The DMVs represent average CPU, I/O, duration, etc. for a query only for as long as it’s been in cache. Query Store also provides average metrics for numerous resources, but it’s aggregated over a defined window of time (e.g. 30 minutes or one hour). There are of course 3rd party monitoring solutions that are more than capable of giving you all of this and more (like SentryOne), but for this post I wanted to focus on native tools.
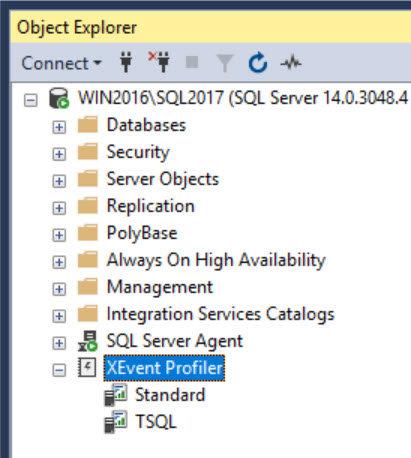
If you want to understand query performance for individual executions to pinpoint the exact query or set of queries which might be a problem, the easiest option is to use Extended Events. And one of the quickest ways to get started is to use XEvent Profiler, which is available through SQL Server Management Studio (starting in version 17.3):
Basic Use
There are two options for XEvent Profiler: Standard and TSQL. To use either one just double-click on the name. Behind the scenes, an internally defined event session is created (if it doesn’t already exist) and started, and the Live Data Viewer immediately opens with focus. Note that after you start the session, it will also appear under Management | Extended Events | Sessions. Assuming you have activity against the server, you should start to have entries show up in the viewer in five seconds or less.
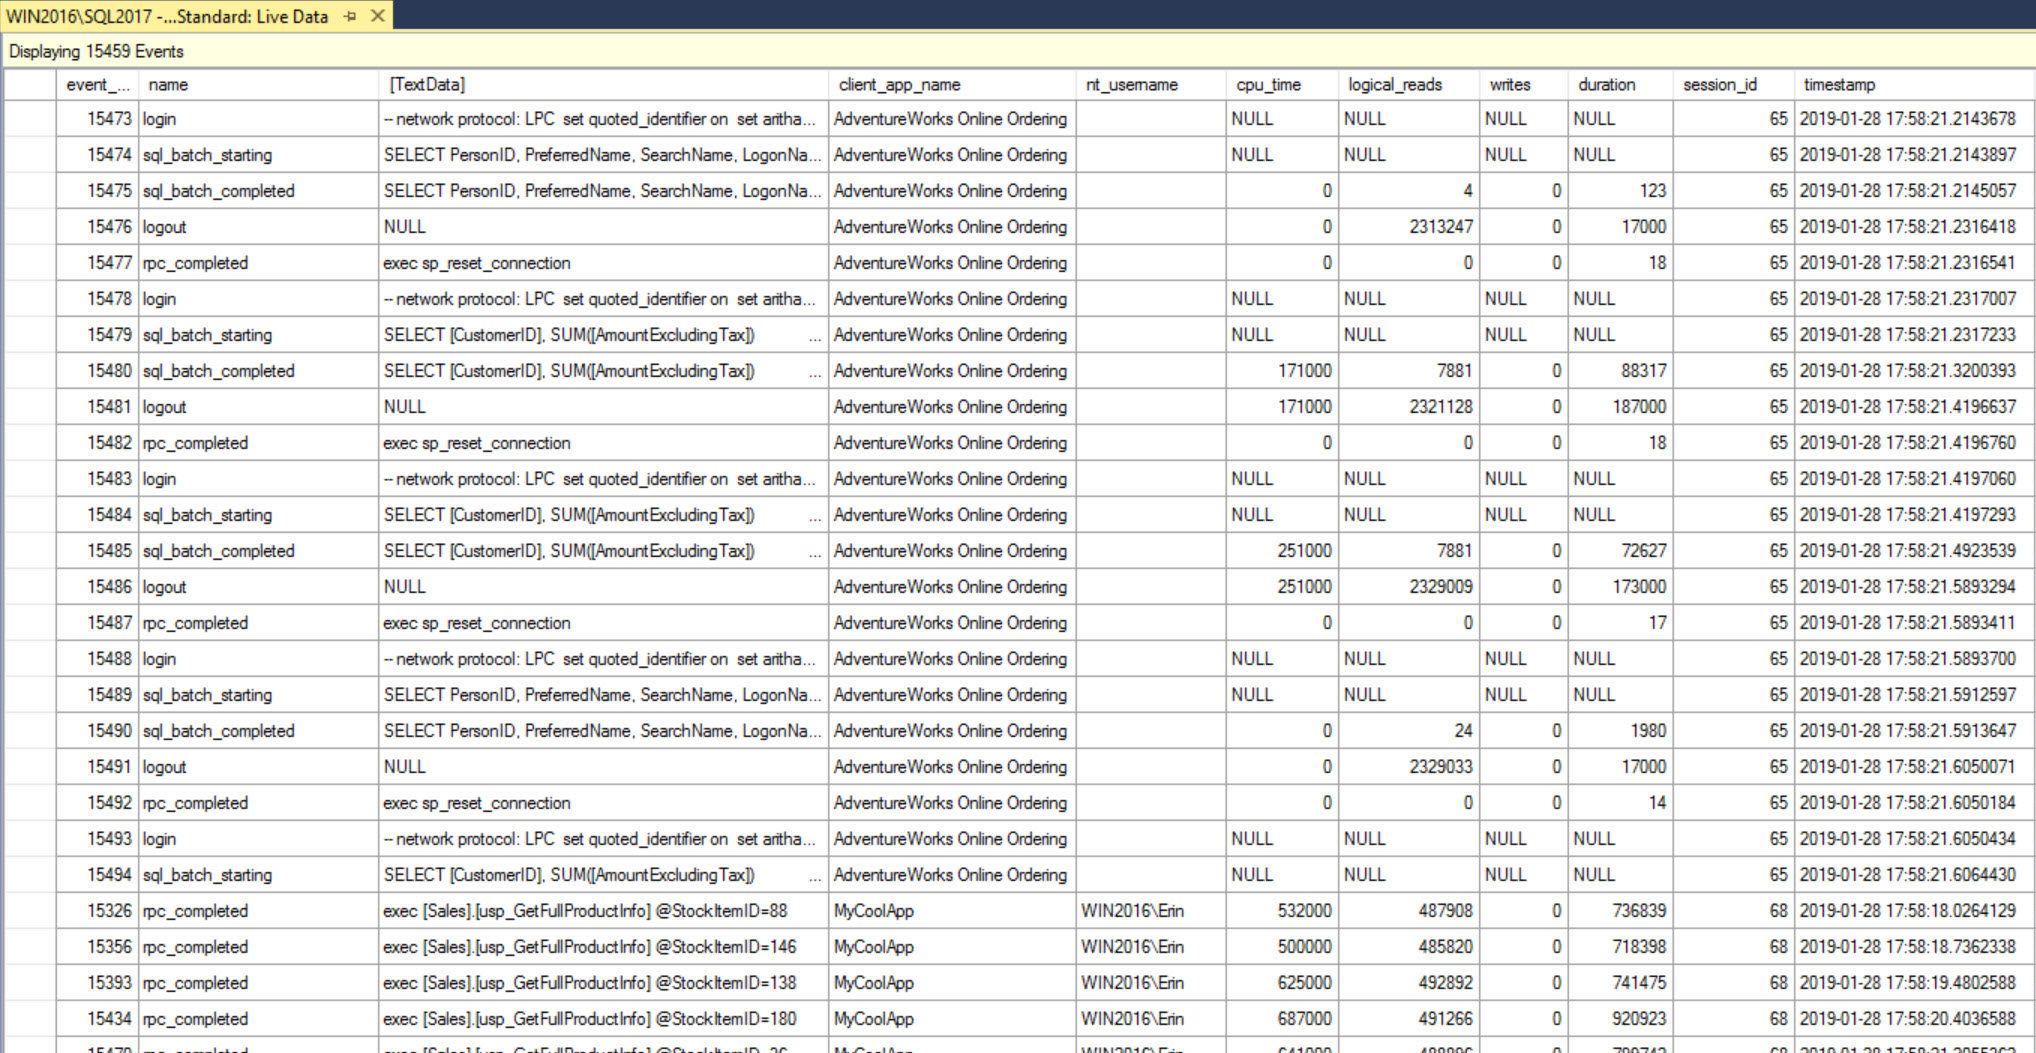 Live Data Viewer (after double-clicking to start Standard session)
The Standard and TSQL sessions share some events, with the Standard having more in total. Here’s a listing of the events for each:
Standard		TSQL
sql_batch_starting	sql_batch_starting
sql_batch_completed
                        rpc_starting
rpc_completed
logout			logout
login			login
existing_connection	existing_connection
attention
If you’re looking to understand information about query execution, such as how long it took the query to run, or how much I/O it consumed, then Standard is a better option due to the two completed events. For both sessions, the only filter is to exclude system queries for the batch, rpc, and attention events.
Viewing and Saving Data
If we start up the Standard session and run some queries, in the viewer we see the event, the query text, and other useful information like the cpu_time, logical_reads, and duration. One of the benefits of using rpc_completed and sql_batch_completed is that the input parameter shows up. In a case where there is a stored procedure which has large variations in performance, capturing the input parameter can be extremely useful as we can match up an execution that takes longer with a specific value passed in to the stored procedure. In order to find such a parameter, we need to sort the data based on duration, which we cannot do when the data feed is active. To perform any kind of analysis, the data feed must be stopped.
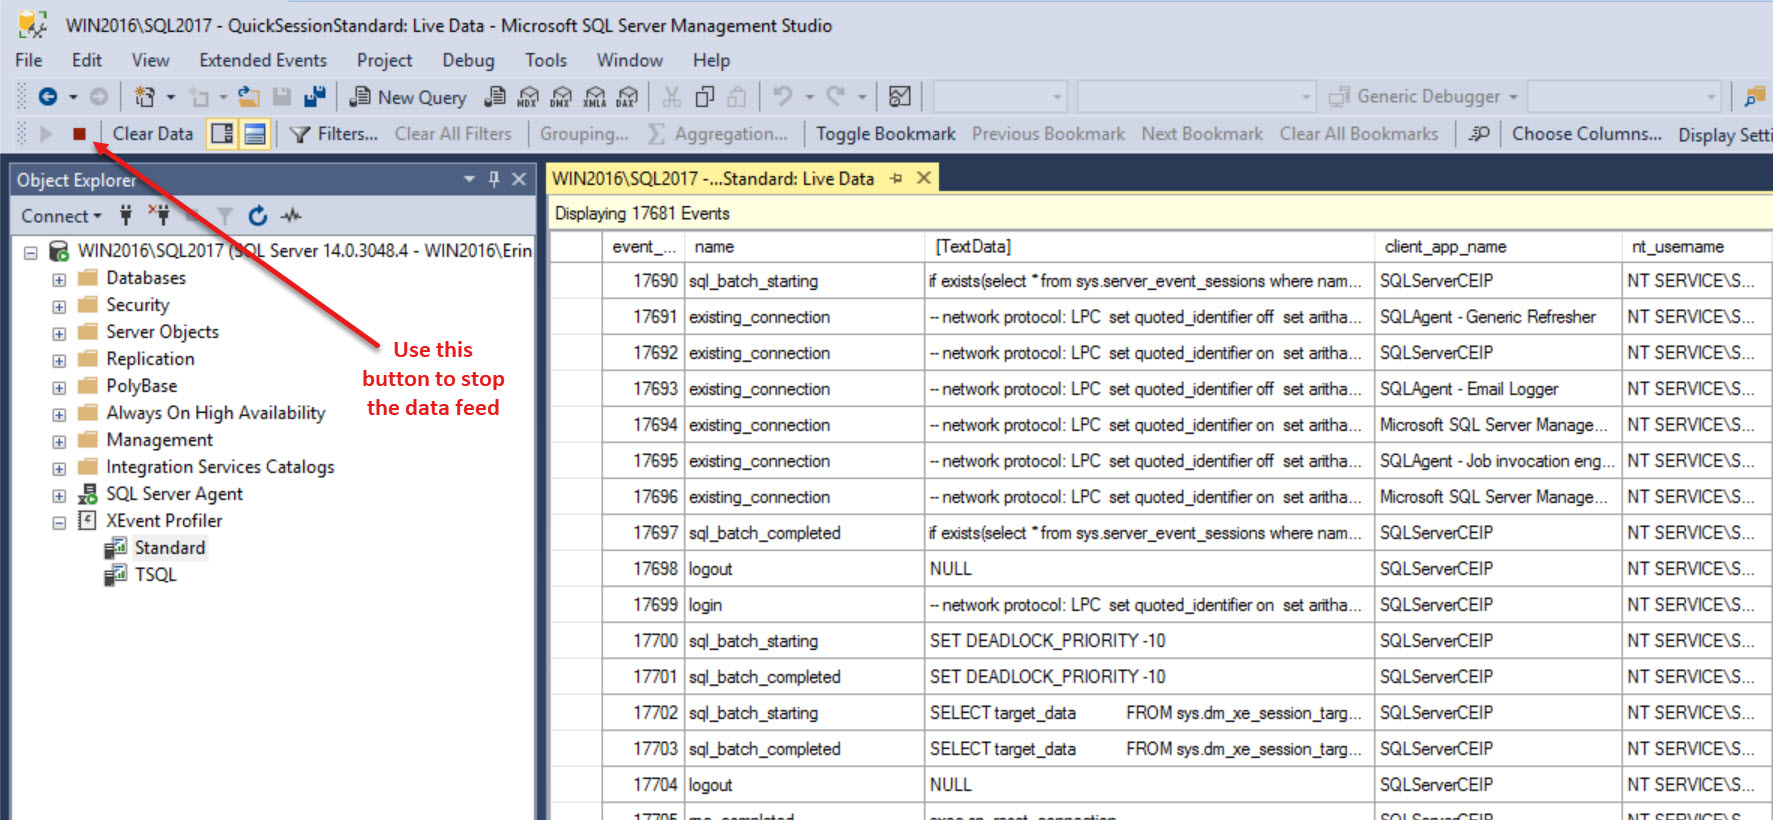 Stopping the Data Feed in the Live Viewer
Now that my queries are no longer rolling by in a blur, I can click on the duration column to sort my events. The first time I click it will sort in ascending order, and because I’m lazy and don’t want to scroll the bottom, I’ll click again to sort in descending order.
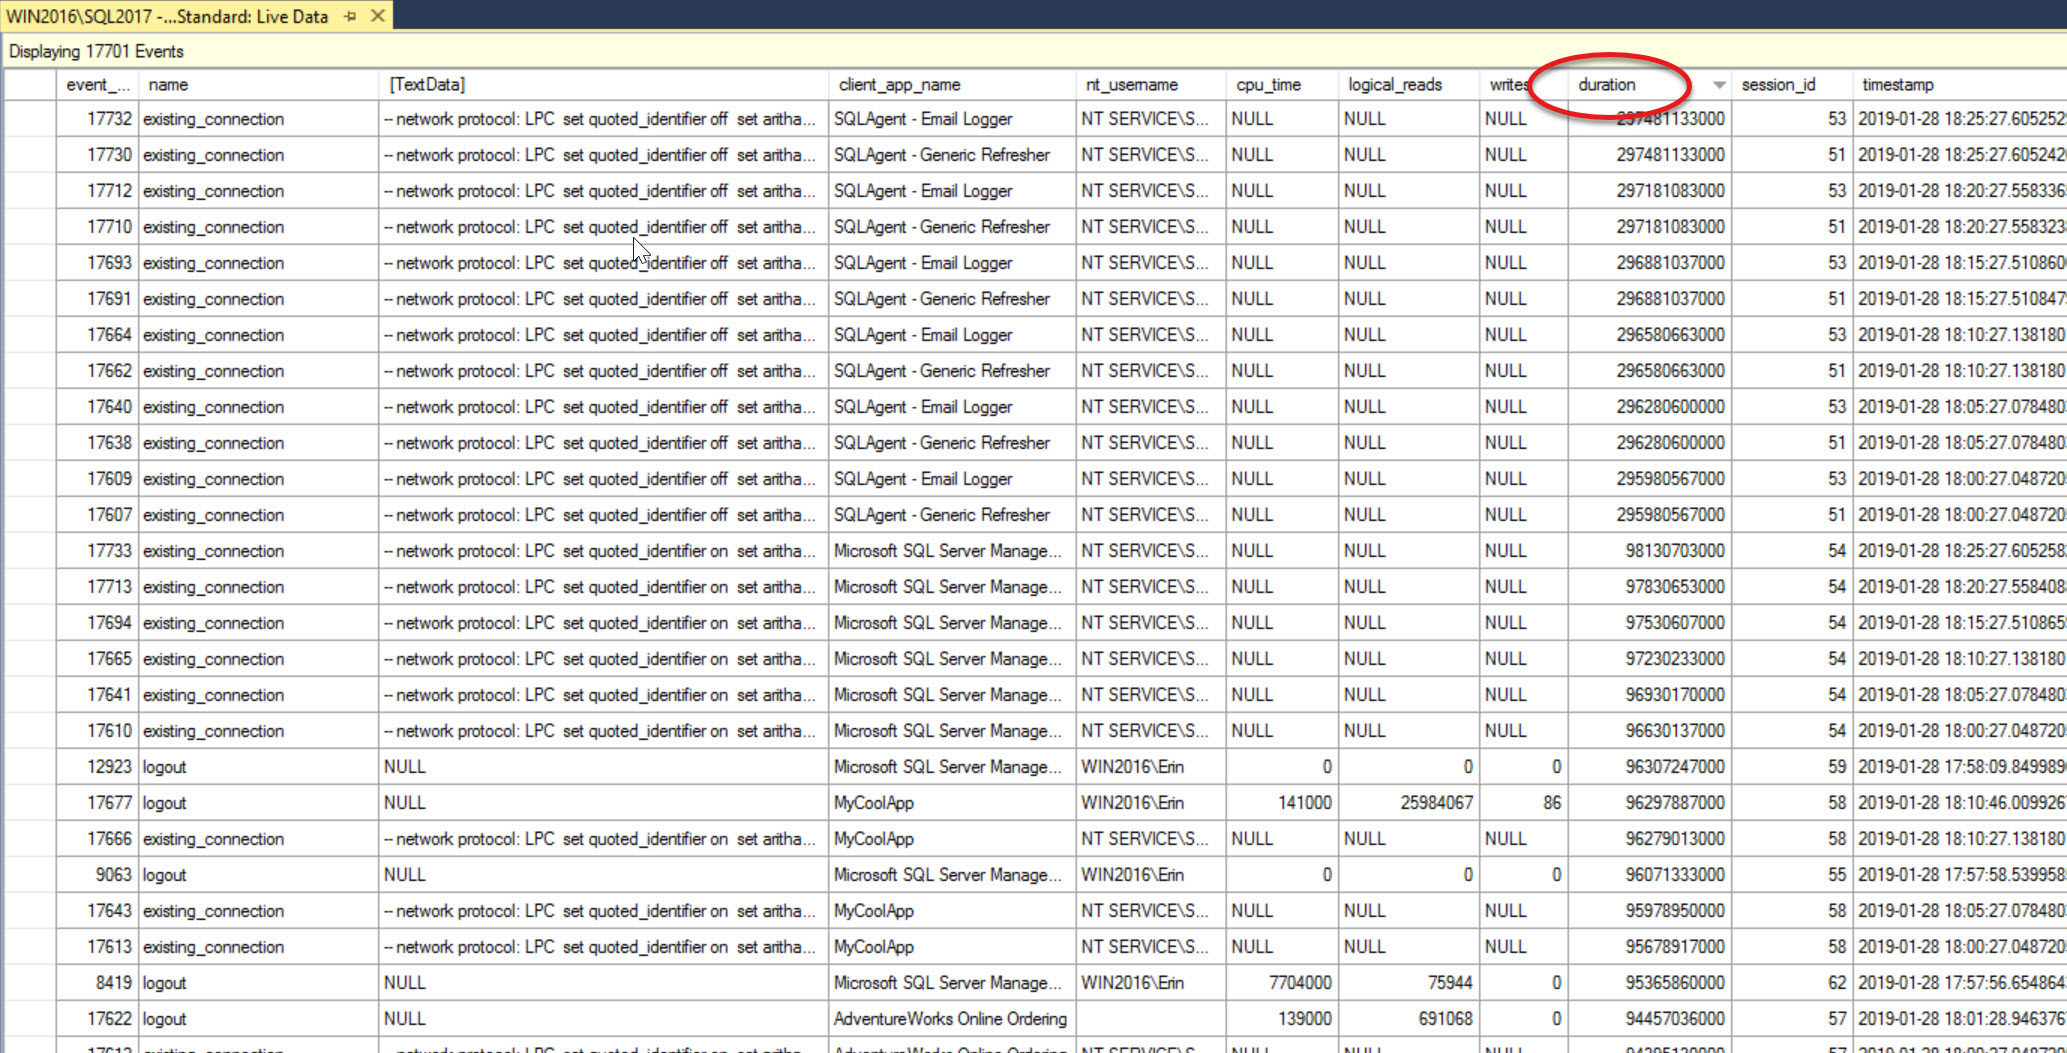 Events sorted in duration descending
Now I can see all the events I’ve captured in order of highest duration to lowest. If I were looking for a specific stored procedure that was slow, I could either scroll down until I find it (which could be painful), or I could group or filter the data. Grouping is easier here, because I know the stored procedure name.
The object_name is displayed in the top part of the viewer, but clicking on any rpc_completed event shows all elements captured in the Details pane. Right-click on object_name, which will highlight it, and select Show Column in Table.
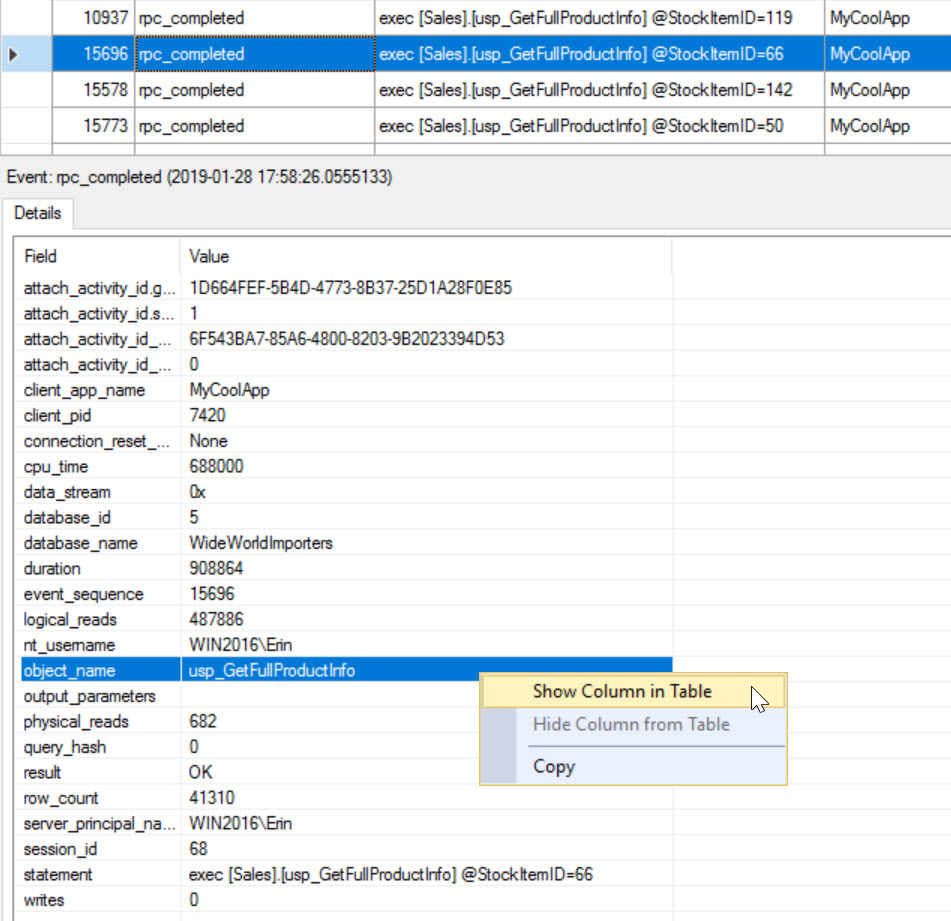 Add object_name to data viewer
In the top pane I can now right-click on object_name and select Group by this Column. If I expand the events under usp_GetPersonInfo and then sort again by duration, I now see that the execution with PersonID=3133 had the highest duration.
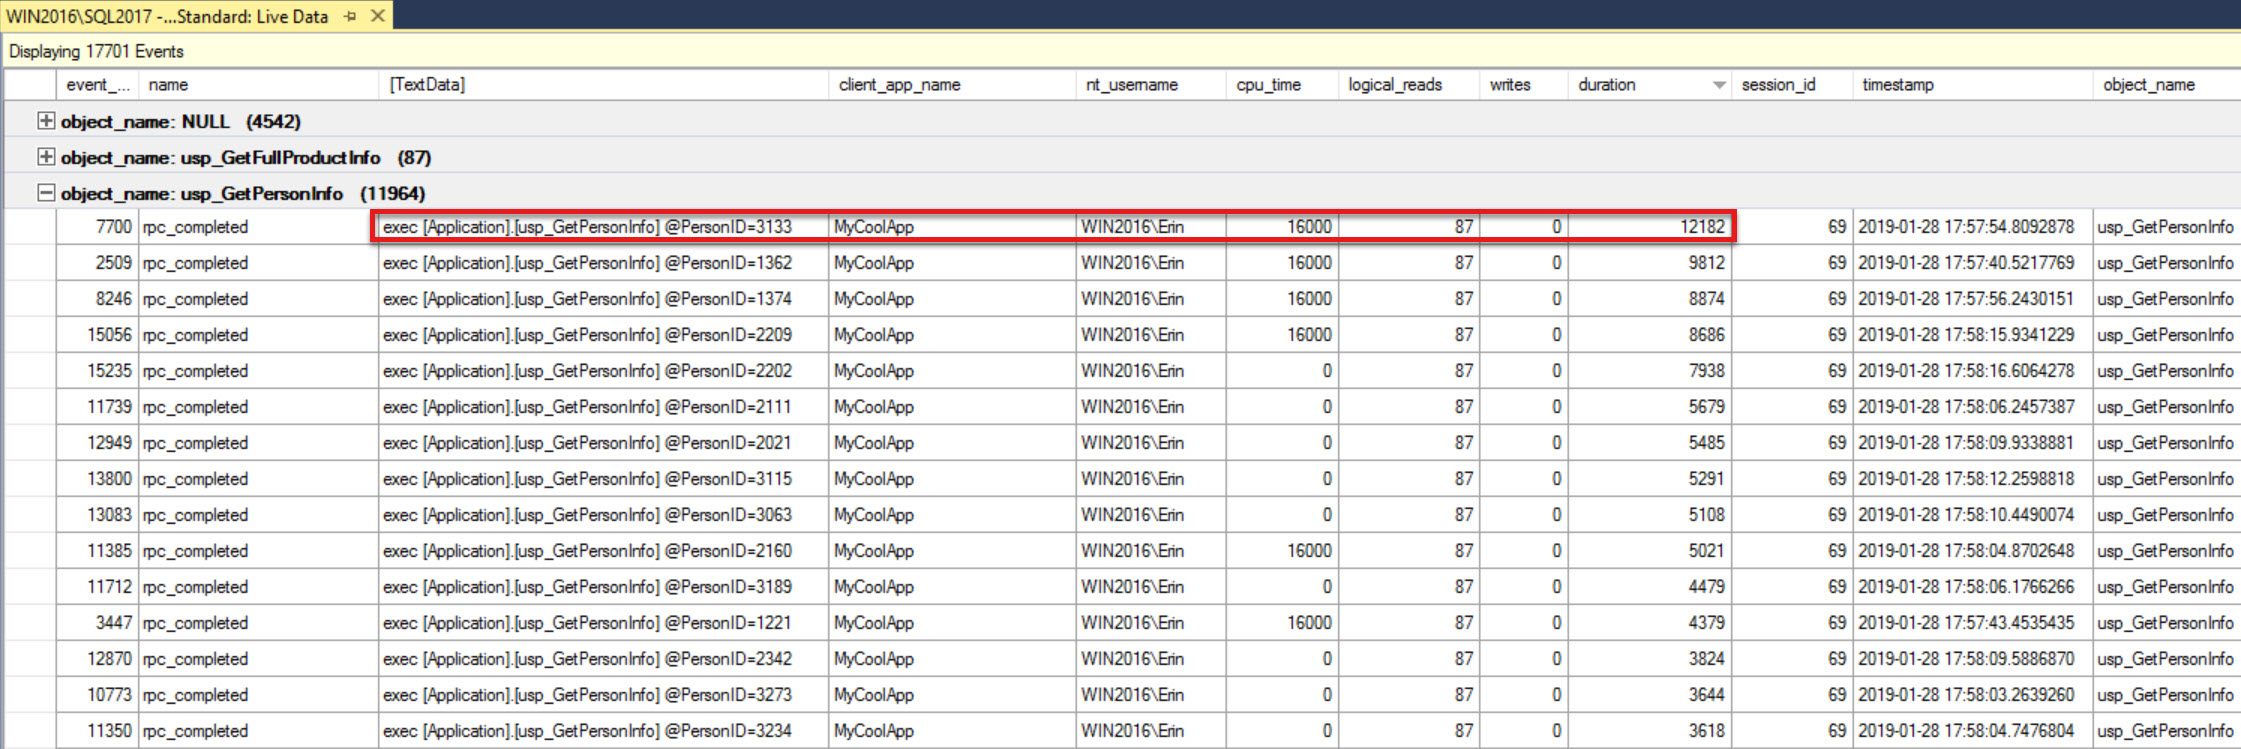 Events grouped by object_name, usp_GetPersonInfo sorted by duration descending
To filter the data: Use either the Filters… button, the menu option (Extended Events | Filters…), or CTRL + R to bring up a window to reduce the result set based on the different fields displayed. In this case we filtered on object_name = usp_GetPersonInfo, but you could also filter on fields like server_principal_name or client_app_name, as those were collected.
It’s worth pointing out that neither the Standard or TSQL session writes out to a file. In fact, there’s no target for either event session (if you didn’t know that you can create an event session without a target, now you know). If you want to save this data for further analysis, you need to do one of the following:
- Stop the data feed and save the output to a file via the Extended Events menu (Export to | XEL File…)
- Stop the data feed and save the output to a table in a database via the Extended Events menu (Export to | Table…)
- Alter the event session and add the event_file as a target.
Option 1 is my recommendation, as it creates a file on disk that you can share with others and review later in Management Studio for further analysis. Within Management Studio you have the ability to filter out data that isn’t relevant, sort by one or more columns, group the data, and perform calculations (e.g. averages). You can do this if the data is a table, but you have to write the TSQL; analyzing the data in the UI is easier and faster.
Altering the XEvent Profiler Sessions
You can modify the Standard and TSQL event sessions and the changes you make will persist through instance restarts. However, if the event sessions are dropped (after you have made modifications) they will reset back to the defaults. If you find yourself continually making the same changes, I suggest that you script out the changes and create a new event session that will also persist across restarts. As an example, if we look at the output captured so far, we can see that both adhoc queries and stored procedures have executed. And while it’s great that I can see the different input parameters for the stored procedures, I don’t see the individual statements that are executing with this set of events. To get that information, I would need to add the sp_statement_completed event.
Understand that both the Standard and TSQL event sessions are designed to be lightweight. The statement_completed events will fire more frequently than the batch and rpc events, thus there can be more overhead when these events are part of an event session. When using statement events, I highly recommend including additional predicates. As a reminder, the rpc and batch events are only filtering out system queries – there is no other predicate. In general, I also recommend additional predicates for these events, especially for a high-volume workload.
If you are worried about whether running the Standard or TSQL sessions will cause a performance hit on your system, understand that the Live Data Viewer will disconnect if it is creating too much overhead on the system. This is a great safety, but I would still be thoughtful when using these event sessions. I believe they are a fantastic first step for troubleshooting, particularly for those who are new to SQL Server or Extended Events. However, if you have the Live Data Viewer open and you walk away from your machine, the event session continues to run. Stopping or closing the Live Data Viewer will stop the event session, which is what I recommend when you’re finished with your data collection or troubleshooting.
For event sessions that you want to run for a longer period of time, create separate event sessions that write out to the event_file target and have appropriate predicates. If you need more information on getting started with Extended Events check out the session I gave at SQLBits last year on migrating from Profiler to Extended Events.




This is great info, Erin, and helpfully presented. Thanks very much.
And at the risk of "looking a gift horse in the mouth", could you (or readers) tell us please what versions of Sql Server would support all this, and whether only Standard/Web/Enterprise, or also Express, too? It would influence who can benefit, of course.
Also, can the filtering be done (during collection) on duration, so that only slow requests are captured, if that's one's focus?
Finally, even without ssms 2017, how much would have been possible with earlier versions of it, or via sql alone?
I'm not at computer so can't check all these now via my own demos, and don't have time at the moment to go doc searching. So I wanted to put these now while reading (especially n case I may lose track to dig myself later) for the sake of all readers, as I'm sure others would benefit to know. :-)
But again, your post is a huge push forward for those new to the concepts and abilities, and on the latest and greatest versions. Well done.
Also, one minor typo: executedg
Hi Charlie-
Answers to your questions:
You can run SSMS 17.x against SQL Server 2008 through SQL Server 2019. However, I would recommend using XE Profiler against SQL 2012 and higher only.
https://docs.microsoft.com/en-us/sql/ssms/download-sql-server-management-studio-ssms?view=sql-server-2017
Filtering can be done during collection, you need to modify the Event Session definition and add a filter to do so.
Everything that's in XE Profiler has been available in SQL Server since version 2012. It's just using Extended Events, which was added in SQL Server 2008, with a UI (under Management | Extended Events) added in SQL Server 2012.
Thanks,
Erin
And thank you for the quick reply. Hope it may help other to consider implementing this for more diagnosis.
I'd recommend to analyze Extended events with Microsoft RML Utilities. Never with SSMS. Doesn't matter if is it's Azure.
On a standard production box, with between hundreds to thousands batch per second, you will get a real hard time finding what you are looking for, unless the event is highly filtered, or you know exactly what you are looking for.
Once normalized the sql text, no matter if they are prepared, you wil know exactly where is the issue.
Anyway, as traces are going to be deprecated, yes. We need to go with extended events.
Using RML Utilities is absolutely a great way to analyze output files, but you can do the same thing with SSMS (in Azure or box) if you capture the query_hash as an action, as the query_hash will be the same value, even if different literal values are used.