A few weeks ago, I wrote about how surprised I was at the performance of a new native function in SQL Server 2016, STRING_SPLIT():
After the post was published, I got a few comments (publicly and privately) with these suggestions (or questions that I turned into suggestions):
- Specifying an explicit output data type for the JSON approach, so that that method doesn't suffer from potential performance overhead due to the fallback of
nvarchar(max). - Testing a slightly different approach, where something is actually done with the data – namely
SELECT INTO #temp. - Showing how estimated row counts compare to existing methods, particularly when nesting split operations.
I did respond to some people offline, but thought it would be worth posting a follow-up here.
Being fairer to JSON
The original JSON function looked like this, with no specification for output data type:
CREATE FUNCTION dbo.SplitStrings_JSON
...
    RETURN (SELECT value FROM OPENJSON( CHAR(91) + @List + CHAR(93) ));
I renamed it, and created two more, with the following definitions:
CREATE FUNCTION dbo.SplitStrings_JSON_int
...
    RETURN (SELECT value FROM OPENJSON( CHAR(91) + @List + CHAR(93) )
      WITH ([value] int '$'));
GO

CREATE FUNCTION dbo.SplitStrings_JSON_varchar
...
    RETURN (SELECT value FROM OPENJSON( CHAR(91) + @List + CHAR(93) )
      WITH ([value] varchar(100) '$'));
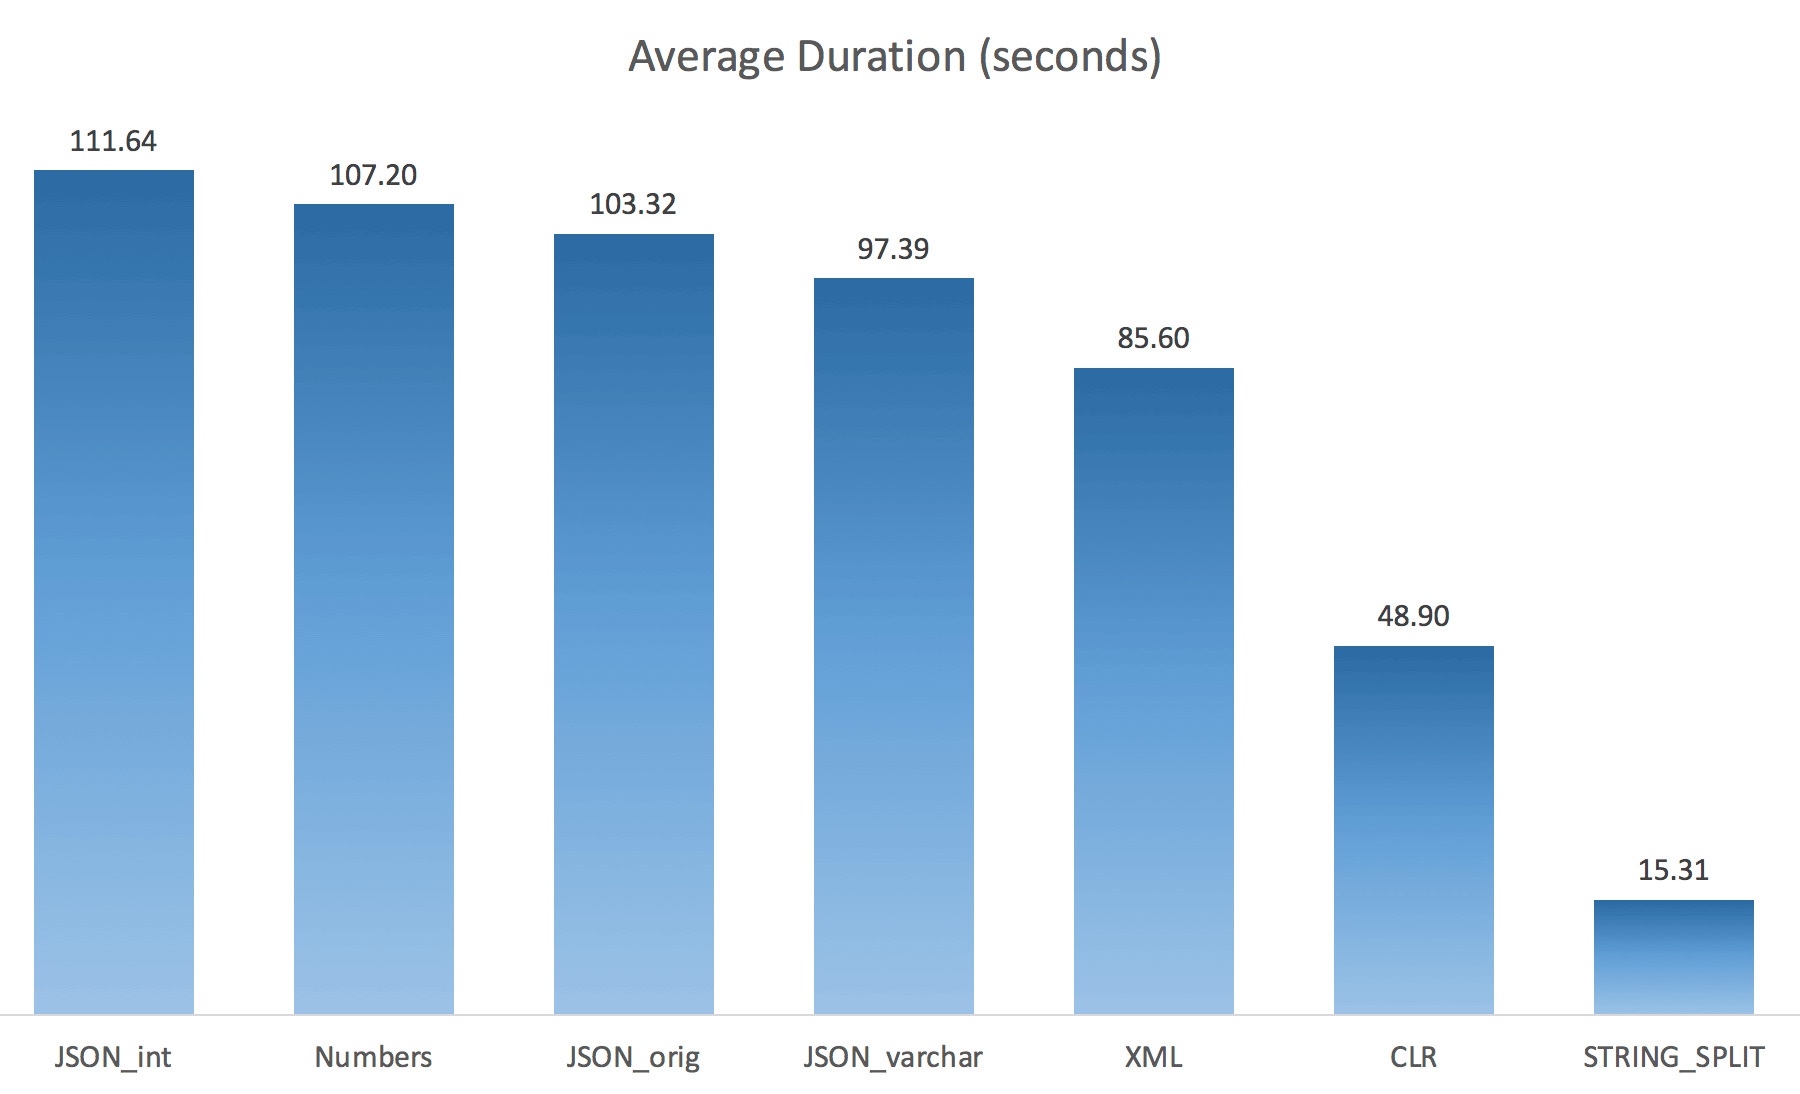
I thought this would drastically improve performance, but alas, this was not the case. I ran the tests again and the results were as follows:
The waits observed during a random instance of the test (filtered to those > 25):
| CLR | IO_COMPLETION | 1,595 |
| SOS_SCHEDULER_YIELD | 76 | |
| RESERVED_MEMORY_ALLOCATION_EXT | 76 | |
| MEMORY_ALLOCATION_EXT | 28 | |
| JSON_int | MEMORY_ALLOCATION_EXT | 6,294 |
| SOS_SCHEDULER_YIELD | 95 | |
| JSON_original | MEMORY_ALLOCATION_EXT | 4,307 |
| SOS_SCHEDULER_YIELD | 83 | |
| JSON_varchar | MEMORY_ALLOCATION_EXT | 6,110 |
| SOS_SCHEDULER_YIELD | 87 | |
| Numbers | SOS_SCHEDULER_YIELD | 96 |
| XML | MEMORY_ALLOCATION_EXT | 1,917 |
| IO_COMPLETION | 1,616 | |
| SOS_SCHEDULER_YIELD | 147 | |
| RESERVED_MEMORY_ALLOCATION_EXT | 73 |
Waits observed > 25 (note there is no entry for STRING_SPLIT)
While changing from the default to varchar(100) did improve performance a little, the gain was negligible, and changing to int actually made it worse. Add to this that you probably need to add STRING_ESCAPE() to the incoming string in some scenarios, just in case they have characters that will mess up JSON parsing. My conclusion is still that this is a neat way to use the new JSON functionality, but mostly a novelty inappropriate for reasonable scale.
Materializing the Output
Jonathan Magnan made this astute observation on my previous post:
STRING_SPLIT is indeed very fast, however also slow as hell when working with temporary table (unless it get fixed in a future build).SELECT f.value
INTO #test
FROM dbo.SourceTable AS s
CROSS APPLY string_split(s.StringValue, ',') AS f
Will be WAY slower than SQL CLR solution (15x and more!).
So, I dug in. I created code that would call each of my functions and dump the results into a #temp table, and time them:
SET NOCOUNT ON;

SELECT N'SET NOCOUNT ON;
TRUNCATE TABLE dbo.Timings;
GO
';

SELECT N'DECLARE @d DATETIME = SYSDATETIME();

INSERT dbo.Timings(dt, test, point, wait_type, wait_time_ms)
SELECT @d, test = ''' + name + ''', point  = ''Start'', wait_type, wait_time_ms
FROM sys.dm_exec_session_wait_stats WHERE session_id = @@SPID;
GO

SELECT f.value
INTO #test
FROM dbo.SourceTable AS s
CROSS APPLY dbo.'+name+'(s.StringValue, '','') AS f;
GO

DECLARE @d DATETIME = SYSDATETIME();

INSERT dbo.Timings(dt, test, point, wait_type, wait_time_ms)
SELECT @d, '''+name+''', ''End'', wait_type, wait_time_ms
FROM sys.dm_exec_session_wait_stats WHERE session_id = @@SPID;

DROP TABLE #test;
GO'
FROM sys.objects WHERE name LIKE '%split%';
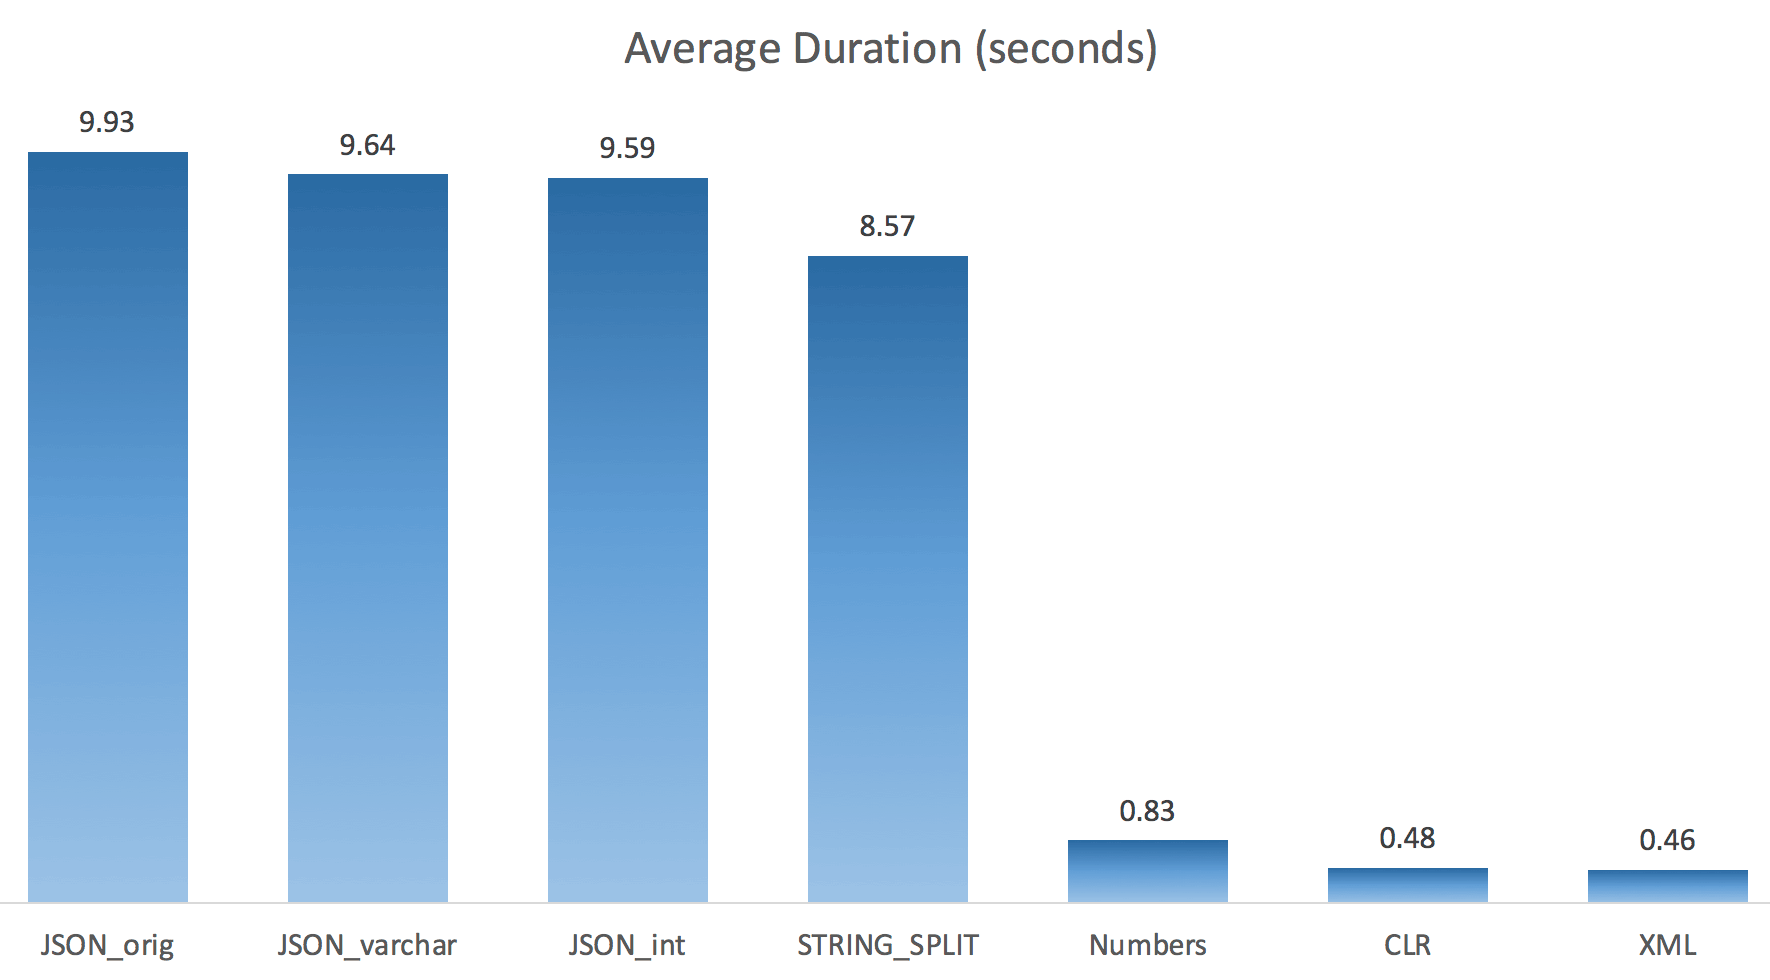
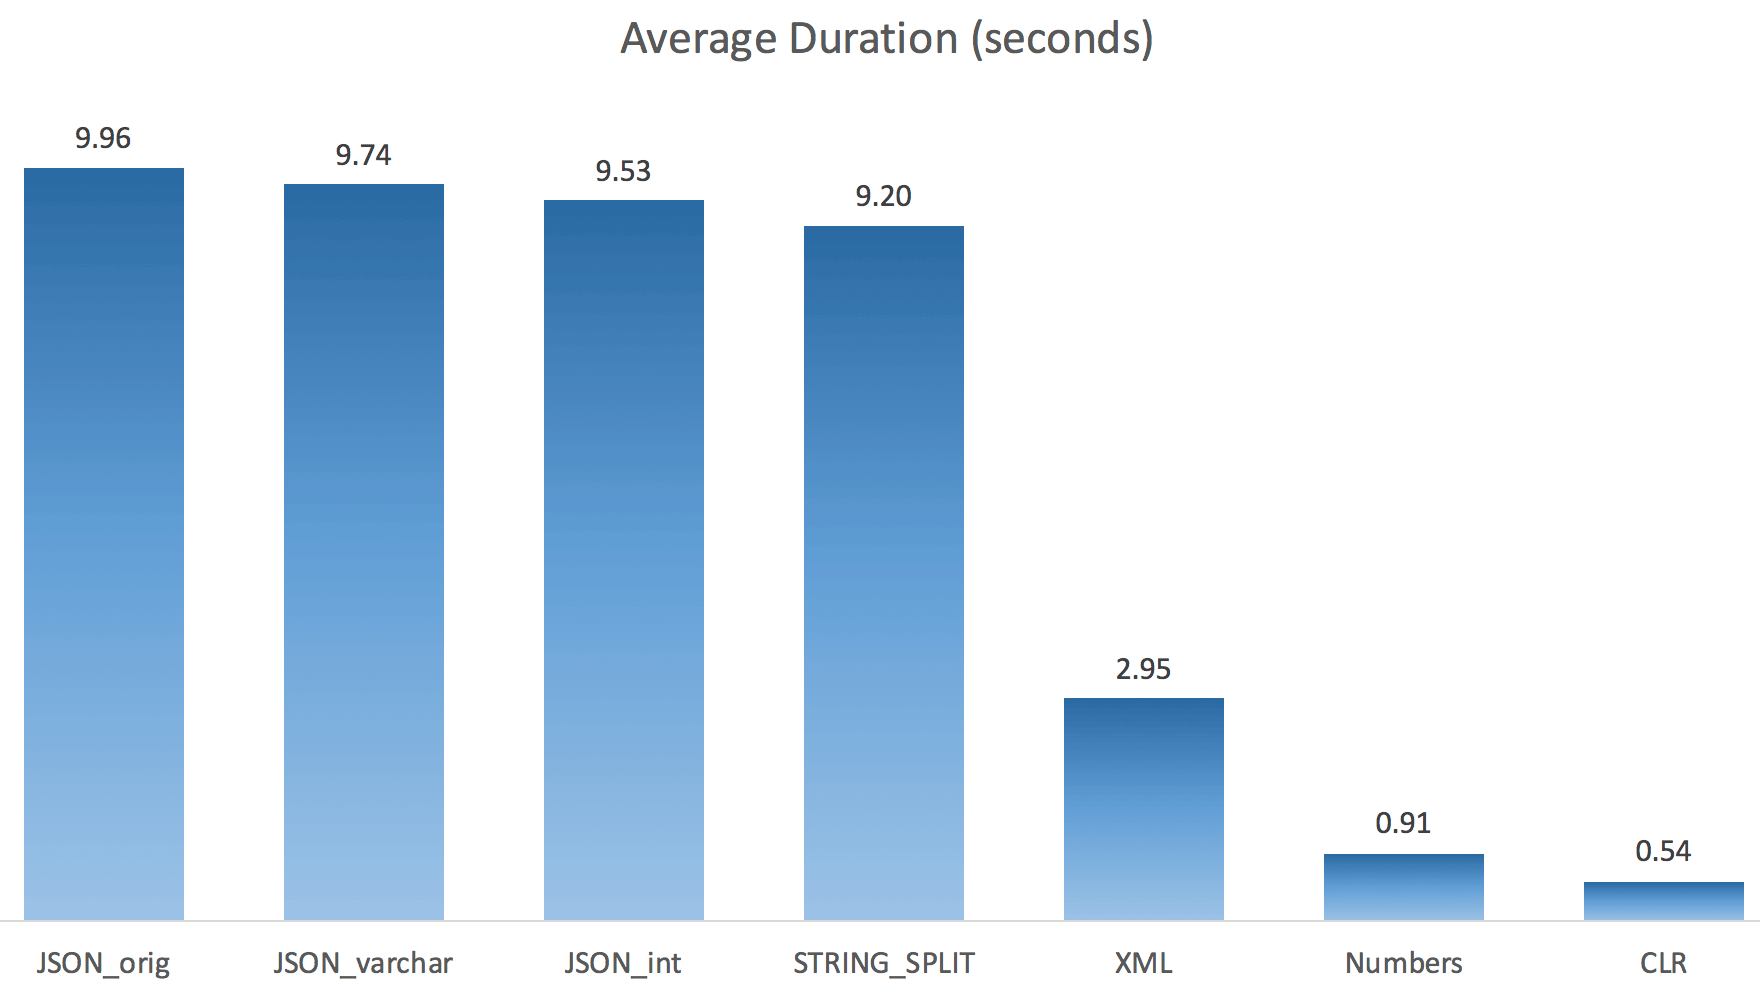
I just ran each test once (rather than loop 100 times), because I didn't want to completely thrash the I/O on my system. Still, after averaging three test runs, Jonathan was absolutely, 100% right. Here were the durations of populating a #temp table with ~500,000 rows using each method:
So here, the JSON and STRING_SPLIT methods took about 10 seconds each, while the Numbers table, CLR, and XML approaches took less than a second. Perplexed, I investigated the waits, and sure enough, the four methods on the left incurred significant LATCH_EX waits (about 25 seconds) not seen in the other three, and there were no other significant waits to speak of.
And since the latch waits were greater than total duration, it gave me a clue that this had to do with parallelism (this particular machine has 4 cores). So I generated test code again, changing just one line to see what would happen without parallelism:
CROSS APPLY dbo.'+name+'(s.StringValue, '','') AS f OPTION (MAXDOP 1);
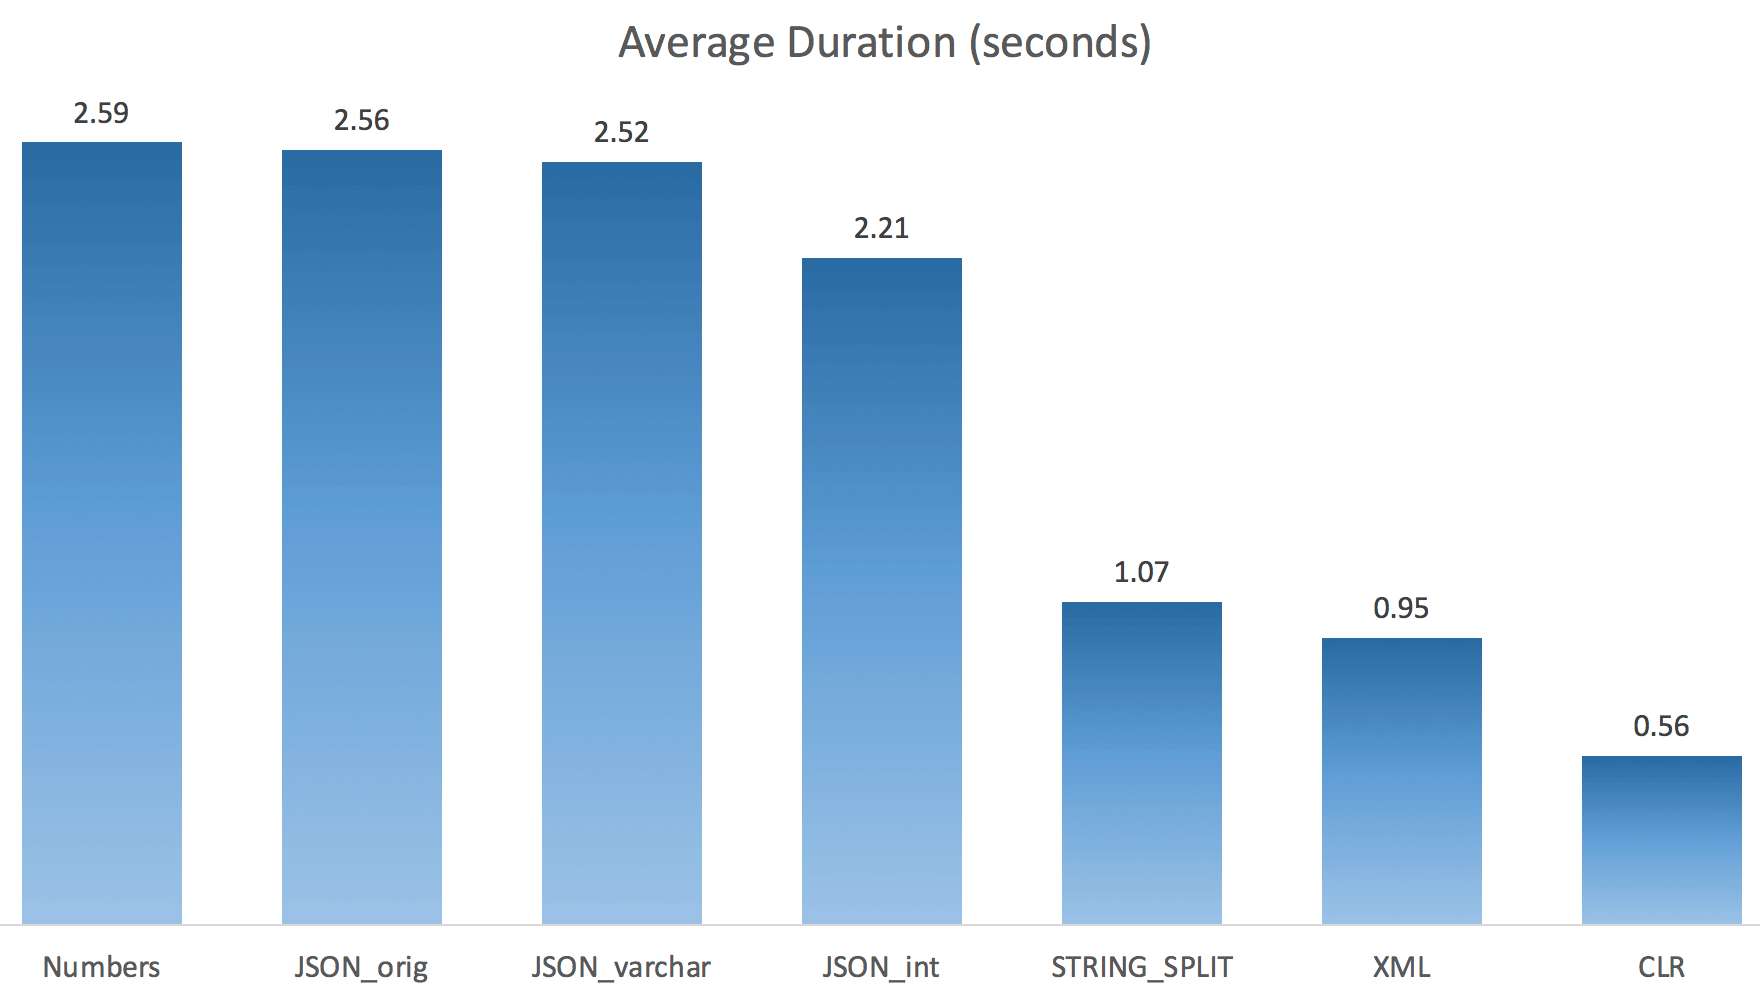
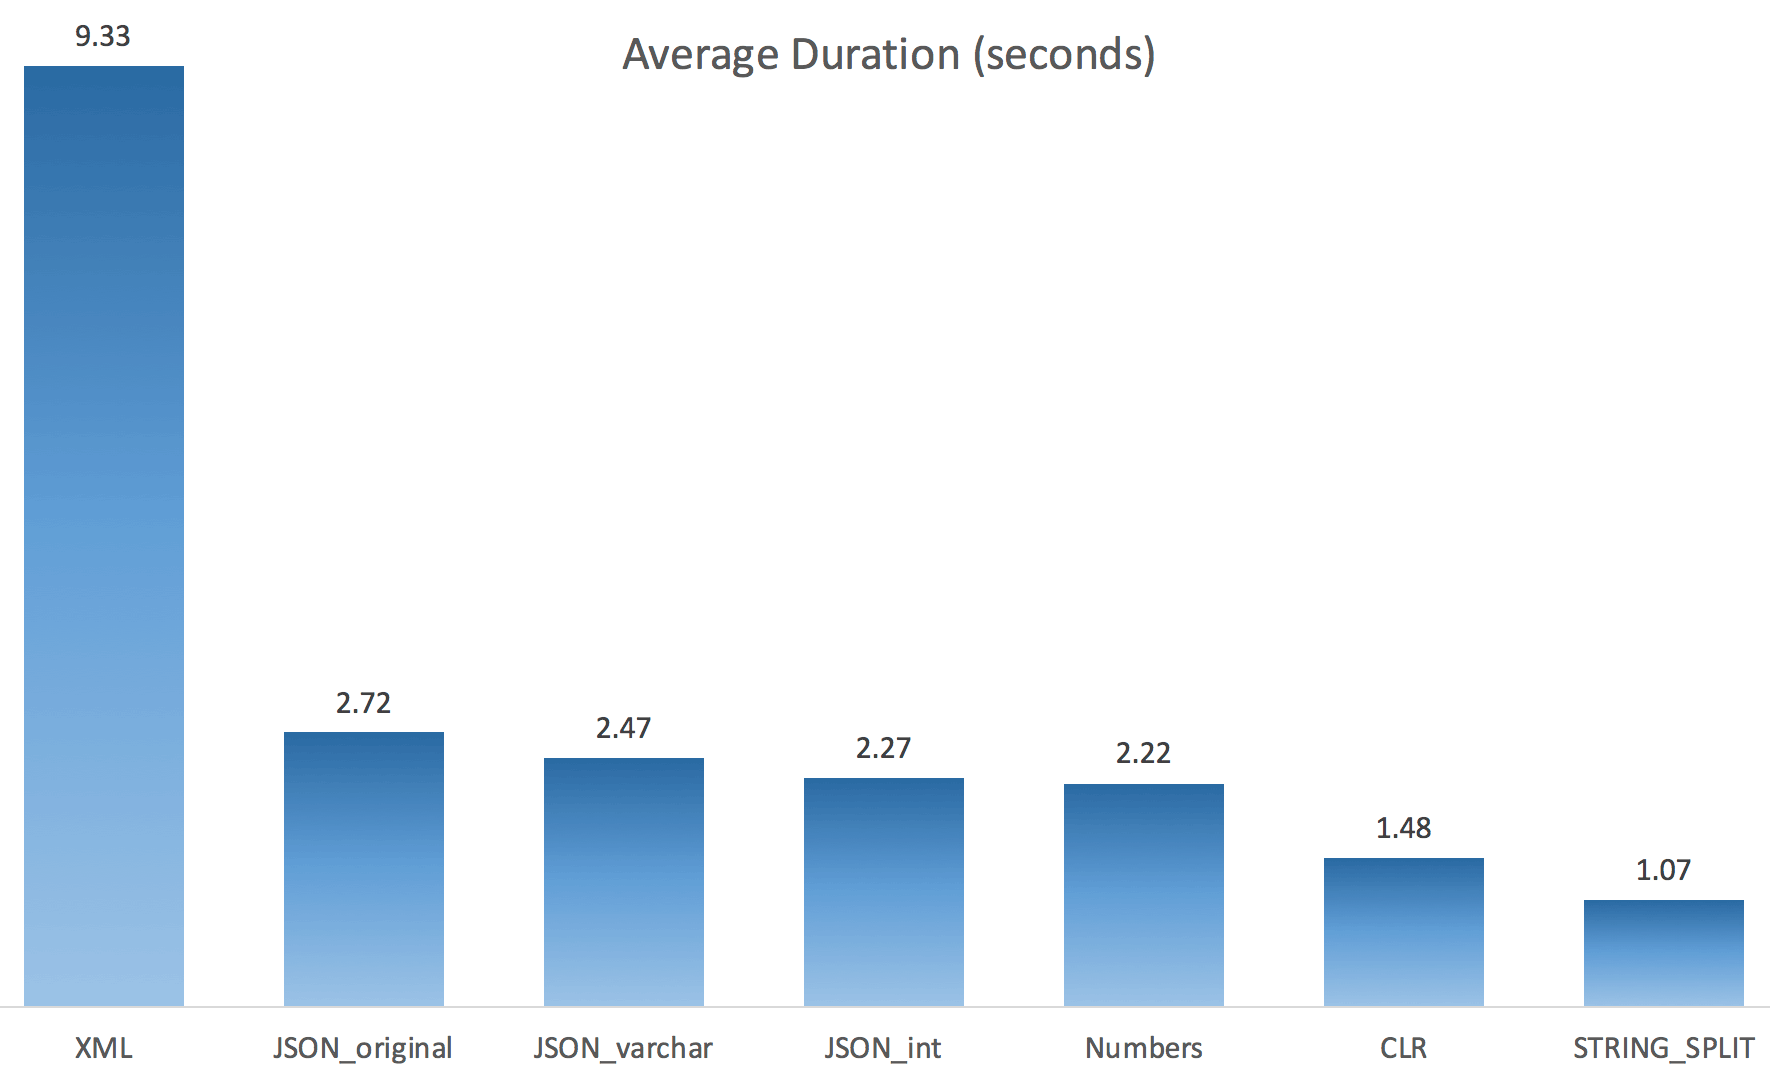
Now STRING_SPLIT fared a lot better (as did the JSON methods), but still at least double the time taken by CLR:
So, there might be a remaining issue in these new methods when parallelism is involved. It wasn't a thread distribution issue (I checked that), and CLR actually had worse estimates (100x actual vs. just 5x for STRING_SPLIT); just some underlying issue with coordinating latches amongst threads I suppose. For now, it might be worthwhile using MAXDOP 1 if you know you are writing the output onto new pages.
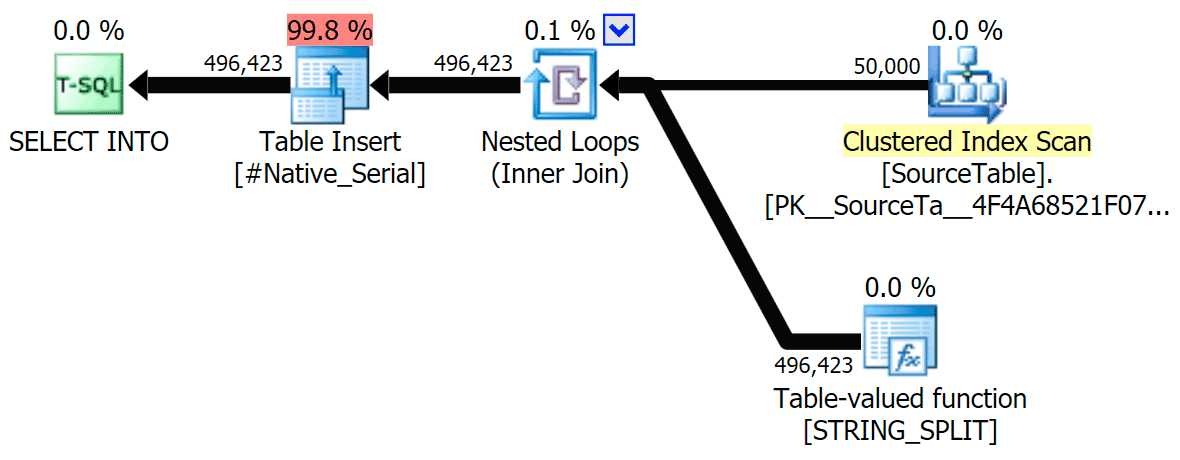
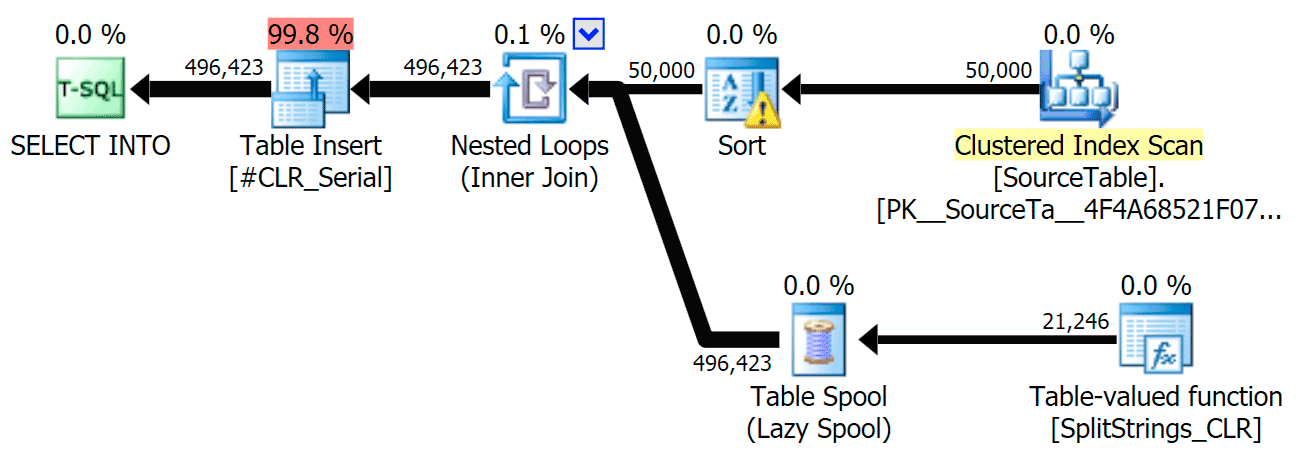
I've included the graphical plans comparing the CLR approach to the native one, for both parallel and serial execution (I've also uploaded a Query Analysis file that you can open up in SQL Sentry Plan Explorer to snoop around on your own):
STRING_SPLIT
CLR
The sort warning, FYI, was nothing too shocking, and obviously didn't have much tangible effect on the query duration:
Spools Out For Summer
When I looked a little closer at those plans, I noticed that in the CLR plan, there is a lazy spool. This is introduced to make sure that duplicates are processed together (to save work by doing less actual splitting), but this spool is not always possible in all plan shapes, and it can give a bit of an advantage to those that can use it (e.g. the CLR plan), depending on estimates. To compare without spools, I enabled trace flag 8690, and ran the tests again. First, here is the parallel CLR plan without the spool:
And here were the new durations for all queries going parallel with TF 8690 enabled:
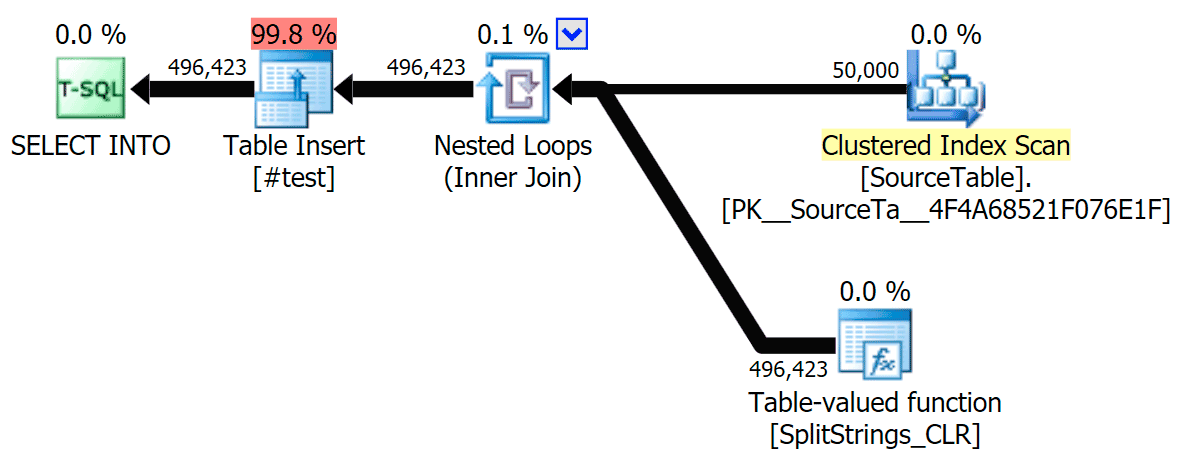
Now, here is the serial CLR plan without the spool:
And here were the timing results for queries using both TF 8690 and MAXDOP 1:
(Note that, other than the XML plan, most of the others didn't change at all, with or without the trace flag.)
Comparing estimated rowcounts
Dan Holmes asked the following question:
http://sql.dnhlms.com/2016/02/sql-clr-based-string-splitting-and.html
So, I swiped the code from Dan's post, changed it to use my functions, and ran it through Plan Explorer:
DECLARE @s VARCHAR(MAX);

SELECT * FROM dbo.SplitStrings_CLR(@s, ',') s
CROSS APPLY   dbo.SplitStrings_CLR(s.value, ';') s1
CROSS APPLY   dbo.SplitStrings_CLR(s1.value, '!') s2
CROSS APPLY   dbo.SplitStrings_CLR(s2.value, '#') s3;

SELECT * FROM dbo.SplitStrings_Numbers(@s, ',') s
CROSS APPLY   dbo.SplitStrings_Numbers(s.value, ';') s1
CROSS APPLY   dbo.SplitStrings_Numbers(s1.value, '!') s2
CROSS APPLY   dbo.SplitStrings_Numbers(s2.value, '#') s3;

SELECT * FROM dbo.SplitStrings_Native(@s, ',') s
CROSS APPLY   dbo.SplitStrings_Native(s.value, ';') s1
CROSS APPLY   dbo.SplitStrings_Native(s1.value, '!') s2
CROSS APPLY   dbo.SplitStrings_Native(s2.value, '#') s3;
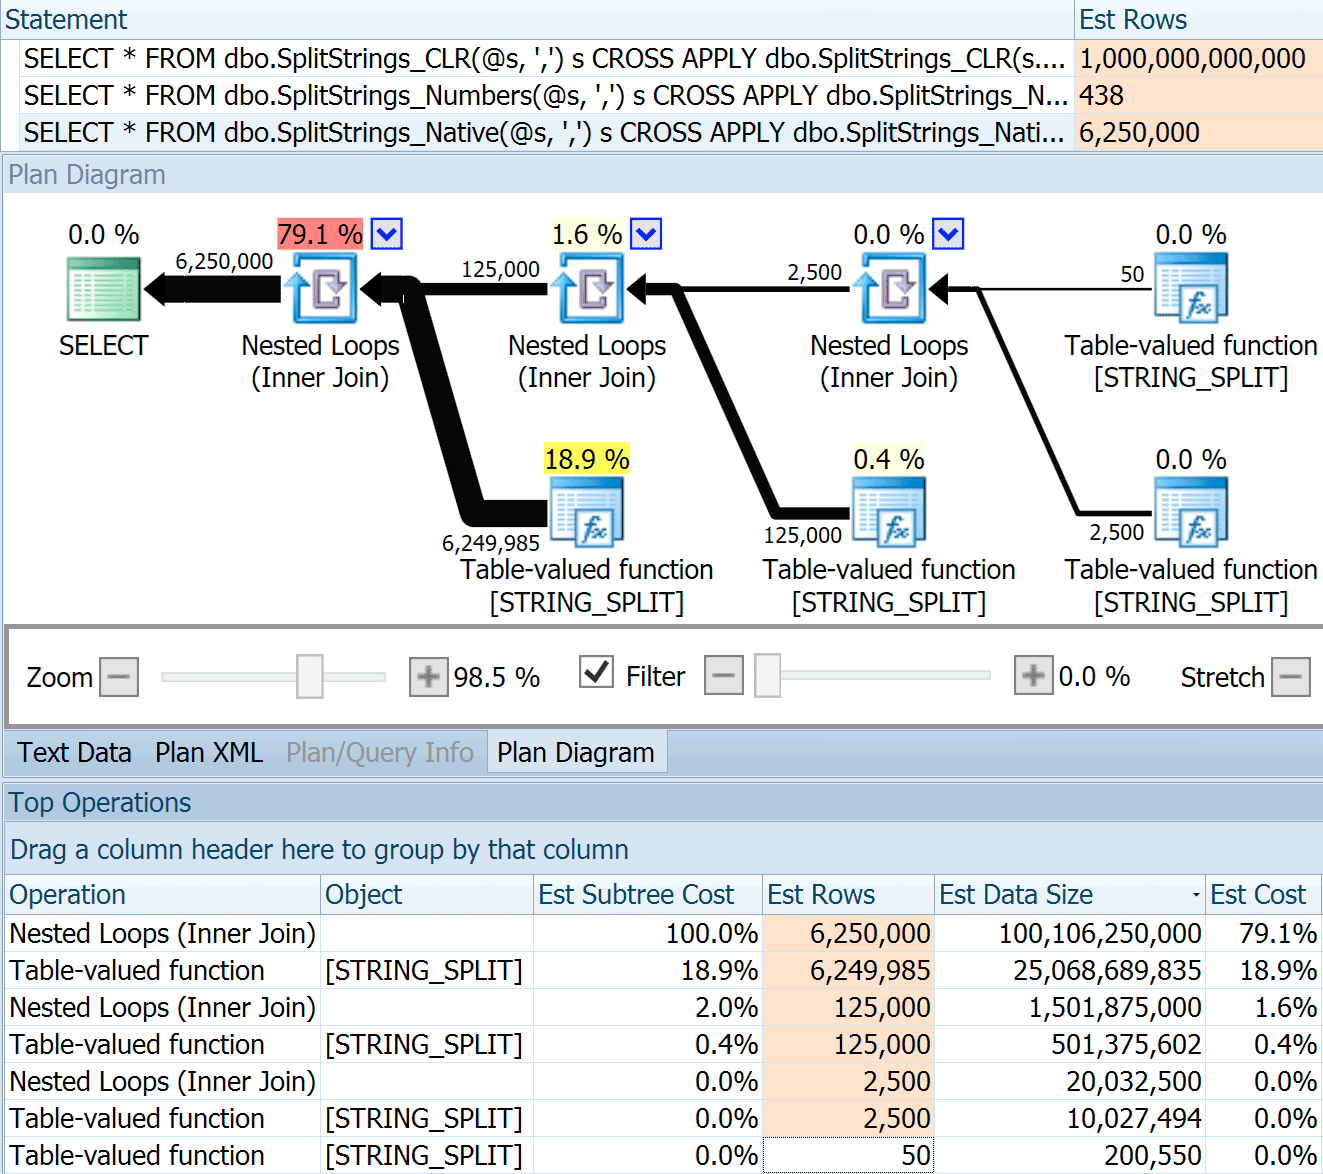
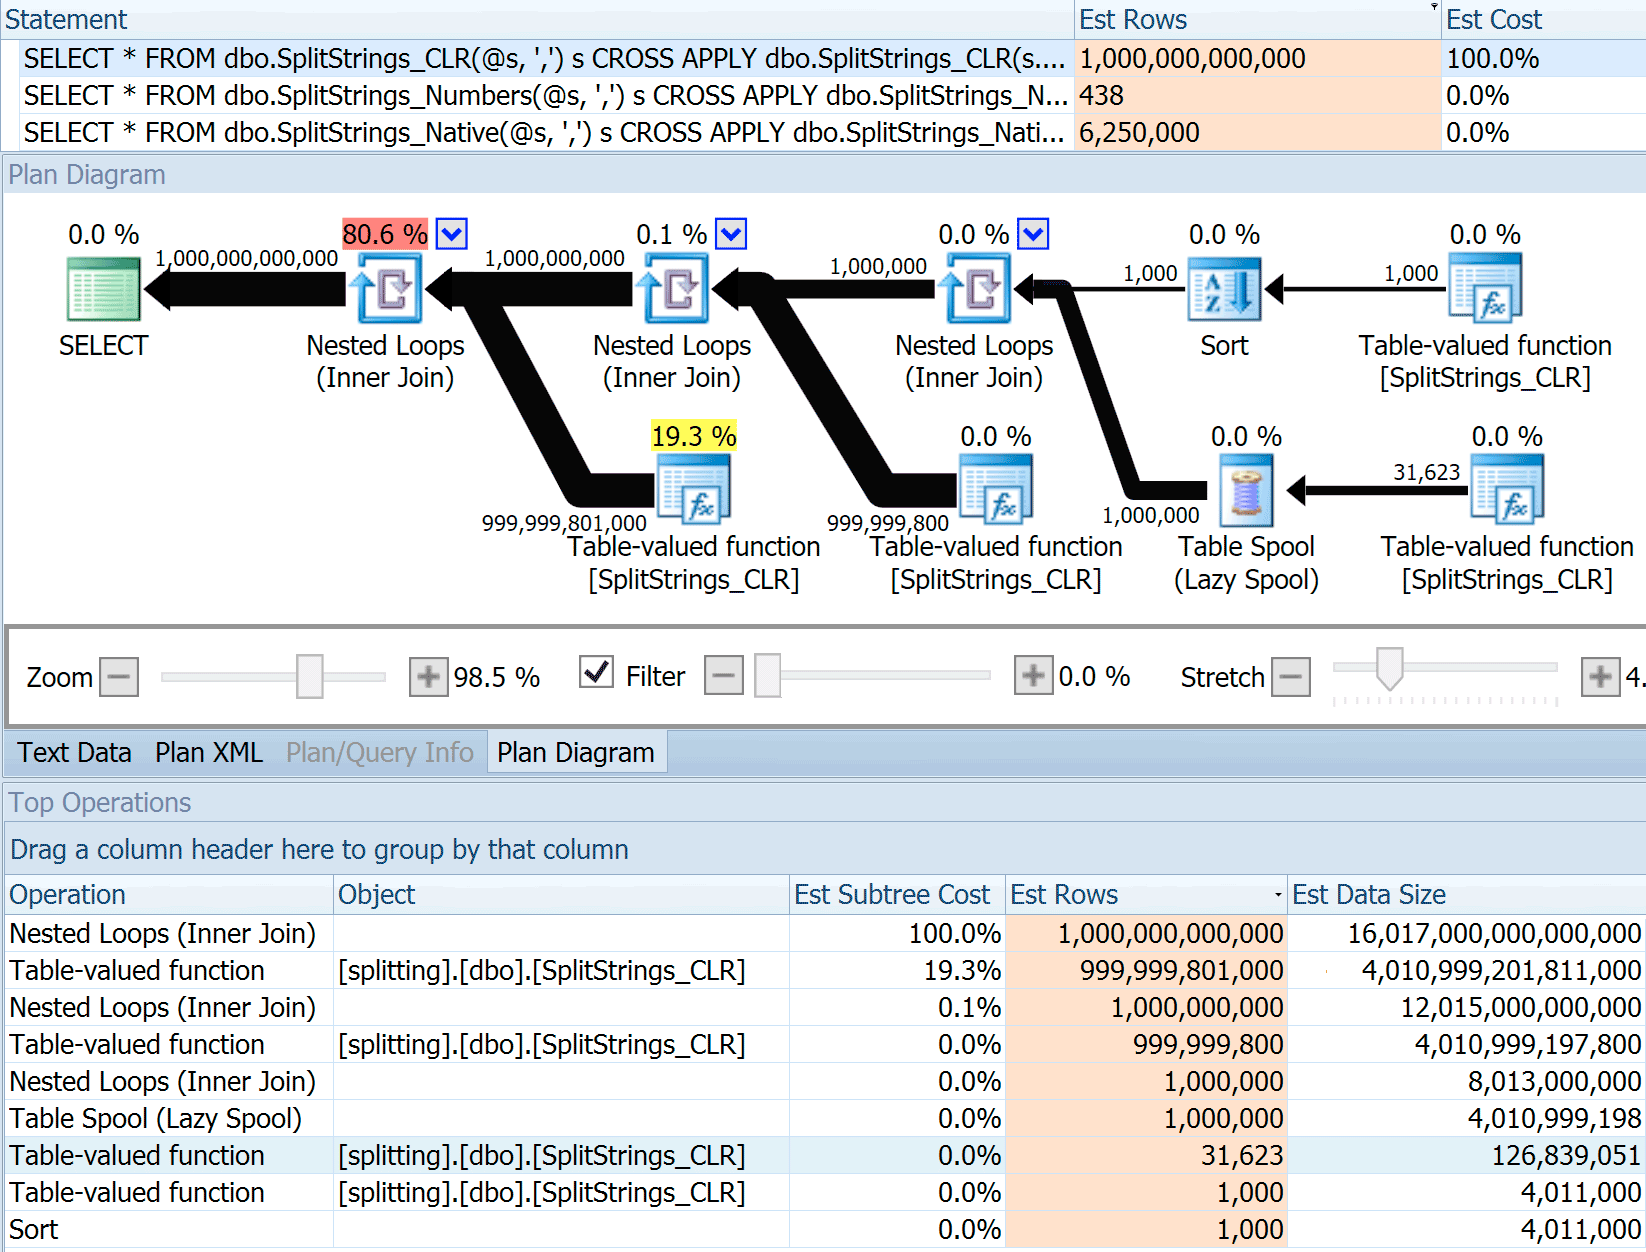
The SPLIT_STRING approach certainly comes up with *better* estimates than CLR, but still grossly over (in this case, when the string is empty; this might not always be the case). The function has a built-in default that estimates the incoming string will have 50 elements, so when you nest them you get 50 x 50 (2,500); if you nest them again, 50 x 2,500 (125,000); and then finally, 50 x 125,000 (6,250,000):
Note: OPENJSON() behaves the exact same way as STRING_SPLIT – it, too, assumes 50 rows will come out of any given split operation. I am thinking that it might be useful to have a way to hint cardinality for functions like this, in addition to trace flags like 4137 (pre-2014), 9471 & 9472 (2014+), and of course 9481…
This 6.25 million row estimate is not great, but it is much better than the CLR approach that Dan was talking about, which estimates A TRILLION ROWS, and I lost count of the commas to determine data size – 16 petabytes? exabytes?
Some of the other approaches obviously fare better in terms of estimates. The Numbers table, for example, estimated a much more reasonable 438 rows (in SQL Server 2016 RC2). Where does this number come from? Well, there are 8,000 rows in the table, and if you remember, the function has both an equality and an inequality predicate:
     WHERE Number <= LEN(@List)
     AND SUBSTRING(@Delimiter + @List, [Number], 1) = @Delimiter
So, SQL Server multiplies the number of rows in the table by 10% (as a guess) for the equality filter, then the square root of 30% (again, a guess) for the inequality filter. The square root is due to exponential backoff, which Paul White explains here. This gives us:
The XML variation estimated a little over a billion rows (due to a table spool estimated to be executed 5.8 million times), but its plan was far too complex to try to illustrate here. In any case, remember that estimates clearly don't tell the whole story - just because a query has more accurate estimates does not mean it will perform better.
There were a few other ways I could tweak the estimates a bit: namely, forcing the old cardinality estimation model (which affected both the XML and Numbers table variations), and using TFs 9471 and 9472 (which affected only the Numbers table variation, since they both control cardinality around multiple predicates). Here were the ways I could change the estimates just a little bit (or A LOT, in the case of reverting to the old CE model):
The old CE model brought the XML estimates down by an order of magnitude, but for the Numbers table, completely blew it up. The predicate flags altered the estimates for the Numbers table, but those changes are much less interesting.
None of these trace flags had any effect on the estimates for the CLR, JSON, or STRING_SPLIT variations.
Conclusion
So what did I learn here? A whole bunch, actually:
- Parallelism can help in some cases, but when it doesn't help, it really doesn't help. The JSON methods were ~5x faster without parallelism, and
STRING_SPLITwas nearly 10x faster. - The spool actually helped the CLR approach perform better in this case, but TF 8690 might be useful to experiment with in other cases where you're seeing spools and are trying to improve performance. I am certain there are situations where eliminating the spool will end up being better overall.
- Eliminating the spool really hurt the XML approach (but only drastically so when it was forced to be single-threaded).
- Lots of funky things can happen with estimates depending on the approach, along with the usual statistics, distribution, and trace flags. Well, I suppose I already knew that, but there are definitely a couple of good, tangible examples here.
Thank you to the folks who asked questions or prodded me to include more information. And as you might have guessed from the title, I address yet another question in a second follow-up, this one about TVPs:








We can isolate each functions performance by trying this:
declare @r1 varchar(100);
declare @r2 varchar(100);
declare @r3 varchar(100);
SELECT
@r1 = s1.value
, @r2 = s2.value
, @r3 = s3.value
FROM
dbo.SplitStrings_Native(@s, ',') s
CROSS APPLY dbo.SplitStrings_Native(s.value, ';') s1
CROSS APPLY dbo.SplitStrings_Native(s1.value, '!') s2
CROSS APPLY dbo.SplitStrings_Native(s2.value, '#') s3
;
This executes all the same functional code that would happen when returning a set to a client or when writing to a temp table.
But by assigning to variables, we eliminate disk and network I/O.
Worth a shot I would say ;)
Hi Peter, thanks, that's kind of what I did in the first test (without the nesting of course) to compare the methods without disk/network. But I felt that wasn't a completely meaningful test because people aren't parsing thousands of comma-separated string values to assign a single, arbitrary value to a scalar variable. :-) In this case, I wanted to test the performance with disk at least taken into account, but not overwhelming my machine.