A few weeks ago the SQLskills team was in Tampa for our Performance Tuning Immersion Event (IE2) and I was covering baselines. Baselines is a topic that’s near and dear to my heart, because they are so valuable for many reasons. Two of those reasons, which I always bring up whether teaching or working with clients, are using baselines to troubleshoot performance, and then also trending usage and providing capacity planning estimates. But they’re also essential when you’re doing performance tuning or testing – whether you think of your existing performance metrics as baselines or not.
During the module, I reviewed different sources for data such as Performance Monitor, the DMVs, and trace or XE data, and a question came up related to data loads. Specifically, the question was whether is it better to load data into a table with no indexes, and then create them when finished, versus having the indexes in place during the data load. My response was, “Typically, yes". My personal experience has been that this is always the case, but you never know what caveat or one-off scenario someone might run into where the performance change is not what was expected, and as with all performance questions, you don’t know for certain until you test it. Until you establish a baseline for one method and then see if the other method improves upon that baseline, you’re only guessing. I thought it would be fun to test this scenario, not just to prove what I expect to be true, but also to show what metrics I would examine, why, and how to capture them. If you’ve done performance testing previously, this is probably old hat. But for those of you new to the practice, I’ll step through the process I follow to help get you started. Realize that there are many ways to derive the answer to, “Which method is better?” I expect that you will take this process, tweak it, and make it yours over time.
What Are You Trying to Prove?
The first step is to decide exactly what you’re testing. In our case it’s straight-forward: is it faster to load data into an empty table, then add the indexes, or is it faster to have the indexes on the table during the data load? But, we can add some variation here if we want. Consider the time it takes to load data into a heap, and then create the clustered and nonclustered indexes, versus the time it takes to load data into a clustered index, and then create the nonclustered indexes. Is there a difference in performance? Would the clustering key be a factor? I expect that the data load will cause existing nonclustered indexes to fragment, so perhaps I want to see what impact rebuilding the indexes after the load has on the total duration. It’s important to scope this step as much as possible, and be very specific about what you want to measure, as this will determine what data you capture. For our example, our four tests will be:
Test 1: Load data into a heap, create the clustered index, create the nonclustered indexes
Test 2: Load data into a clustered index, create the nonclustered indexes
Test 3: Create the clustered index and nonclustered indexes, load the data
Test 4: Create the clustered index and nonclustered indexes, load the data, rebuild the nonclustered indexes
What Do You Need to Know?
In our scenario, our primary question is “what method is fastest”? Therefore, we want to measure duration and to do so we need to capture a start time and an end time. We could leave it at that, but we may want to understand what resource utilization looks like for each method, or perhaps we want to know the highest waits, or the number of transactions, or the number of deadlocks. The data that is most interesting and relevant will depend on what processes you’re comparing. Capturing the number of transactions is not that interesting for our data load; but for a code change it might be. Because we are creating indexes and rebuilding them, I am interested in how much IO each method generates. While overall duration is probably the deciding factor in the end, looking at IO might be useful to not only understand what option generates the most IO, but also whether the database storage is performing as expected.
Where is the Data You Need?
Once you’ve determined what data you need, decide from where it will be captured. We are interested in duration, so we want to record the time each data load test starts, and when it ends. We are also interested in IO, and we can pull this data from multiple locations – Performance Monitor counters and the sys.dm_io_virtual_file_stats DMV come to mind.
Understand that we could get this data manually. Before we run a test, we can select against sys.dm_io_virtual_file_stats and save the current values to a file. We can note the time, and then start the test. When it finishes, we note the time again, query sys.dm_io_virtual_file_stats again and calculate differences between values to measure IO.
There are numerous flaws in this methodology, namely that it leaves significant room for error; what if you forget to note the start time, or forget to capture file stats before you start? A much better solution is to automate not just the execution of the script, but also the data capture. For example, we can create a table that holds our test information – a description of what the test is, what time it started, and what time it completed. We can include the file stats in the same table. If we are collecting other metrics, we can add those to the table. Or, it may be easier to create a separate table for each set of data we capture. For example, if we store file stats data in a different table, we need to give each test a unique id, so that we can match our test with the right file stats data. When capturing file statistics, we have to capture the values for our database before we start, and then after, and calculate the difference. We can then store that information into its own table, along with the unique test ID.
A Sample Exercise
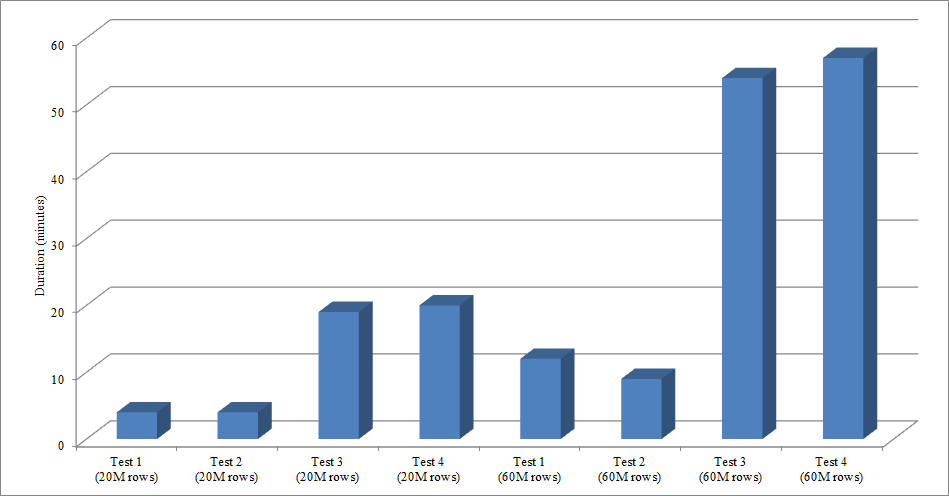
For this test I created an empty copy of the Sales.SalesOrderHeader table named Sales.Big_SalesOrderHeader, and I used a variation of a script I used in my partitioning post to load data into the table in batches of approximately 25,000 rows. You can download the script for the data load here. I ran it four times for each variation, and I also varied the total number of rows inserted. For the first set of tests I inserted 20 million rows, and for the second set I inserted 60 million rows. The duration data is not surprising:
Loading data, without the nonclustered indexes, is much faster than loading it with the nonclustered indexes already in place. What I did find interesting is that for the load of 20 million rows, the total duration was about the same between Test 1 and Test 2, but Test 2 was faster when loading 60 million rows. In our test, our clustering key was SalesOrderID, which is an identity and therefore a good clustering key for our load since it is ascending. If we had a clustering key that was a GUID instead, the load time may be higher because of random inserts and page splits (another variation that we could test).
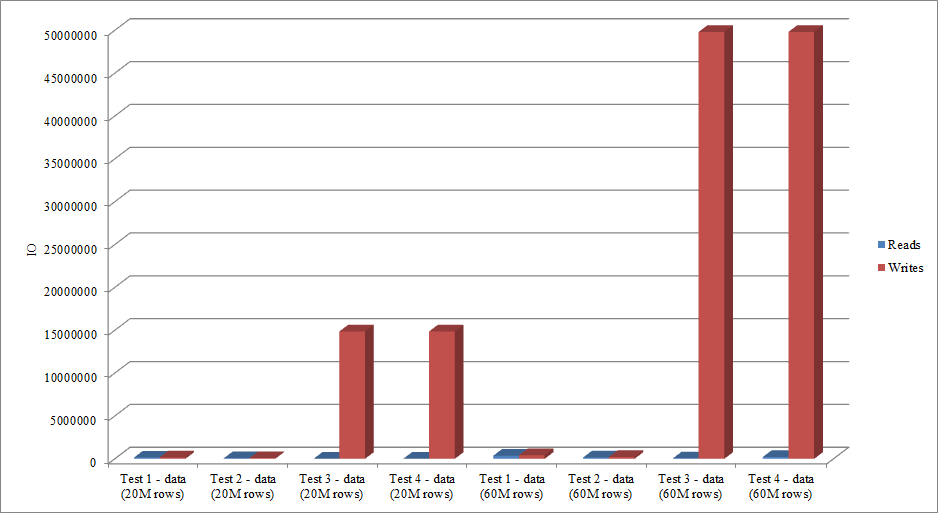
Does the IO data mimic the trend in duration data? Yes, with the differences having the indexes already in place, or not, even more exaggerated:
The method that I’ve presented here for performance testing, or measuring changes in performance based on modifications to code, design, etc., is just one option for capturing baseline information. In some scenarios, this may be overkill. If you have one query you’re trying to tune, setting up this process to capture data might take longer than it would to make tweaks to the query! If you’ve done any amount of query tuning, you’re probably in the habit of capturing STATISTICS IO and STATISTICS TIME data, along with the query plan, and then comparing the output as you make changes. I've been doing this for years, but I recently discovered a better way… SQL Sentry Plan Explorer PRO. In fact, after I completed all the load testing I described above, I went through and re-ran my tests through PE, and found I could capture the information I wanted, without having to set up my data collection tables.
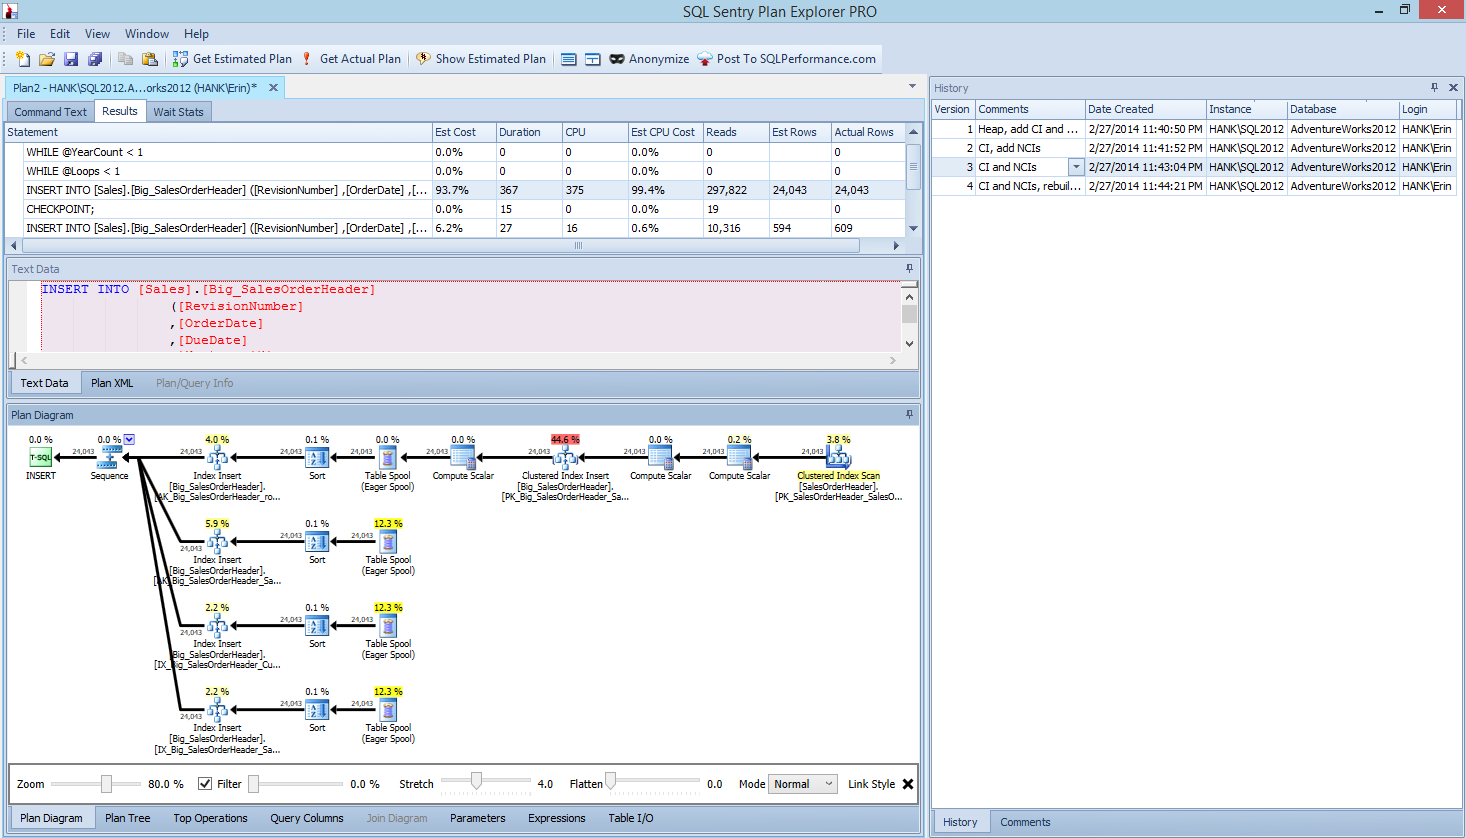
Within Plan Explorer PRO you have the option to get the actual plan – PE will run the query against the selected instance and database, and return the plan. And with it, you get all the other great data that PE provides (time statistics, reads and writes, IO by table), as well as the wait statistics, which is a nice benefit. Using our example, I started with the first test – creating the heap, loading data and then adding the clustered index and nonclustered indexes – and then ran the option Get Actual Plan. When it completed I modified my script test 2, ran the option Get Actual Plan again. I repeated this for the third and fourth tests, and when I was finished, I had this:

Plan Explorer PRO view after running 4 tests
Notice the history pane on the right side? Every time I modified my code and recaptured the actual plan, it saved a new set of information. I have the ability to save this data as a .pesession file to share with another member of my team, or go back later and scroll through through the different tests, and drill into different statements within the batch as necessary, looking at different metrics such as duration, CPU, and IO. In the screen shot above, I've highlighted the INSERT from Test 3, and the query plan shows the updates to all four nonclustered indexes.
Summary
As with so many tasks in SQL Server, there are many ways to capture and review data when you're running performance tests or performing tuning. The less manual effort you have to put forth, the better, as it leaves more time to actually make changes, understand the impact, and then move on to your next task. Whether you customize a script to capture data, or let a third party utility do it for you, the steps I outlined are still valid:
- Define what you want improve
- Scope your testing
- Determine what data can be used to measure improvement
- Decide how to capture the data
- Set up an automated method, whenever possible, for testing and capture
- Test, evaluate, and repeat as necessary
Happy testing!


I am a regular vitisor of your blog. Learnt a lot about indexes and tried out many of your ideas. I am currently working on refining Non clustered indexes on one our legacy tables (with around 15 million rows and growing). We have a couple of NC indexes where the key columns are repeated in more than one index. I am trying to remove the redundant key columns from these NC indexes.Since the table is a legacy table I am not really aware about how the processes query the table (most of the sql calls against this table are inline statements in Java code), so I wanted to take a route that is least risky but I am afraid it might not buy me any major benefit. We have three key columns being repeated in three of the NC indexes. I am planning on creating one new NC index on the three repeated columns and remove the three columns from the existing NC indexes. But I am worried that if the person who created those initial NC indexes repeated those columns because they wanted to cover a particular query so I am planing on actually removing the three repeated key columns and include those columns so that all existing queries would still be covered. But by creating a new NC index on the three columns and including those three columns in the three existing NC indexes, I am not sure if I would get any performance benefit on DML operations. I am thinking I should atleast get a benefit on CPU resources as sorting of data is no longer required for the existing indexes. Are there any other gains I can expect with this approach. In this regard I wanted to see if you have done this or if you have any better ideas to see more performance gains
Hi Jonas-
An answer to one part of your question: if you drop three indexes and create a new one to replace those three (so the net is you removed two indexes) then *in general*, yes, I would expect a performance benefit with regard to DML operations. I'm sure there is some way that you could do this so that there wouldn't be a benefit, but for the most part, removing indexes reduces overhead with regard to CPU, memory, and disk.
But as to whether this is the right thing for you to do, I don't have enough information to answer that. You've told me that three indexes have the same three key columns, but I know nothing else about the indexes (are they all nonclustered or is one of them clustered? are there included columns? are there filters? are there constraints?), so I can't provide any guidance. Your question doesn't have a quick answer, unfortunately. I understand that you haven't determined what queries access the table, but that's an important thing to figure out before you drop indexes. It's possible to do with DMVs, tracking, and/or Extended Events. You could also talk to the developers – they may be able to provide insight.
Hope that helps,
Erin