
Dealing With Explosive sysjobhistory Growth
In the first few days of my new role at Infios, we came across an interesting case of memory exhaustion. A whole slew of memory-related error messages would populate the errorlog, then some stack and memory dumps would appear, and then the SQL Server service would just shut itself down without warning. Some of the errors we observed (apologies, it's a long list, but I want to make sure that any subset might land you here):
There is insufficient system memory in resource pool 'default' to run this query.
Error: 17803, Severity: 20, State: 13.
There was a memory allocation failure during connection establishment. Reduce nonessential memory load, or increase system memory. The connection has been closed.
sp_server_diangostics encountered a long delay that was 2.5 times more than the repeat interval between two consecutive diagnostics result generations. The repeat interval: 10000000, the elapsed time of this diagnostics result generation: 24558309, the elapsed time between the latest two diagnostics result generations: 34563265.
Failed allocate pages: FAIL_PAGE_ALLOCATION 128
Failed allocate pages: FAIL_PAGE_ALLOCATION 129
Error: 18056, Severity: 20, State: 29.
The client was unable to reuse a session with SPID 409, which had been reset for connection pooling. The failure ID is 29. This error may have been caused by an earlier operation failing. Check the error logs for failed operations immediately before this error message.
/* Sometimes, there wasn’t even enough memory to properly format that message: */
Error: 18056, Severity: 20, State: 29. (Params:).
The error is printed in terse mode because there was error during formatting. Tracing, ETW, notifications etc are skipped.
Error: 8645, Severity: 17, State: 1.
A timeout occurred while waiting for memory resources to execute the query in resource pool 'default' (2). Rerun the query.
Error: 18456, Severity: 14, State: 23.
Login failed for user '<user>'. Reason: Access to server validation failed while revalidating the login on the connection.
Error: 17300, Severity: 16, State: 1.
SQL Server was unable to run a new system task, either because there is insufficient memory or the number of configured sessions exceeds the maximum allowed in the server. Verify that the server has adequate memory. Use sp_configure with option 'user connections' to check the maximum number of user connections allowed. Use sys.dm_exec_sessions to check the current number of sessions, including user processes.
Stopped listening on listener network name '<name>' (VNN or DISTRIBUTED_NETWORK_NAME). No user action is required.
Always On: The local replica of availability group '<ag name>' is preparing to transition to the resolving role. This is an informational message only. No user action is required.
Always On: The availability replica manager is going offline because SQL Server is shutting down. This is an informational message only. No user action is required.
Error: 17188, Severity: 16, State: 1.
SQL Server cannot accept new connections, because it is shutting down. The connection has been closed.
We restarted the service, then monitored processes, checked jobs, and looked at Query Store in the application database. We couldn’t immediately find the culprit, so I created an Extended Events session to capture large, slow, or failing memory grants:
CREATE EVENT SESSION MemoryGrants
ON SERVER
ADD EVENT sqlserver.error_reported
(
    ACTION
    (
        sqlserver.client_app_name,
        sqlserver.client_hostname,
        sqlserver.username,
        sqlserver.sql_text
    )
    WHERE
    (
           [error_number] = 701
        OR [error_number] = 8645
        OR [error_number] = 8465
        OR [error_number] = 17300
        OR [error_number] = 17803
        OR [error_number] = 18056
    )
),
ADD EVENT sqlserver.query_memory_grant_wait_begin
(
    ACTION
    (
        sqlserver.client_app_name,
        sqlserver.client_hostname,
        sqlserver.username,
        sqlserver.sql_text
    )
),
ADD EVENT sqlserver.query_memory_grant_wait_end
(
    ACTION
    (
        sqlserver.client_app_name,
        sqlserver.client_hostname,
        sqlserver.username,
        sqlserver.sql_text
    )
),
ADD EVENT sqlserver.query_memory_grants
(
    ACTION
    (
        sqlserver.client_app_name,
        sqlserver.client_hostname,
        sqlserver.username,
        sqlserver.plan_handle,
        sqlserver.sql_text
    )
    WHERE
    (
        requested_memory_kb >= 524288 -- half a GB
    )
)
ADD TARGET package0.event_file
(
    SET filename           = N'\MemoryGrants.xel',
        max_file_size      = 128,
        max_rollover_files = 10
)
WITH
(
    MAX_DISPATCH_LATENCY = 5 SECONDS,
    TRACK_CAUSALITY      = ON,
    STARTUP_STATE        = ON
);
GO

ALTER EVENT SESSION MemoryGrants ON SERVER STATE = START;
This yielded a query against sysjobhistory from a vendor tool (not a famous household name in the SQL Server space). The tool was checking msdb every 5 minutes for any new job or step failures, with a query like this:
SELECT TOP(100) c.*,
       sc.name AS category_name,
       …lots of columns…,
       'Failed' AS job_status
  FROM (
        SELECT …lots of columns…
          FROM msdb.dbo.sysjobs sj
          JOIN msdb.dbo.sysjobactivity sja
            ON sja.job_id = sj.job_id
          JOIN msdb.dbo.sysjobhistory sjh_outcome
            ON sjh_outcome.instance_id = sja.job_history_id
          JOIN (
                SELECT sjhl.job_id,
                       sjhl.step_id,
                       sjhl.step_name,
                       sjhl.message,
                       sjhl.sql_severity,
                       MAX(sjhl.run_date + sjhl.run_time) AS last_run
                  FROM msdb.dbo.sysjobhistory sjhl
                 GROUP BY sjhl.job_id   ,
                          sjhl.step_id  ,
                          sjhl.step_name,
                          sjhl.message  ,
                          sjhl.sql_severity
                )
             AS sjh_last
             ON sjh_last.job_id  = sja.job_id
            AND sjh_last.step_id = sja.last_executed_step_id
          CROSS APPLY
                (SELECT CHARINDEX('\', sjh_outcome.server) AS shp(server_sep_idx)
           JOIN msdb.dbo.sysjobservers AS sjs     ON sjs.job_id = sj.job_id
            AND sjs.server_id = sj.originating_server_id
           LEFT JOIN msdb.dbo.systargetservers AS sts
             ON sts.server_id = sjs.server_id   ) AS c
           JOIN msdb.dbo.syscategories AS sc
             ON sc.category_id = c.category_id
          CROSS APPLY
          (
            SELECT CASE
                   WHEN time_zone_adjustment = 0
                   THEN DATEADD(HOUR, DATEDIFF(HOUR, GETDATE(), GETUTCDATE()), stop_execution_date)
                   ELSE DATEADD(HOUR, -time_zone_adjustment, stop_execution_date)
                   END AS stop_execution_date_utc
          ) AS dt
         WHERE dt.stop_execution_date_utc >= DATEADD(MINUTE, -5, GETUTCDATE())
           AND run_status = 0
         ORDER BY stop_execution_date DESC;
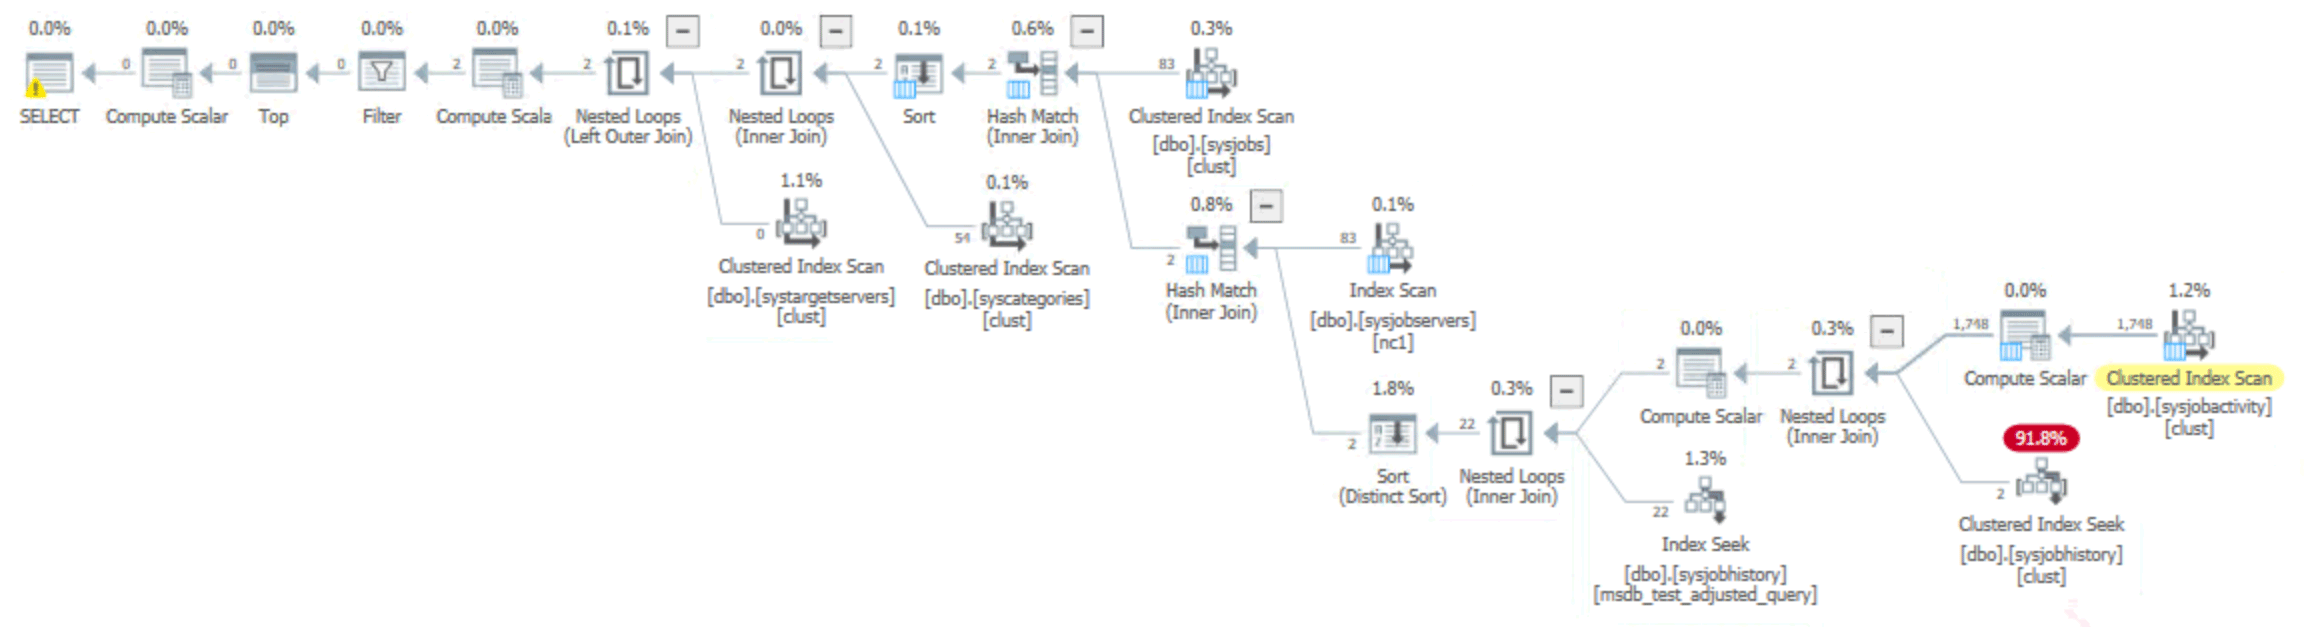
The problem is there isn’t a suitable index on sysjobhistory to support the subquery, so it ends up with a costly scan along with multiple sorts and hash matches:
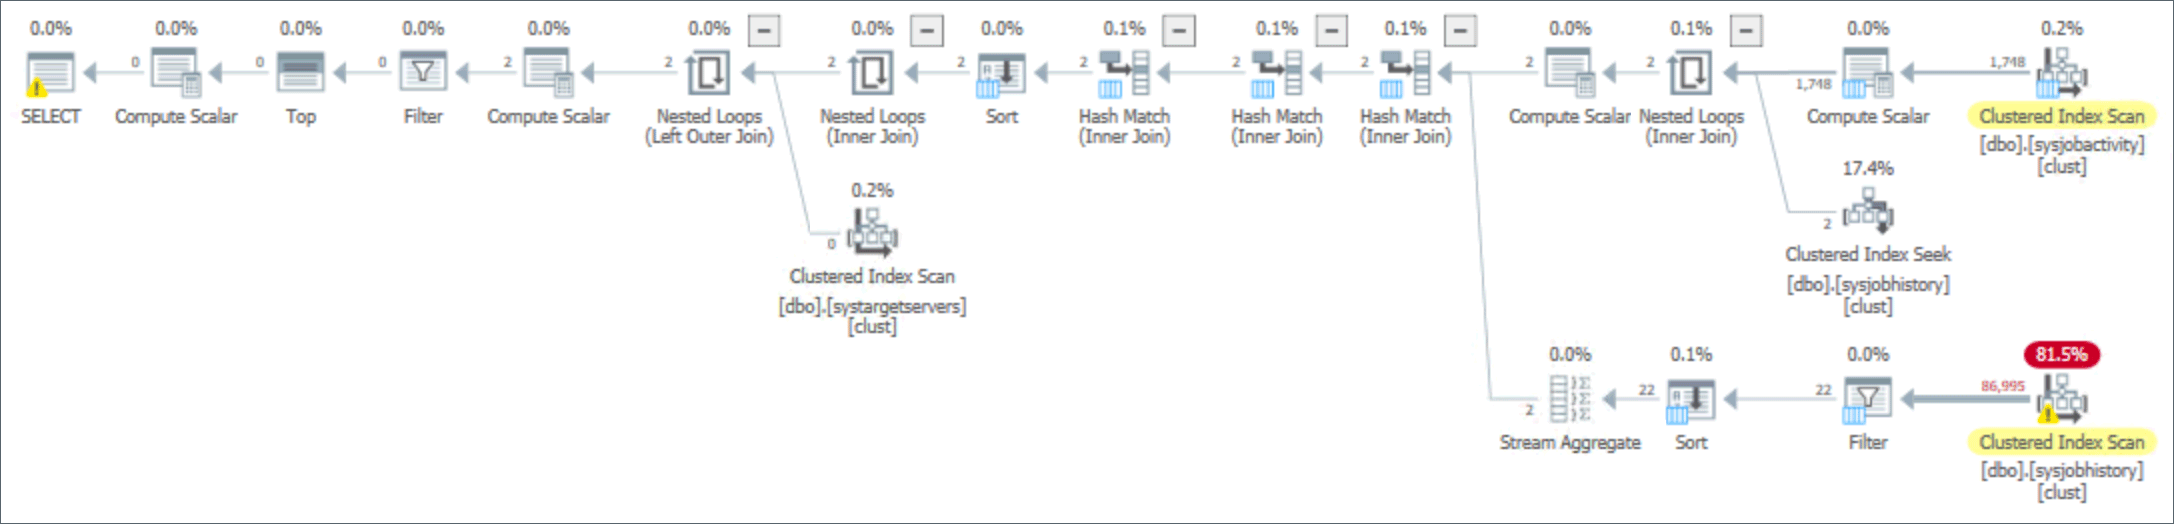
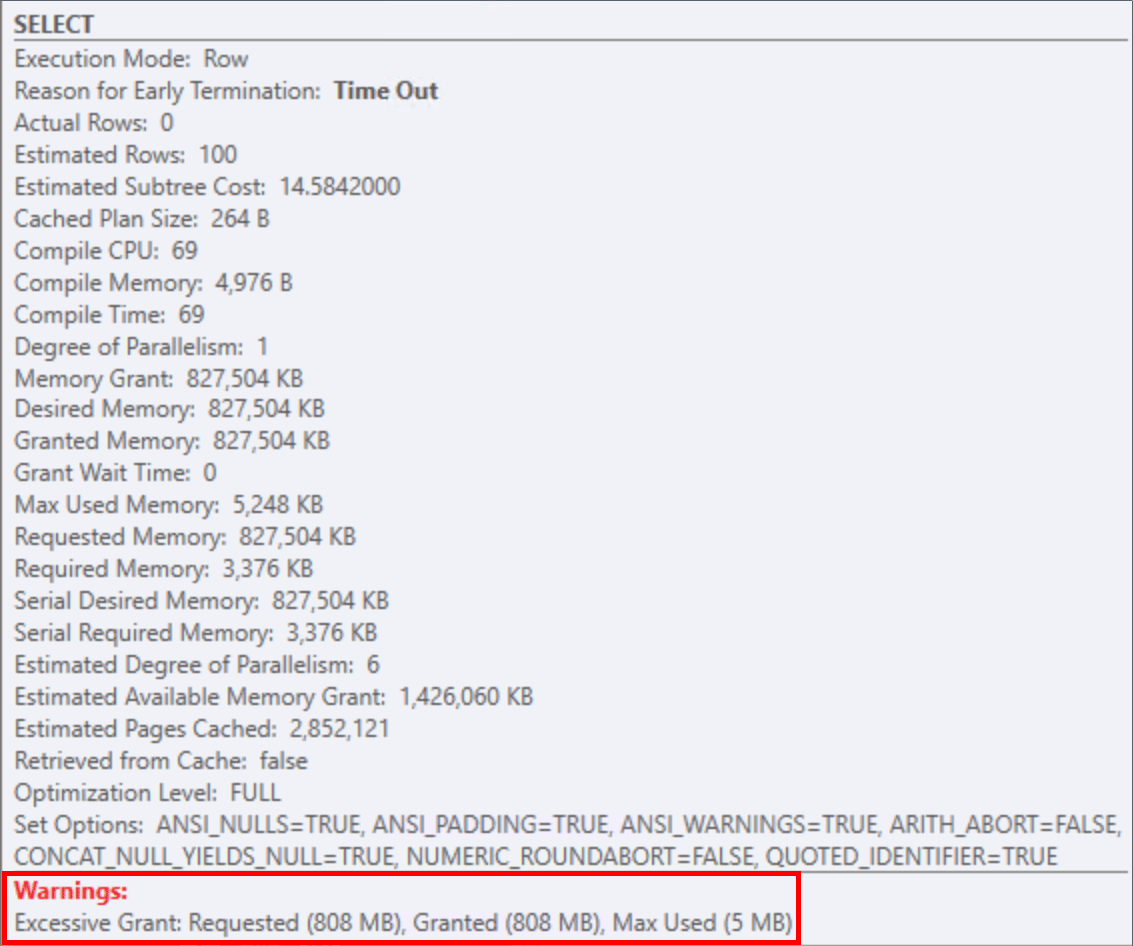
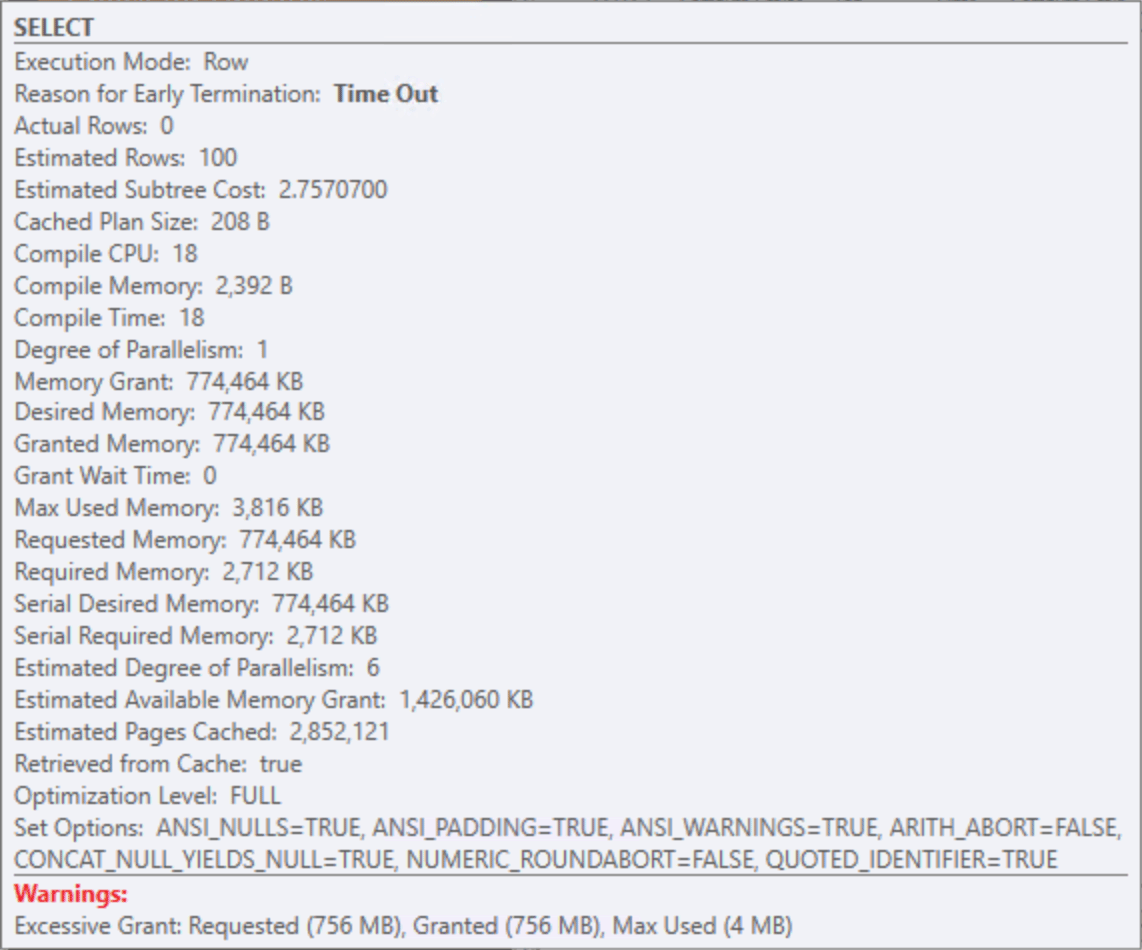
This makes the memory grant proportional to the number of rows in sysjobhistory, and we saw grants approaching 1GB. On a system with very little history at all (less than 90,000 rows), this grant of 800MB is still alarming:
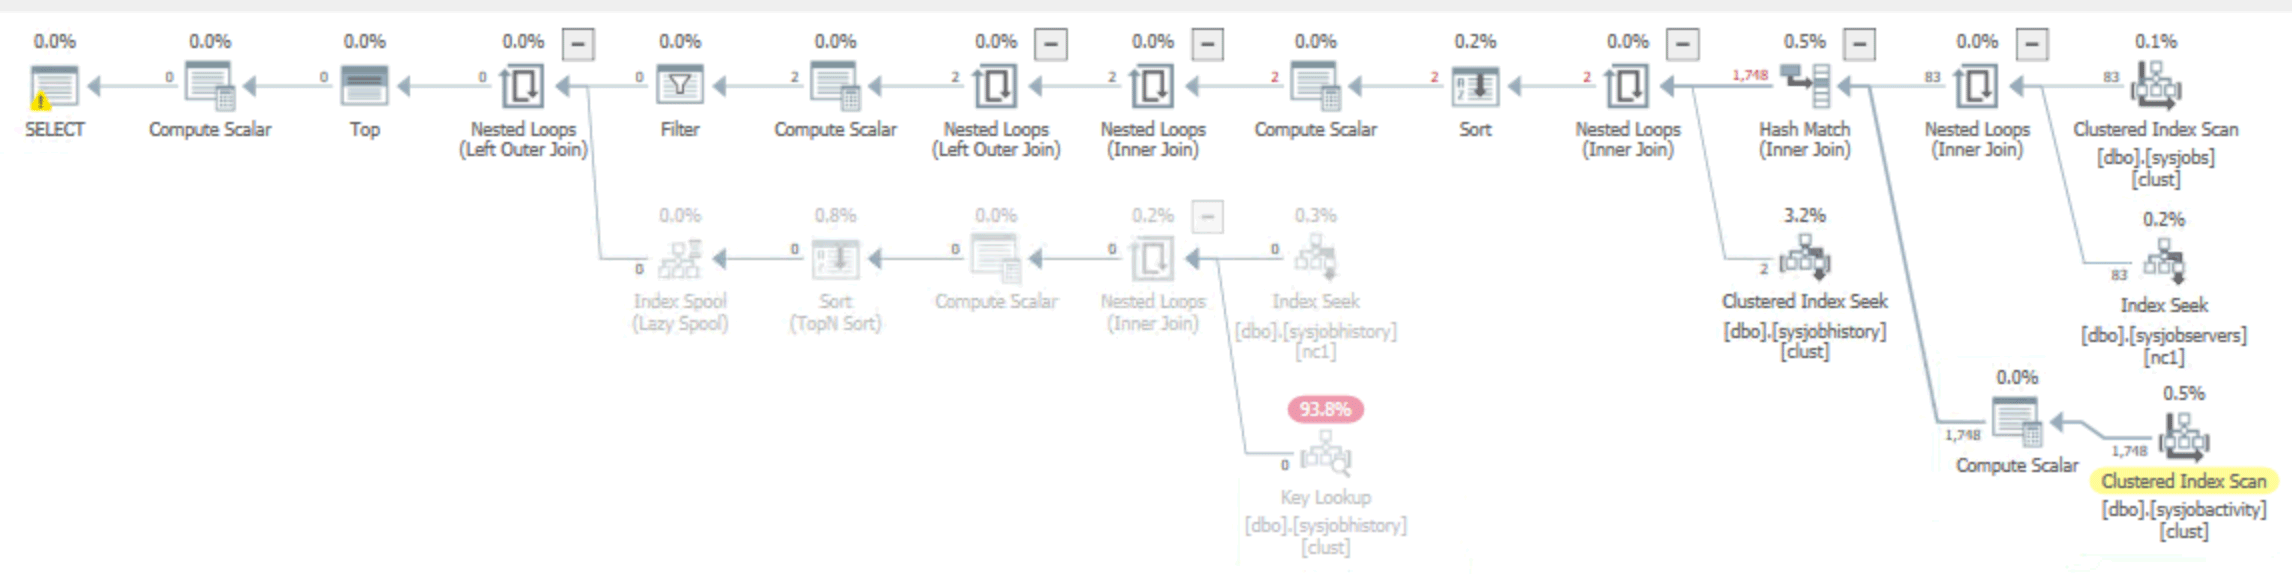
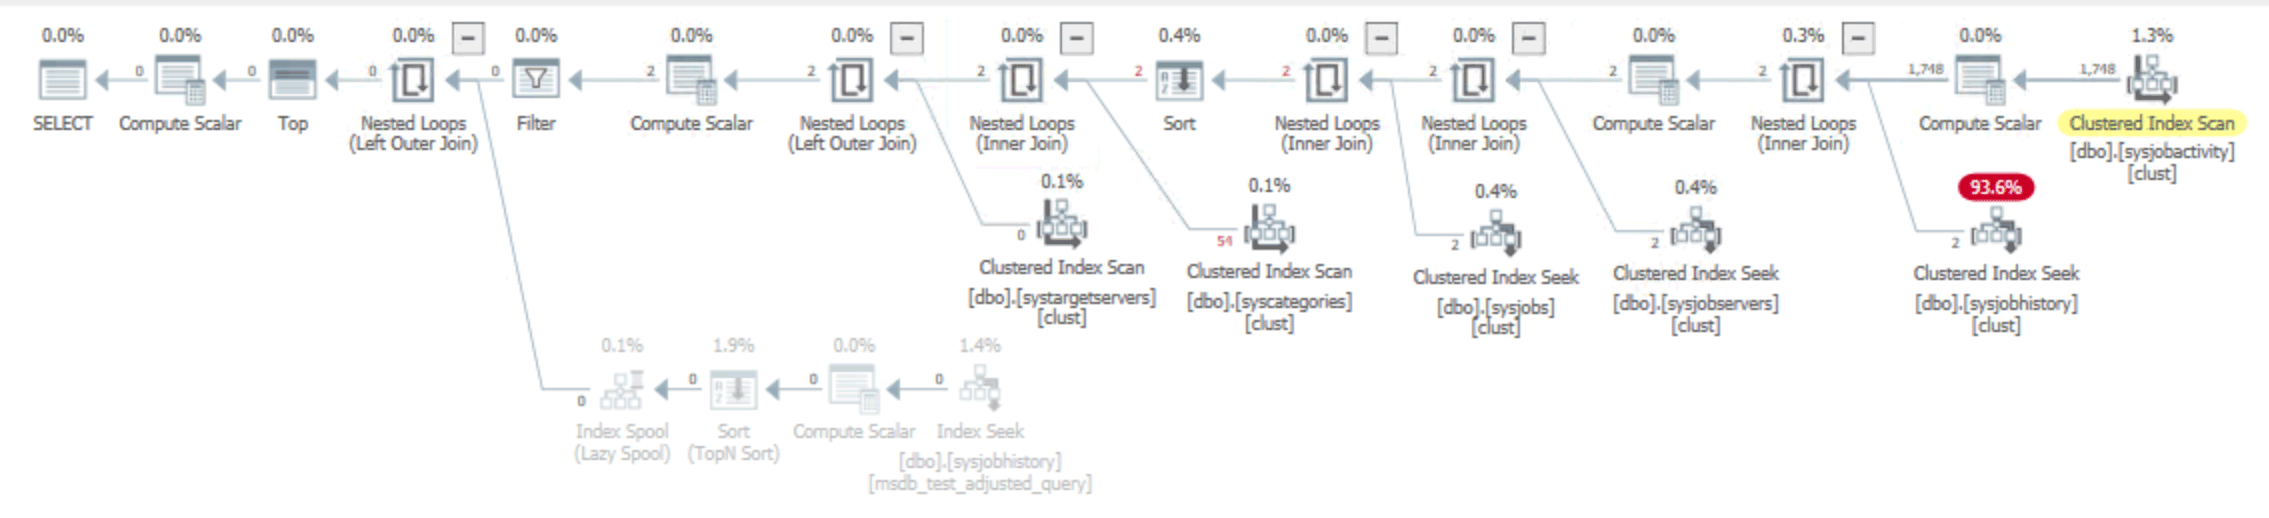
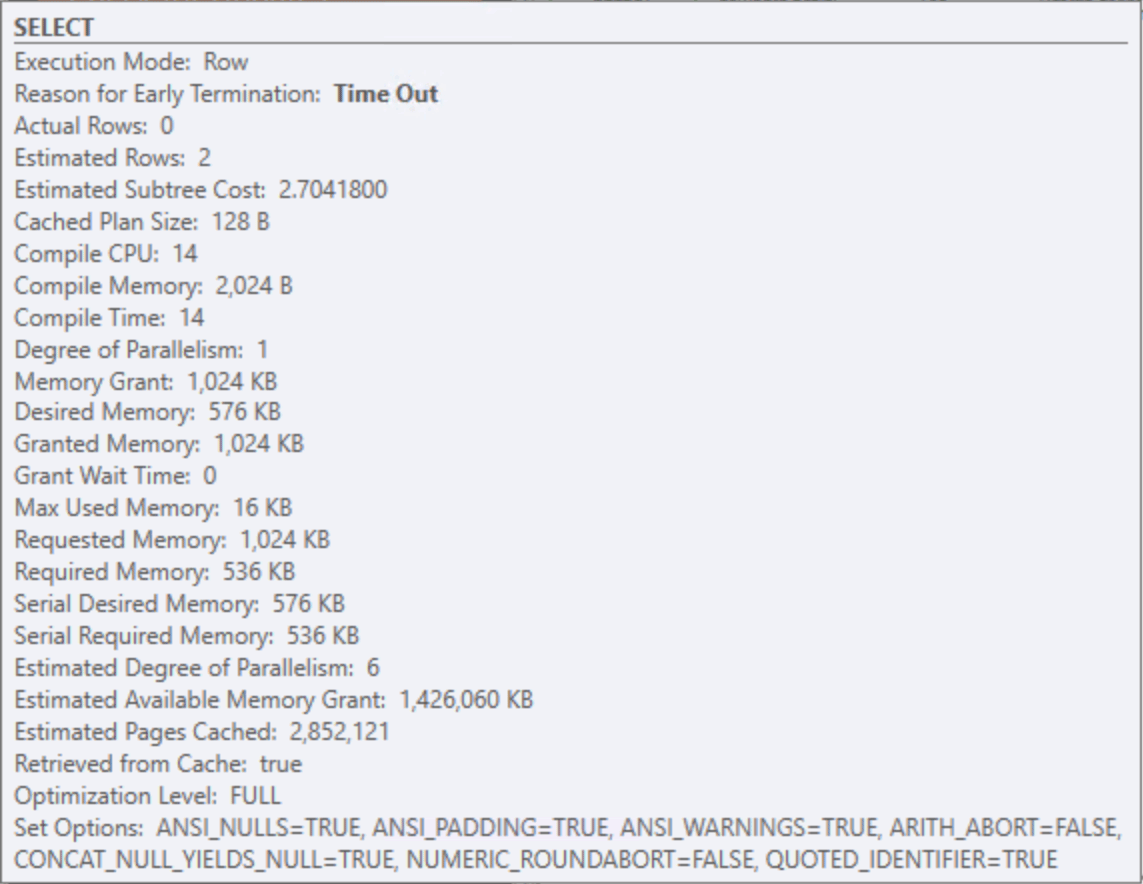
I quickly wrote up an alternative version of this query, managing to avoid at least one sort and a couple of hash matches, leading to a small and constant memory grant – even at millions of rows in sysjobhistory:
;WITH recent_failures AS
(
    SELECT sja.job_id,
           sja.job_history_id,
           sja.start_execution_date,
           sja.stop_execution_date,
           sjs.server_id,
           COALESCE(sts.time_zone_adjustment, 0) AS time_zone_adjustment,
           sj.name                               AS job_name,
           sj.category_id,
           sjh_outcome.message                   AS outcome_message,
           sjh_outcome.run_status                AS outcome_run_status,
           sjh_outcome.retries_attempted,
           sjh_outcome.server                    AS outcome_server,
           sjh_outcome.step_id                   AS outcome_step_id
      FROM msdb.dbo.sysjobactivity AS sja
     INNER JOIN msdb.dbo.sysjobs AS sj
        ON sj.job_id = sja.job_id
     INNER JOIN msdb.dbo.sysjobservers  AS sjs
        ON sjs.job_id    = sj.job_id
       AND sjs.server_id = sj.originating_server_id
      LEFT OUTER JOIN msdb.dbo.systargetservers AS sts
        ON sts.server_id = sjs.server_id
     INNER JOIN msdb.dbo.sysjobhistory AS sjh_outcome
        ON sjh_outcome.instance_id = sja.job_history_id
       AND sjh_outcome.run_status  = 0
     WHERE CASE WHEN COALESCE(sts.time_zone_adjustment, 0) = 0
           THEN DATEADD(HOUR, DATEDIFF(HOUR, GETDATE(), GETUTCDATE()), sja.stop_execution_date)
           ELSE DATEADD(HOUR, -COALESCE(sts.time_zone_adjustment, 0), sja.stop_execution_date)
           END >= DATEADD(MINUTE, -5, GETUTCDATE())
)
SELECT TOP (100) …lots of columns from recent_failures…
                 last_step.message       AS last_message,
                 last_step.sql_severity  AS sql_severity,
                 last_step.step_name     AS step_name,
                 DATEDIFF(SECOND, c.start_execution_date, c.stop_execution_date) AS duration,
                 'Failed' AS job_status
  FROM recent_failures AS c
 OUTER APPLY
 (
   SELECT TOP (1) sjhl.step_name,
                  sjhl.message,
                  sjhl.sql_severity
             FROM msdb.dbo.sysjobhistory AS sjhl
            WHERE sjhl.job_id  = c.job_id
              AND sjhl.step_id > 0
         ORDER BY sjhl.run_date DESC, sjhl.run_time DESC
 ) AS last_step
 CROSS APPLY (SELECT CHARINDEX('\', c.outcome_server)) AS shp(server_sep_idx)
 INNER JOIN msdb.dbo.syscategories AS sc
    ON sc.category_id = c.category_id
 ORDER BY c.stop_execution_date DESC;
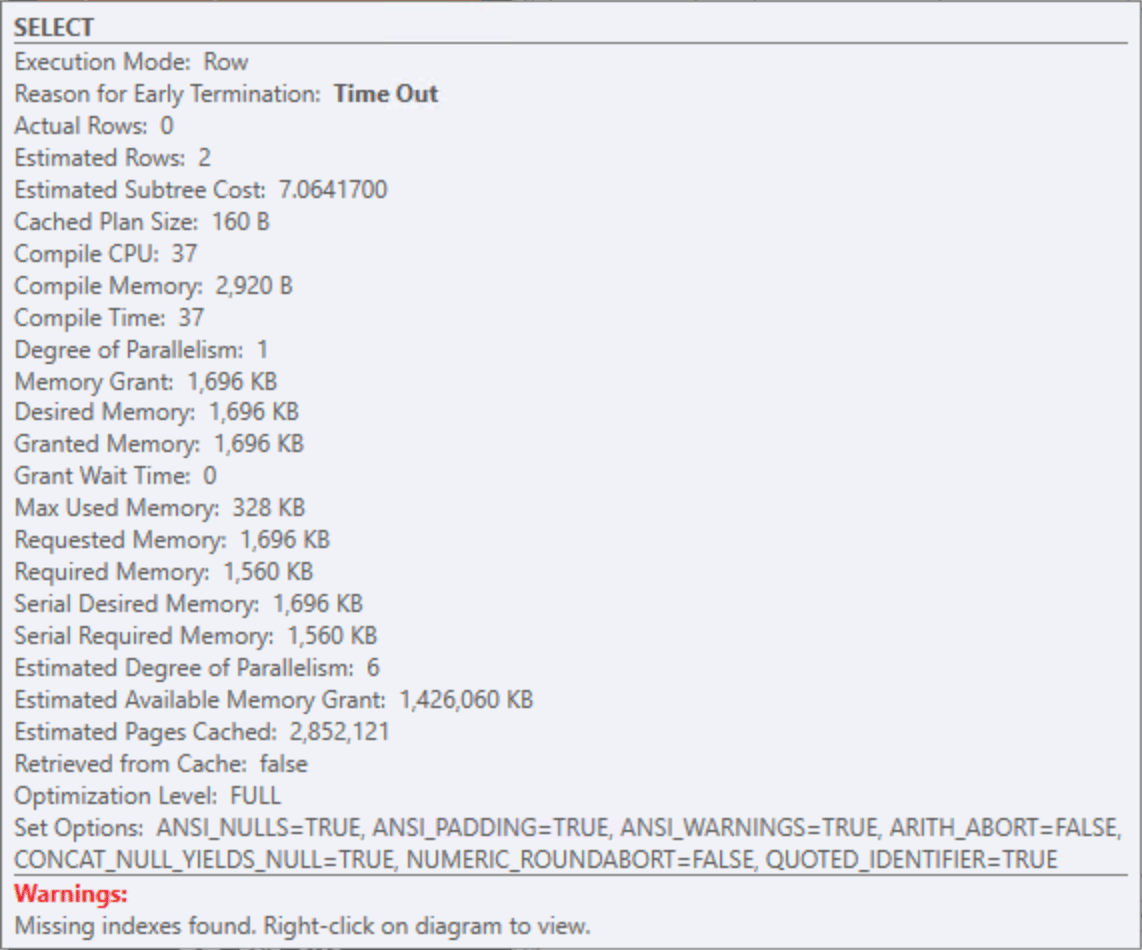
As mentioned, the plan for this version of the query is a lot more memory-friendly:
And comparing actual runtime and reads against the vendor query:

But since this is a vendor query embedded in their software, we couldn’t just change it – in order to get a fix, it would have to go through their change controls, assuming we could even convince them that they should. With the above we were able to demonstrate this pretty quickly, and cautioned that other customers might be sitting on the same ticking time bomb, and they have been very open to the improvements. But it is not a snap-your-fingers change, and…
We needed relief sooner
We had several imperfect options to move forward in the meantime:
- We could truncate sysjobhistory. This can provide immediate relief, since the memory grants will be a lot smaller when the table is empty. The downside here is we’d lose all of our history.
- We could reduce retention, say, from 30 days to 10 days, and have cleanup jobs run daily instead of weekly. We did this for this specific customer but, for some, it’s possible this still isn’t going to clean things up fast enough. It also makes it really hard to look at historical runtimes and outcomes unless we also archive job results somewhere else.
- We could create a better index to satisfy the query. Because of the filter in the query, I thought the best would be a filtered index:
CREATE INDEX do_not_do_this!!!
    ON dbo.sysjobhistory (job_id, step_id, run_status)
INCLUDE (step_name, sql_severity, message, run_date, run_time)
WHERE run_status = 0 AND step_id > 0;
Filtered index to the rescue? Not so fast!
In most cases, this would be a fairly efficient way to satisfy the original query; however, the problem is that you can’t reliably add a filtered index to sysjobhistory. You can create the index, but then inserts from SQL Server Agent, and possibly other places, will fail relatively silently.
The reason is that the filtered index has to be created with QUOTED_IDENTIFIER = ON (among others), but SQL Server Agent runs with QUOTED_IDENTIFIER = OFF. Which means SQL Server will happily let you create the index, but then all inserts into sysjobhistory will fail with Msg 1934:
Verify that SET options are correct for use with indexed views and/or indexes on computed columns and/or filtered indexes and/or query notifications and/or XML data type methods and/or spatial index operations.
These failures aren’t visible in SQL Server’s errorlog or in the job’s history, only in SQL Server Agent’s independent log.
There are hacks to might make it work in some scenarios, but that would be brittle, and I won’t get into them here.
So, a non-filtered index, then
The next alternative is a non-filtered index:
CREATE INDEX ix_sysjobhistory_vendor_query
    ON dbo.sysjobhistory (job_id, step_id, run_status)
INCLUDE (step_name, sql_severity, message, run_date, run_time);
With that index in place, the vendor query had this plan, still with a nearly 800MB memory grant (and this is on the system after retention controls were tightened):
Those memory grants from the original query were slightly smaller than before, but still potentially problematic whenever a customer has any combination of a lot of jobs, jobs with many steps, and jobs that run frequently – whether they fail or not.
My rewrite produced this plan, with tiny memory grants like before:
The new index helped the performance of both queries:

If we were analyzing just based on improvements to the query plan shape, duration, or number of reads, the index would have seemed to be the ticket. But the goal here wasn’t to improve the measurable performance of the vendor query – we don’t really care if their query takes milliseconds or seconds, especially since they're usually empty – the goal was to reduce the memory grants because of their impact on the rest of the users of the system.
The query rewrite was the key
The major lesson here was that, sometimes, an index may seem to help, but it really hasn’t resolved the most important symptom. Sometimes the best option is to buckle up and improve the query. And the vendor, to their credit, is committed to doing that.
I wasn’t able to reproduce this scenario on SQL Server 2025. They’ve made some quiet improvements to memory clerk management over the last few releases, which is the good news. The bad news: if you are experiencing an issue like this on, say, SQL Server 2019, you’re unlikely to get relief without some effort. Hopefully what I’ve shown here will give you some ideas.
