Updated August 15th, 2019 for 0.9.6.
Last year, I got together with one of my dev teams here – they call themselves the SQL Injectors – to talk about the possibility of replicating SentryOne Plan Explorer functionality inside of Azure Data Studio. After some discussion, we brought the concept to the leadership team, and set a plan in motion.
There were some complications, as you can imagine; Plan Explorer is written using desktop technologies, and ADS is a whole new world. We had to convert all our .NET Framework code to .NET Core, change our UI code to Node and React, and re-work the entire plan diagram implementation. I'll save all the backstory for another post, because many fun things happened along the way, and we got a lot of help from some great folks at Microsoft – Karl Burtram, Alan Yu, Alan Ren, Charles Gagnon, and Vicky Harp, to name a few. For now, I want to focus on how you get your hands on the preview, what's in it so far (including a few screenshots), and known issues.
How You Get It
In order to access the Plan Explorer extension, you need to create a free SentryOne Cloud account and agree to our EULA. The account gives you access to our support forum, and we can keep you up to date on upcoming releases and new features. Once you have created your account, go to extensions.sentryone.com, where you should see the following link to download the extension:
This will give you a VSIX file that you'll need to "side-load" into Azure Data Studio (Microsoft does not support full hosting for third party extensions in the ADS Marketplace, like they do with VS Code).
First, ensure you meet our requirements:
- Azure Data Studio 1.9.0 or newer (July announcement post)
- .NET Core Runtime 2.1 or newer (Windows | macOS | Linux)
- Connecting to SQL Server 2012 or better, or Azure SQL Database
And recommended system configuration:
- Two or more cores
- 8GB or more of memory
- Operating Systems:
- Windows (8.1 / Server 2012 R2 or better)
- macOS (10.13 or better)
- RedHat (7.6 or better)
- SuSE (12.0 or better)
- Ubuntu (18.04 or better)
Then, to install the extension:
- Open Azure Data Studio.
- Select File > Install Extension from VSIX Package. You can't double-click the VSIX file.
- Locate the SentryOne Plan Explorer VSIX file you downloaded and click Install.
- Unless you've dismissed it before, you will have to say yes to a prompt about trusting third party extensions:
If you don't have a new enough version of Azure Data Studio (or you're using an Insiders' build with changes we haven't tested yet), some functionality may not work as expected.
If you don't have a new enough version of the .NET Core Runtime (or it isn't running), you will get this error message after install succeeds:
What's In It
Like the desktop application, the Plan Explorer extension is designed to provide you with richer graphical execution plans for your real-time queries against SQL Server. It is based on a modest subset of functionality; we've started with just the plan diagram, a basic statements grid, tooltips, and access to the XML (so you can open the plan in other tools). We will add more features to the extension over time to try to get you as close to full parity with the desktop client as possible.
To enable or disable the extension
- Click the SentryOne Plan Explorer element in the status bar:
- Or press Shift+Ctrl/⌘+P and find Toggle SentryOne Plan Explorer:
- Or press Shift+Ctrl/⌘+F5.
To collect an execution plan
- Make sure the extension is enabled.
- In a new query window, establish a connection to a server, and write or paste a query.
- For an Estimated plan, use the Explain button on the toolbar.
- For an Actual plan, use Ctrl/⌘+M.
- A new top-level document will open (titled Plan Explorer) including a grid of statements, one row for each plan-generating statement:
- To view the underlying plan XML, click View XML.
- To view the plan diagram for any statement, click View Plan.
- To see the condensed tooltip for an operator, hover over the operator. For the expanded version, which includes more information and "sticks" to the right side of the panel, click on the operator:
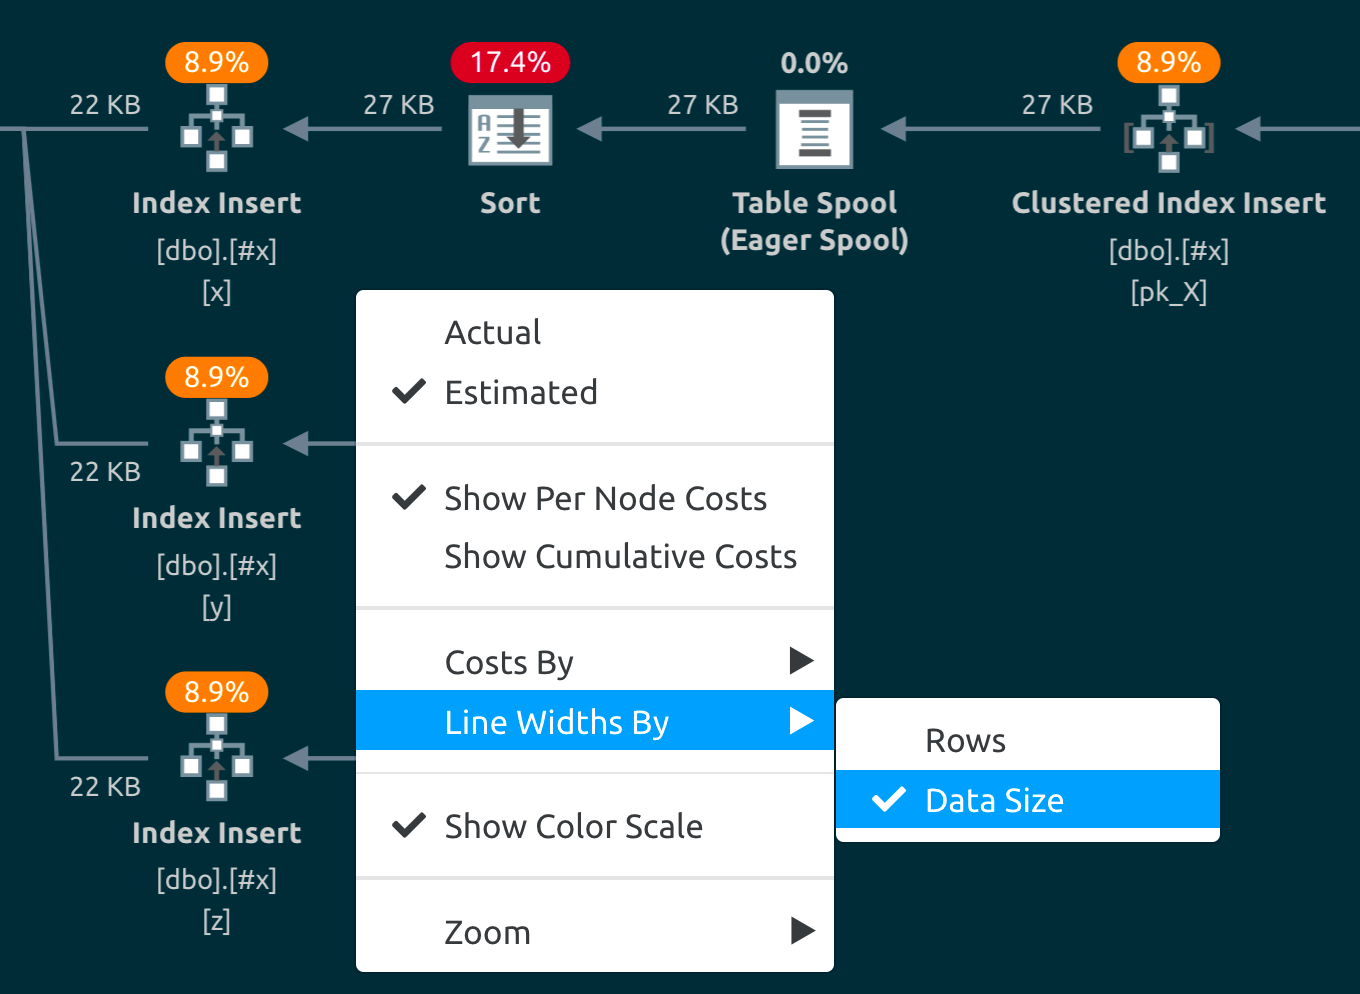
- To change any of the diagram properties, such as zoom level, switching between actual and estimated plans, showing costs by I/O or CPU only, or changing line widths to be rendered by number of rows or data size, right-click anywhere on the diagram:
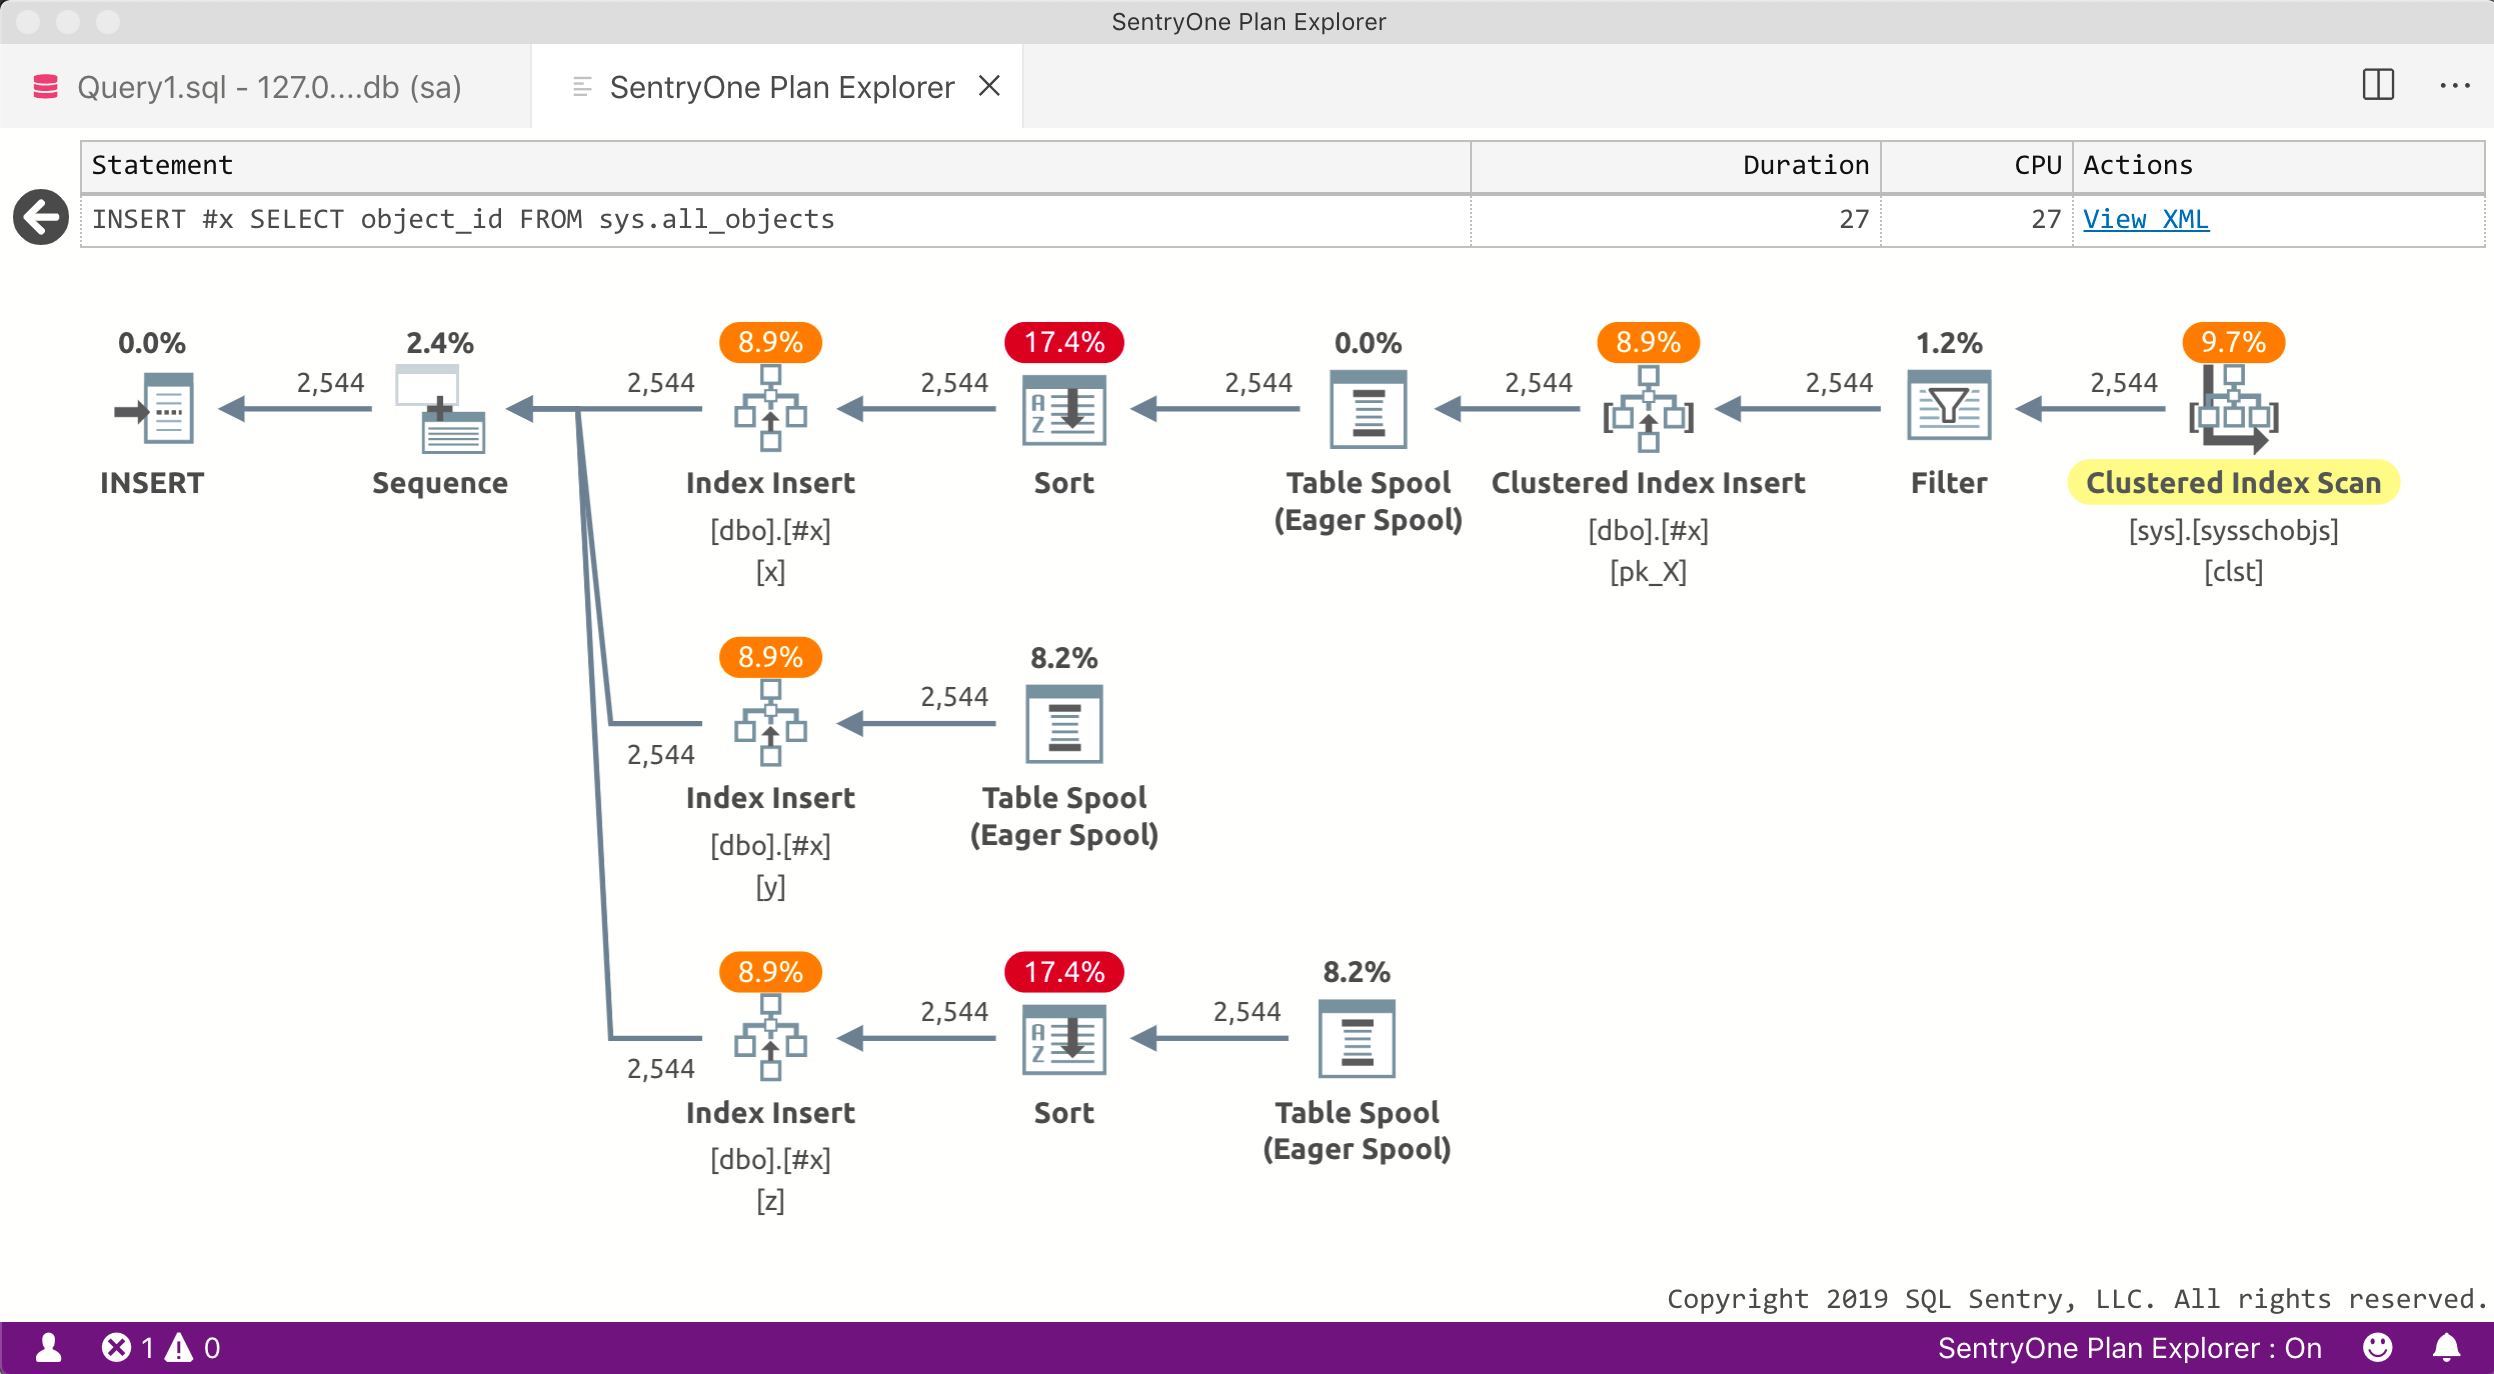 Plan diagram with default light theme
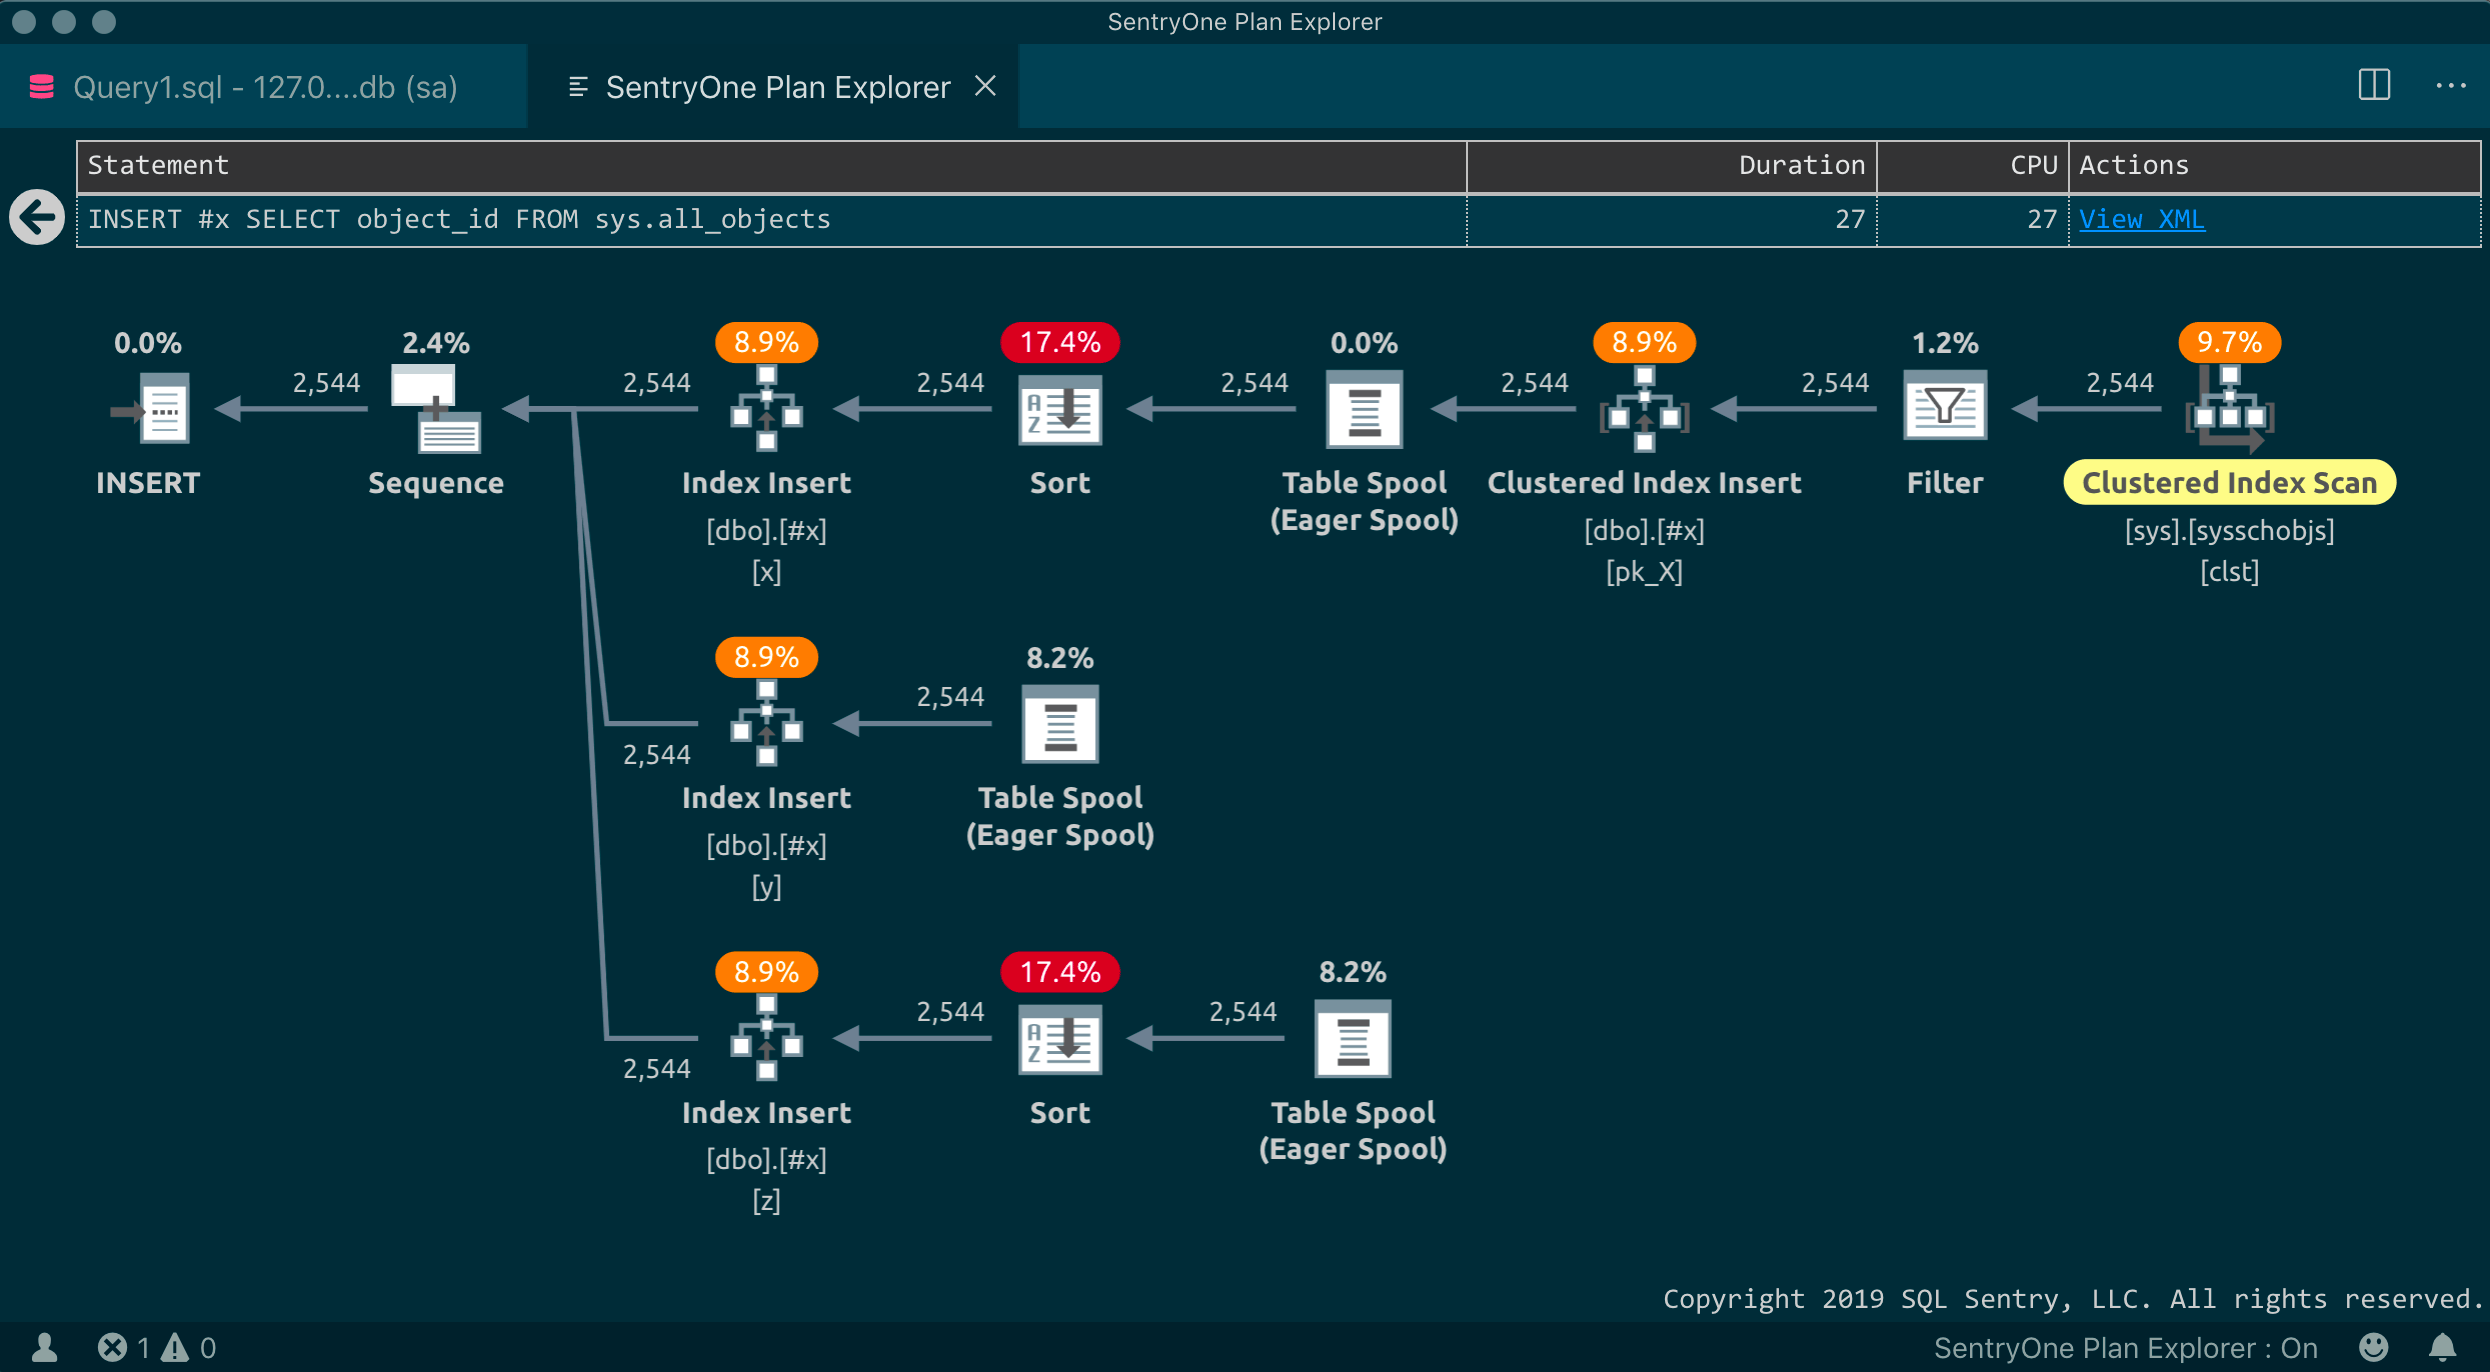 Plan diagram with Solarized Dark theme
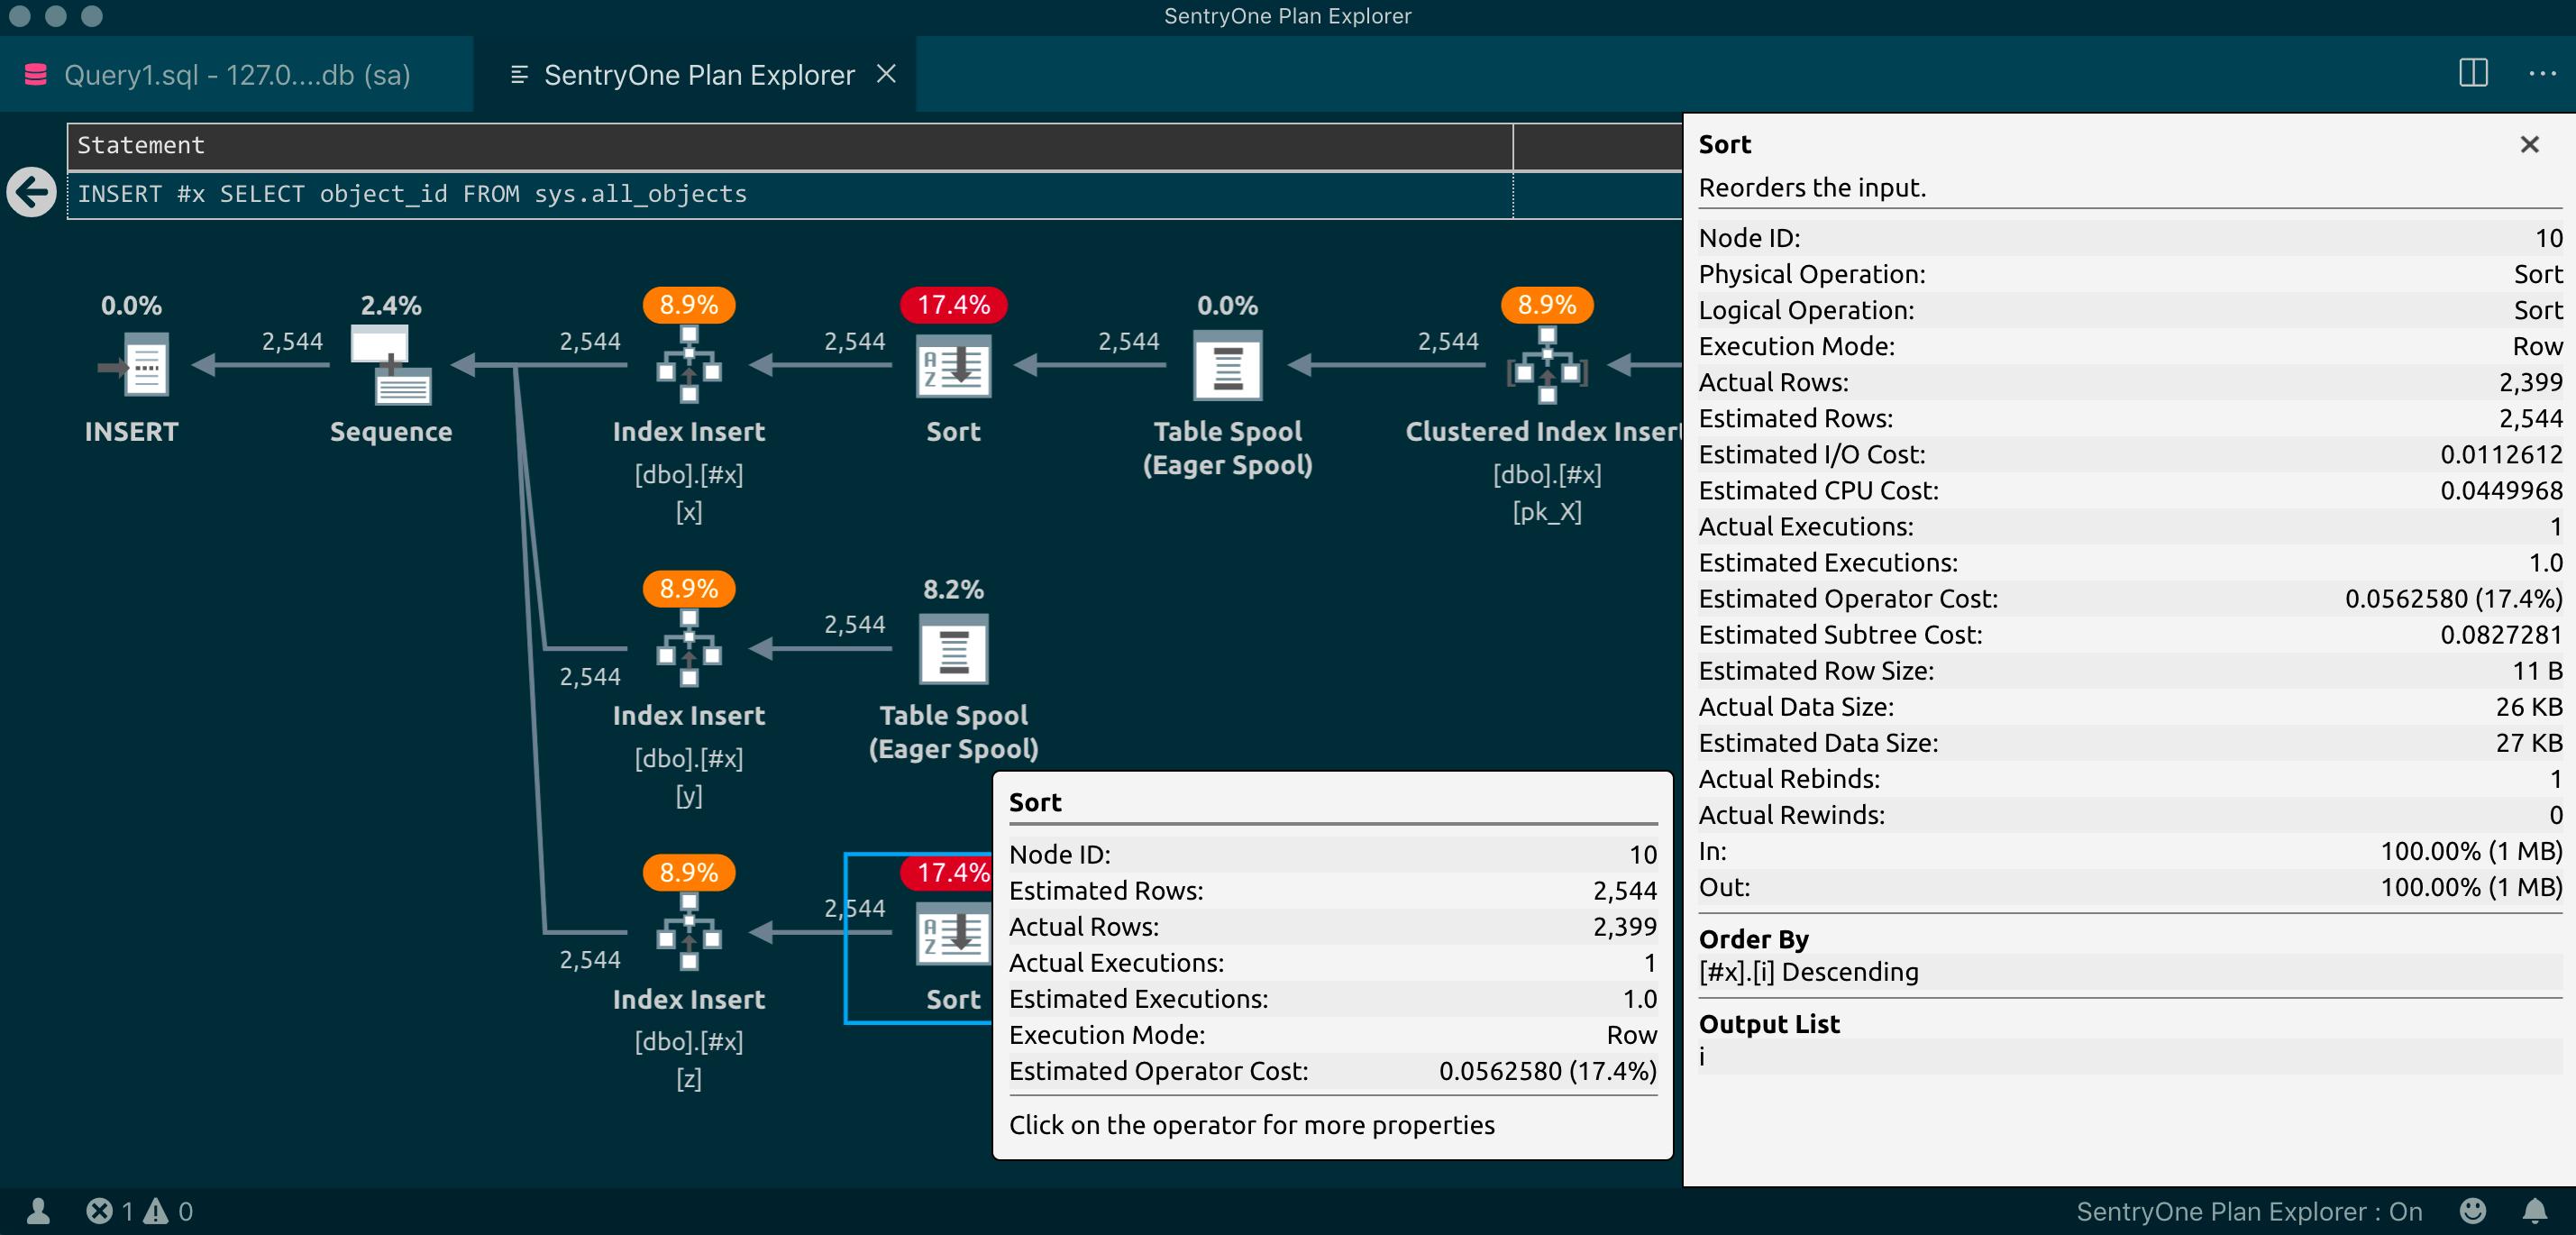 Condensed and expanded tooltips
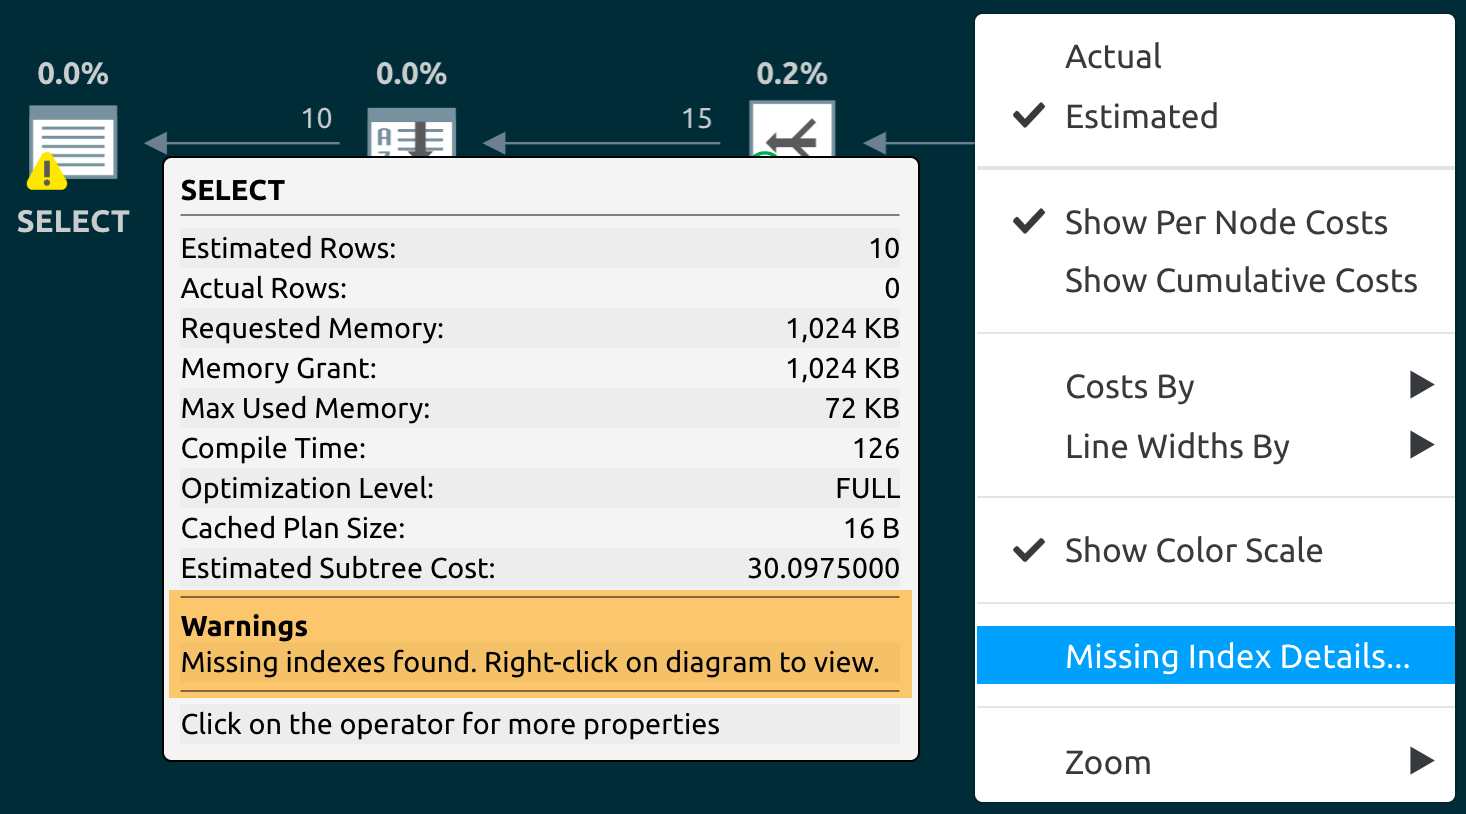
 - When a missing index recommendation is present, a warning will appear on the tooltip for the root node operator, and a right-click context menu option will be available anywhere on the diagram (which will open the missing index(es) script in a new, disconnected, top-level query window):
New in 0.9.6 – August 15th, 2019
- Added context menu option to switch line widths between number of rows and data size
- Added context menu option to show missing index recommendations in a new query window
- Shifted default API port from 5000 to 5042 to reduce chance of conflict
- Added a setting to customize the local port number in case of conflict:
- Moved extension on/off toggle to status bar (thanks for the suggestion, Drew Skwiers-Koballa!)
- Additional diagnostics in the Output panel to aid troubleshooting:
- Updated several operator icons (old on left, new on right):
Note that the Key and RID Lookup icon changes already happened in Plan Explorer 19.0.1 (explanation here); the rest of these changes will appear in Plan Explorer soon.
Known issues
- When the Plan Explorer extension is enabled, you will also experience the native
Explainfunctionality provided by Azure Data Studio (Dave Bland explains that functionality here). - For actual plans, the only runtime metrics available in grids are Duration and CPU (given a modern enough version of SQL Server). Other data will appear in future releases, starting with Reads and Cost %.
- Azure Data Studio currently truncates plan XML output at 2MB (see Issue #6299). So for larger plans and/or larger batches, we might not be able to show all plans. This is more likely to happen when using Explain to generate estimated plans (so just say no to estimated plans <G>).
- We don't have access to the File menu, so we can't open or save plans, and we can only open a single document window named Plan Explorer – which means that, at least for now, you can only show one plan diagram at a time.
Missing indexes,line width options, and subtree collapse functionality are unavailable in the preview. There are also no layout options, but you can zoom with your mouse wheel or trackpad pinch, and you can pan with two-finger trackpad swipe.- When Azure Data Studio opens with documents recovered from a previous session, enabling the Plan Explorer extension may not apply to those windows, due to an issue enumerating documents in that state. Until Microsoft releases a fix, toggling Plan Explorer off and then on again should do the trick.
- Theme support is experimental at this point:
- Not all background colors will render beautifully, and all links are blue no matter what.
- Alternate icons designed for dark themes are in the works.
- If you change color theme after rendering a plan, we currently can't capture the event. Interact with the diagram (e.g. right-click) to force it to "catch up."
Get more info; provide feedback
- Product page
- Official product documentation
- SentryOne Plan Explorer / Query Tuning forum
- July release announcement from the Azure Data Studio team
- I am always happy to answer questions or take feedback at abertrand@sentryone.com










When do you anticipate that you will have a release version available?
We don't have a target date in mind or what even "release version" means. This is the first round and we will add functionality over time. We are hoping lots of users will use the extension and tell us how far away we are from a "release version." :-)
Sounds good, I just started getting into ADS, trying to compare it to SSMS
I find it faster for querying but none of the tools that I have in SSMS are available just like you say they are all built for desktop
I hope others follow through, I will check it out
Thanks,
I am having trouble logging into https://extensions.sentryone.com/ Is there an authentication issue? I even created a new account and still couldn't log in. Thanks
The extensions site should redirect you to account.sentryone.com for authentication. What happens when you go directly to account.sentryone.com?
Hi, I finally got in, thanks. Got this error at first, but then worked in different browser session.
Error.
An error occurred while processing your request.
Development Mode
Swapping to Development environment will display more detailed information about the error that occurred.
Development environment should not be enabled in deployed applications, as it can result in sensitive information from exceptions being displayed to end users. For local debugging, development environment can be enabled by setting the ASPNETCORE_ENVIRONMENT environment variable to Development, and restarting the application.
Love the add-in. Will there be a "view with SentryOne Plan Explorer" option anytime soon?
Thanks!
While that sounds like a simple thing to add, there are a couple of complications. This isn't a traditional application, we're just an extension inside an application, so we're kind of sand-boxed with what we can do in terms of reaching out to the OS or other applications (even to know if other applications are installed). We also don't currently (by design!) have any logic whatsoever to determine the operating system, never mind behave differently. Plan Explorer is only available on Windows.
Thanks Aaron. I think I can live with saving the plan as xml and than opening it in PE. For now. ;-)
Hi,
I have a fresh version of ADS, .net core 2.1 and SQL 2016.
I can see extension is enabled.
But no any top level windows is appeared for neither actual nor estimate plan.
Can you try toggling the extension off and on again, and completely quitting Azure Data Studio and restarting?
I've tried but result is the same sadly.
What operating system? Is your firewall running? Is it possible you have a conflict on port 5000? Any errors in
Toggle Developer Tools > Console? At a command prompt, what doesdotnet --infosay? In a browser window, what happens when you try to hithttp://localhost:5000/swaggerorhttp://127.0.0.1:5000/swagger?Thx for response.
It was issue related to proxy.
you need to enable preview features in Azure Data Studio
ctrl+,
"enable preview features"
close and relaunch
command 'planViewerAds.showInPlanViewer' not found error. Preview featured enabled, reloaded. NoGo.
What version of Azure Data Studio are you using? What does the output panel show?