

There is so much you can say about history and importance. History of a country, of civilization, of each of us. I love quotes and like this one from Teddy Roosevelt (cool guy):
Why am I waxing poetic (or trying to) about history in a blog about SQL Server? Because history in SQL Server is important, too. When a performance issue exists in SQL Server, it’s ideal to troubleshoot the issue live, but in some cases, historical information can provide a smoking gun, or at least a starting point. A great source of historical information in SQL Server is the ERRORLOG. I mentioned in my original post, Performance Issues: The First Encounter, that the ERRORLOG used to be an afterthought for me. No more. During client audits we always capture the ERRORLOGs, and while we are notified for any high-severity alerts (which are written to the log), it’s not unheard of to find other interesting information in the log. We prepare for the future by using the historical info in the logs; the information can help us fix a problem, or potential problem, before it becomes catastrophic.
Viewing the ERRORLOG
First off, we’ll review some options for viewing the ERROLOG. If I’m connected to an instance, I’ll usually navigate to it through SSMS (Management | SQL Server Logs, right-click on a log, and select View SQL Server Log). From this window I can just scroll through the log, or use the Filter or Search options to narrow down the result set. I can also view multiple files by selecting them in the left-hand pane.
If I’m looking at data captured in one of our health audits, I’ll just open the log files in a text editor and review them (I do have the option of going into the viewer and loading them are as well). The log files exist in the log folder (default location: C:\Program Files\Microsoft SQL Server\MSSQL12.SQL2014\MSSQL\Log) if I ever wanted to look at them on the server. Many of you might prefer to view and/or search the log using the undocumented procedure sp_readerrorlog or extended stored procedure xp_readerrorlog.
And finally, if you’re all into PowerShell, that’s an also an option for reading the log that way (see this post: Use PowerShell to Parse SQL Server 2012 Error Logs). The method is up to you – use what you know and what works for you – it’s the content that really matters. And remember that there are times where you will need to simply read through the log to understand the order of events, and there are other times where you might search to find a specific error or piece of information.
What’s in the ERRORLOG?
So what information can we find in the ERRORLOG, besides errors? I’ve listed many of the items I’ve found most useful below. Note that this isn’t an exhaustive list (and I’m sure many of you will have suggestions of what could be added – feel free to post a comment and I can update this!), but again, this is what I’m looking for first when I’m proactively looking at an instance.
- Whether the server is physical or virtual (look for the System Manufacturer entry)
- Trace flags enabled at startup
- Within the entry for the Registry startup parameters, if you scroll all the way to the right, you’ll see if any trace flags are enabled:
 Trace Flags enabled at startup
- Within the entry for the Registry startup parameters, if you scroll all the way to the right, you’ll see if any trace flags are enabled:
- Trace flags enabled or disabled after the instance has started
- If users (or an application) enable or disable a trace flag using DBCC TRACEON or DBCC TRACEOFF, an entry appears in the log
- Number of cores and sockets detected by SQL Server
- I always like to verify that SQL Server sees all the hardware available – and if not, that’s a red flag to investigate further. For a good example, see Jonathan’s post, Performance Problems with SQL Server 0212 Enterprise Edition Under CAL Licensing, and Glenn’s post, Balancing Your Available SQL Server Core Licenses Evenly Across NUMA Nodes, which also includes some handy TSQL to query the log.
- Note that the text for this entry varies between SQL Server versions.
- Amount of memory detected by SQL Server
- Again, I want to verify that SQL Server sees all the memory that’s available to it.
- Confirmation that Locked Pages in Memory (LPIM) is enabled
- While this option is enabled via the Windows Security Policy, you can confirm that it’s enabled by looking for "Using locked pages in the memory manager" message in the log.
- Note that if you have Trace Flag 834 in use, then the message won’t say locked pages, it will say that large pages are being used for the buffer pool.
- Version of CLR in use
- Success or failure of Service Principal Name (SPN) registration
- How long it takes for a database to come online
- The log records when the database starts up, and when it’s online – I check to see if any database takes an excessive amount of time to come up.
- Status of Service Broker and Database Mirroring endpoints – important if you’re using either feature
- Confirmation that Instant File Initialization (IFI) is enabled*
- By default this information is not logged, but if you enable Trace Flag 3004 (and 3605 to force the output to the log), when you create or grow a data file, you will see messages in the log to indicate whether IFI is in use or not.
- Status of SQL Traces
- When you start or stop a SQL Trace, it gets logged, and I look to see if any traces beyond the default trace exist (either temporarily or long term). If you’re running a third-party monitoring tool, such as SQL Sentry’s Performance Advisor, you might see an active trace that’s always running, but only capturing specific events, or you might see a trace start, run for a short duration, then stop. I’m not concerned about one or two extra traces, unless they’re capturing a lot of events, but I definitely pay attention when multiple traces are running.
- The last time CHECKDB was completed
- This message is often misunderstood by people – when the instance starts up, it reads the boot page for each database and notes when CHECKDB last ran successfully. Most people don’t read the entire message:
 Date that DBCC CHECKDB last completed successfully
The date for CHECKDB completion is November 11, 2012, but the ERRORLOG date is July 7, 2015. It’s important to understand that SQL Server does not run CHECKDB against databases at startup, it checks the dbcclastknowngood value on the boot page (to see when that gets updated, check out my post, What Checks Update dbcclastknowngood. Also, if DBCC CHECKDB has never been run against a database, then no entry will show up for the database here.
- This message is often misunderstood by people – when the instance starts up, it reads the boot page for each database and notes when CHECKDB last ran successfully. Most people don’t read the entire message:
- CHECKDB completion
- When CHECKDB is run against a database, the output is recorded in the log.
- Changes to instance settings
- If you change an instance-level settings (e.g. max server memory, cost threshold for parallelism) using sp_configure or through the UI (note that it doesn’t log who changed it).
- Changes to database settings
- Did someone enable AUTO_SHRINK? Change the RECOVERY option to SIMPLE and then back to FULL? You’ll find it here.
- Changes to database status
- If someone takes a database OFFLINE (or brings it ONLINE), this gets logged.
- Deadlock information*
- If you need to capture deadlock information, don’t want to run a trace, and you’re running SQL Server 2005 through 2008R2, use trace flag 1222 to write deadlock information to the log in XML format. For those of you using SQL Server 2000 and below, you can trace flag 1204 (this trace flag is also available in SQL Server 2005+, but it outputs minimal information). If you’re running SQL Server 2012 or higher, this is not needed, as the system_health event session captures this information (and it’s there in 2008 and 20082 too, but you have to pull it from the ring_buffer versus the event_file target).
- FlushCache Messages
- If the cache is being flushed by SQL Server because the checkpoint process exceeds the recovery interval for the database, you’ll see a set of FlushCache messages in the log (see this post by Bob Dorr for more information). Don’t confuse these messages with the ones that show up when you run DBCC FREEPROCCACHE or DBCC FREESYSTEMCACHE:
 Message after running DBCC FREEPROCCACHE or DBCC FREESYSTEMCACHE
- If the cache is being flushed by SQL Server because the checkpoint process exceeds the recovery interval for the database, you’ll see a set of FlushCache messages in the log (see this post by Bob Dorr for more information). Don’t confuse these messages with the ones that show up when you run DBCC FREEPROCCACHE or DBCC FREESYSTEMCACHE:
- AppDomain unload messages
- The log also notes when AppDomains are created, and you’ll only see either if you’re using CLR. If I see AppDomain unload messages because of memory pressure, it’s something to investigate further.
There is other information in the log that’s useful, such as authentication mode in use, whether or not the Dedicated Admin Connection (DAC) is enabled, etc. but I can also get that from sys.configurations and I check those with the instance baselines I discussed earlier (Proactive SQL Server Health Checks, Part 3: Instance and Database Settings).
What’s not in the ERROLOG, that you might expect?
This is a short list, for now, as I’m guessing some of you might have found other things you thought would be in the log but were not…
- Adding or removing database files or filegroups
- Starting or stopping of Extended Events Sessions
- However, if you deploy a server level DDL Trigger or Event Notification, you can log this information. See Jonathan’s post, Logging Extended Events changes to the ERRORLOG, for more detail.
- Running DBCC DROPCLEANBUFFERS does show up in the ERRORLOG
Managing the Log
Remember that by default, SQL Server only keeps the most recent six (6) log files (in addition to the current file), and the log file rolls over every time the SQL Server restarts. As a result, you can sometimes have extremely large log files which take a while to open and are a pain to dig through. On the flip side, if you run into a case where the instance gets restarted a couple times, you might lose important information. It’s recommended to increase the number of retained files to a higher value (e.g. 30), and create an Agent job to roll over the file once a week using sp_cycle_errorlog.
In addition to managing the files, you can affect what information is written to the log. One of the most common entries that creates clutter in the ERRORLOG is the successful backup entry:
 Backup completed successfully
If you have an instance with numerous databases and transaction log backups are taken with any regularity (e.g. every 15 minutes), you’ll see the log quickly fill up with messages, which makes finding a true problem harder. Luckily, you can use trace flag 3226 to disable successful backup messages (errors will still show up in the log, and all entries will still exist in msdb).
Another set of messages that clutter the log are successful login messages. This is an option you configure for the instance on the Security tab:
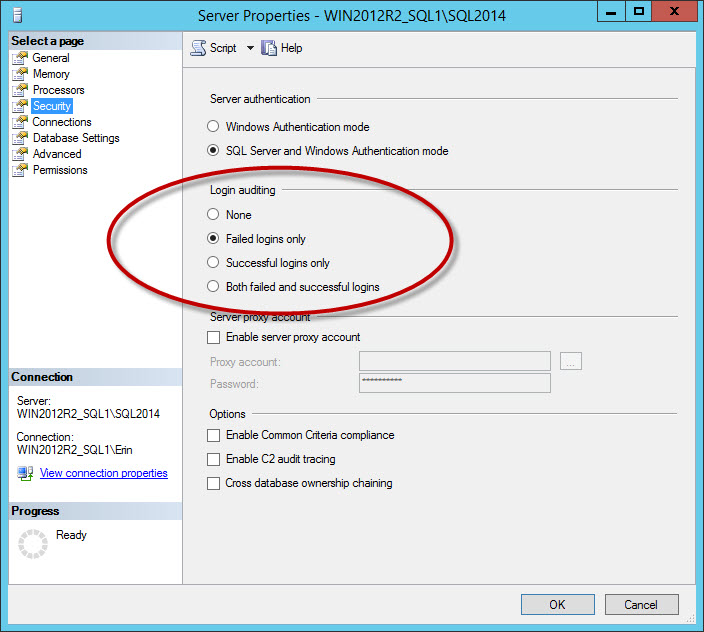 Security option to log successful and/or failed logins
If you log successful logins, or failed and successful logins, you can have very large log files, even if you rollover the files daily (it will depend on how many users connect). I recommend capturing failed logins only. For businesses that have a requirement to log successful logins, consider using the Audit feature, added in SQL Server 2008. Side note: If you change the Login auditing setting, it will not take effect until you restart the instance.
Don't underestimate the ERRORLOG
As you can see, there is some great information in the ERRORLOG for you to use not just when you're troubleshooting performance or investigating errors, but also when you're proactively monitoring an instance. You can find information in the log that's not found anywhere else; make sure you're checking it on regular basis and not leaving it as an afterthought.
See the other parts in this series:


Nice. Erin is one of my favorite posters. Not a novel, not a short story… just a nice balance of the two.
Aw, thanks Mike, I appreciate the feedback!
Are there any good publicly available queries that help parse out the information that you review in this article?
Robert-
Do you mean parse it using xp_readerrorlog? If so, I'm sure there – just a quick search of xp_readerrorlog and examples would probably generate some posts or articles. But as a basic example, you can do:
EXEC master.sys.xp_readerrorlog 6, 1, "Failed"
To look for any entries with the text "failed".
Hope that helps!
Erin
AppDomain messages are fun and (can be) important to catch.
One important one is the "failed to load" message that happens when there's been a .NET framework patch and a reboot pending; before which no further CLR will work. Either the message should be caught or you should include a little CLR in your daily checks to make sure CLR is still working properly.