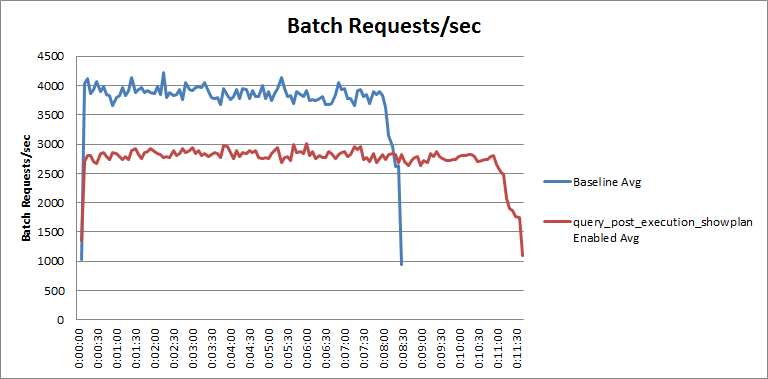
query_post_execution_showplan Overhead Graph Published March 19, 2013 at 768 × 379 in Impact of the query_post_execution_showplan Extended Event in SQL Server 2012 ← Previous Next → Chart 2 – query_post_execution event overhead