Earlier in this series (Part 1 | Part 2) we talked about generating a series of numbers using various techniques. While interesting, and useful in some scenarios, a more practical application is to generate a series of contiguous dates; for example, a report that requires showing all the days of a month, even if some days had no transactions.
In a previous post I mentioned that it is easy to derive a series of days from a series of numbers. Since we've already established multiple ways to derive a series of numbers, let's look at how the next step looks. Let's start very simple, and pretend we want to run a report for three days, from January 1st through January 3rd, and include a row for every day. The old-fashioned way would be to create a #temp table, create a loop, have a variable that holds the current day, within the loop insert a row into the #temp table until the end of the range, and then use the #temp table to outer join to our source data. That's more code than I even want to present here, never mind put in production, maintain, and have colleagues learn from.
Starting simple
With an established sequence of numbers (regardless of the method you choose), this task becomes much easier. For this example I can replace complex sequence generators with a very simple union, since I only need three days. I'm going to make this set contain four rows, so that it is also easy to demonstrate how to cut off to exactly the series you need.
First, we have a couple of variables to hold the start and end of the range we're interested in:
DECLARE @s DATE = '2012-01-01', @e DATE = '2012-01-03';
Now, if we start with just the simple series generator, it may look like this. I'm going to add an ORDER BY here as well, just to be safe, since we can never rely on assumptions we make about order.
;WITH n(n) AS (SELECT 1 UNION ALL SELECT 2 UNION ALL SELECT 3 UNION ALL SELECT 4)
SELECT n FROM n ORDER BY n;

-- result:

n
----
1
2
3
4
To convert that into a series of dates, we can simply apply DATEADD() from the start date:
;WITH n(n) AS (SELECT 1 UNION ALL SELECT 2 UNION ALL SELECT 3 UNION ALL SELECT 4)
SELECT DATEADD(DAY, n, @s) FROM n ORDER BY n;

-- result:

----
2012-01-02
2012-01-03
2012-01-04
2012-01-05
This still isn't quite right, since our range starts on the 2nd instead of the 1st. So in order to use our start date as the base, we need to convert our set from 1-based to 0-based. We can do that by subtracting 1:
;WITH n(n) AS (SELECT 1 UNION ALL SELECT 2 UNION ALL SELECT 3 UNION ALL SELECT 4)
SELECT DATEADD(DAY, n-1, @s) FROM n ORDER BY n;

-- result:

----
2012-01-01
2012-01-02
2012-01-03
2012-01-04
Almost there! We just need to limit the result from our larger series source, which we can do by feeding the DATEDIFF, in days, between the start and end of the range, to a TOP operator – and then adding 1 (since DATEDIFF essentially reports an open-ended range).
;WITH n(n) AS (SELECT 1 UNION ALL SELECT 2 UNION ALL SELECT 3 UNION ALL SELECT 4)
SELECT TOP (DATEDIFF(DAY, @s, @e) + 1) DATEADD(DAY, n-1, @s) FROM n ORDER BY n;

-- result:

----
2012-01-01
2012-01-02
2012-01-03
Adding real data
Now to see how we would join against another table to derive a report, we can just use that our new query and outer join against the source data.
;WITH n(n) AS
(
  SELECT 1 UNION ALL SELECT 2 UNION ALL
  SELECT 3 UNION ALL SELECT 4
),
d(OrderDate) AS
(
  SELECT TOP (DATEDIFF(DAY, @s, @e) + 1) DATEADD(DAY, n-1, @s)
  FROM n ORDER BY n
)
SELECT
  d.OrderDate,
  OrderCount = COUNT(o.SalesOrderID)
FROM d
LEFT OUTER JOIN Sales.SalesOrderHeader AS o
ON o.OrderDate >= d.OrderDate
AND o.OrderDate < DATEADD(DAY, 1, d.OrderDate)
GROUP BY d.OrderDate
ORDER BY d.OrderDate;
(Note that we can no longer say COUNT(*), since this will count the left side, which will always be 1.)
Another way to write this would be:
;WITH d(OrderDate) AS
(
  SELECT TOP (DATEDIFF(DAY, @s, @e) + 1) DATEADD(DAY, n-1, @s)
  FROM
  (
    SELECT 1 UNION ALL SELECT 2 UNION ALL
    SELECT 3 UNION ALL SELECT 4
  ) AS n(n) ORDER BY n
)
SELECT
  d.OrderDate,
  OrderCount = COUNT(o.SalesOrderID)
FROM d
LEFT OUTER JOIN Sales.SalesOrderHeader AS o
ON o.OrderDate >= d.OrderDate
AND o.OrderDate < DATEADD(DAY, 1, d.OrderDate)
GROUP BY d.OrderDate
ORDER BY d.OrderDate;
This should make it easier to envision how you would replace the leading CTE with the generation of a date sequence from any source you choose. We'll go through those (with the exception of the recursive CTE approach, which only served to skew graphs), using AdventureWorks2012, but we'll use the SalesOrderHeaderEnlarged table I created from this script by Jonathan Kehayias. I added an index to help with this specific query:
CREATE INDEX d_so ON Sales.SalesOrderHeaderEnlarged(OrderDate);
Also note that I'm choosing an arbitrary date range that I know exists in the table.
Numbers table
;WITH d(OrderDate) AS
(
  SELECT TOP (DATEDIFF(DAY, @s, @e) + 1) DATEADD(DAY, n-1, @s)
  FROM dbo.Numbers ORDER BY n
)
SELECT
  d.OrderDate,
  OrderCount = COUNT(s.SalesOrderID)
FROM d
LEFT OUTER JOIN Sales.SalesOrderHeaderEnlarged AS s
ON s.OrderDate >= @s AND s.OrderDate <= @e
AND CONVERT(DATE, s.OrderDate) = d.OrderDate
WHERE d.OrderDate >= @s AND d.OrderDate <= @e
GROUP BY d.OrderDate
ORDER BY d.OrderDate;
Plan (click to enlarge):
spt_values
DECLARE @s DATE = '2006-10-23', @e DATE = '2006-10-29';

;WITH d(OrderDate) AS
(
  SELECT DATEADD(DAY, n-1, @s)
  FROM (SELECT TOP (DATEDIFF(DAY, @s, @e) + 1)
   ROW_NUMBER() OVER (ORDER BY Number) FROM master..spt_values) AS x(n)
)
SELECT
  d.OrderDate,
  OrderCount = COUNT(s.SalesOrderID)
FROM d
LEFT OUTER JOIN Sales.SalesOrderHeaderEnlarged AS s
ON s.OrderDate >= @s AND s.OrderDate <= @e
AND CONVERT(DATE, s.OrderDate) = d.OrderDate
WHERE d.OrderDate >= @s AND d.OrderDate <= @e
GROUP BY d.OrderDate
ORDER BY d.OrderDate;
Plan (click to enlarge):
sys.all_objects
DECLARE @s DATE = '2006-10-23', @e DATE = '2006-10-29';

;WITH d(OrderDate) AS
(
  SELECT DATEADD(DAY, n-1, @s)
  FROM (SELECT TOP (DATEDIFF(DAY, @s, @e) + 1)
   ROW_NUMBER() OVER (ORDER BY [object_id]) FROM sys.all_objects) AS x(n)
)
SELECT
  d.OrderDate,
  OrderCount = COUNT(s.SalesOrderID)
FROM d
LEFT OUTER JOIN Sales.SalesOrderHeaderEnlarged AS s
ON s.OrderDate >= @s AND s.OrderDate <= @e
AND CONVERT(DATE, s.OrderDate) = d.OrderDate
WHERE d.OrderDate >= @s AND d.OrderDate <= @e
GROUP BY d.OrderDate
ORDER BY d.OrderDate;
Plan (click to enlarge):
Stacked CTEs
DECLARE @s DATE = '2006-10-23', @e DATE = '2006-10-29';

;WITH e1(n) AS
(
    SELECT 1 UNION ALL SELECT 1 UNION ALL SELECT 1 UNION ALL
    SELECT 1 UNION ALL SELECT 1 UNION ALL SELECT 1 UNION ALL
    SELECT 1 UNION ALL SELECT 1 UNION ALL SELECT 1 UNION ALL SELECT 1
),
e2(n) AS (SELECT 1 FROM e1 CROSS JOIN e1 AS b),
d(OrderDate) AS
(
  SELECT TOP (DATEDIFF(DAY, @s, @e) + 1)
    d = DATEADD(DAY, ROW_NUMBER() OVER (ORDER BY n)-1, @s)
  FROM e2
)
SELECT
  d.OrderDate,
  OrderCount = COUNT(s.SalesOrderID)
FROM d LEFT OUTER JOIN Sales.SalesOrderHeaderEnlarged AS s
ON s.OrderDate >= @s AND s.OrderDate <= @e
AND d.OrderDate = CONVERT(DATE, s.OrderDate)
WHERE d.OrderDate >= @s AND d.OrderDate <= @e
GROUP BY d.OrderDate
ORDER BY d.OrderDate;
Plan (click to enlarge):
Now, for a year long range, this won't cut it, since it only produces 100 rows. For a year we'd need to cover 366 rows (to account for potential leap years), so it would look like this:
DECLARE @s DATE = '2006-10-23', @e DATE = '2007-10-22';

;WITH e1(n) AS
(
    SELECT 1 UNION ALL SELECT 1 UNION ALL SELECT 1 UNION ALL
    SELECT 1 UNION ALL SELECT 1 UNION ALL SELECT 1 UNION ALL
    SELECT 1 UNION ALL SELECT 1 UNION ALL SELECT 1 UNION ALL SELECT 1
),
e2(n) AS (SELECT 1 FROM e1 CROSS JOIN e1 AS b),
e3(n) AS (SELECT 1 FROM e2 CROSS JOIN (SELECT TOP (37) n FROM e2) AS b),
d(OrderDate) AS
(
  SELECT TOP (DATEDIFF(DAY, @s, @e) + 1)
    d = DATEADD(DAY, ROW_NUMBER() OVER (ORDER BY N)-1, @s)
  FROM e3
)
SELECT
  d.OrderDate,
  OrderCount = COUNT(s.SalesOrderID)
FROM d LEFT OUTER JOIN Sales.SalesOrderHeaderEnlarged AS s
ON s.OrderDate >= @s AND s.OrderDate <= @e
AND d.OrderDate = CONVERT(DATE, s.OrderDate)
WHERE d.OrderDate >= @s AND d.OrderDate <= @e
GROUP BY d.OrderDate
ORDER BY d.OrderDate;
Plan (click to enlarge):
Calendar table
This is a new one that we didn't talk much about in the previous two posts. If you are using date series for a lot of queries then you should consider having both a Numbers table and a Calendar table. The same argument holds about how much space is really required and how fast access will be when the table is queried frequently. For example, to store 30 years of dates, it requires less than 11,000 rows (exact number depends on how many leap years you span), and takes up a mere 200 KB. Yes, you read that right: 200 kilobytes. (And compressed, it's only 136 KB.)
To generate a Calendar table with 30 years of data, assuming you've already been convinced that having a Numbers table is a good thing, we can do this:
DECLARE @s DATE = '2005-07-01'; -- earliest year in SalesOrderHeader
DECLARE @e DATE = DATEADD(DAY, -1, DATEADD(YEAR, 30, @s));

SELECT TOP (DATEDIFF(DAY, @s, @e) + 1)
 d = CONVERT(DATE, DATEADD(DAY, n-1, @s))
 INTO dbo.Calendar
 FROM dbo.Numbers ORDER BY n;

CREATE UNIQUE CLUSTERED INDEX d ON dbo.Calendar(d);
Now to use that Calendar table in our sales report query, we can write a much simpler query:
DECLARE @s DATE = '2006-10-23', @e DATE = '2006-10-29';

SELECT
  OrderDate = c.d,
  OrderCount = COUNT(s.SalesOrderID)
FROM dbo.Calendar AS c
LEFT OUTER JOIN Sales.SalesOrderHeaderEnlarged AS s
ON s.OrderDate >= @s AND s.OrderDate <= @e
AND c.d = CONVERT(DATE, s.OrderDate)
WHERE c.d >= @s AND c.d <= @e
GROUP BY c.d
ORDER BY c.d;
Plan (click to enlarge):
Performance
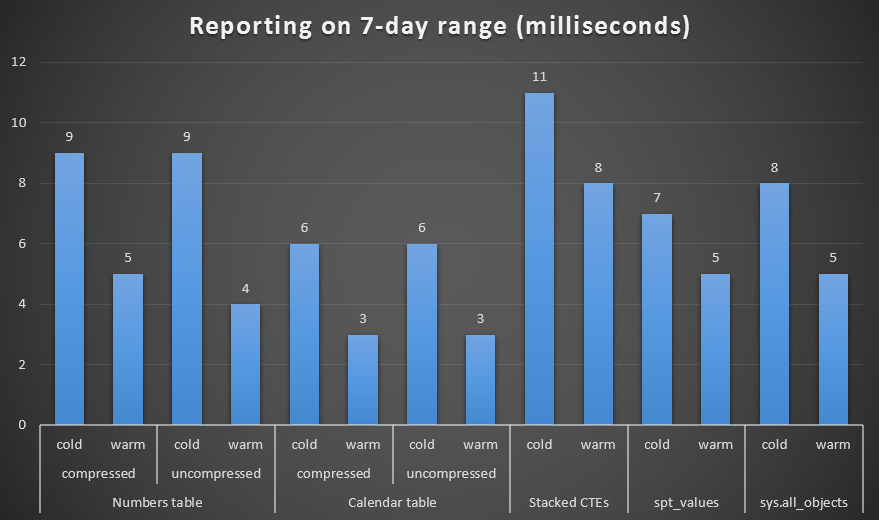
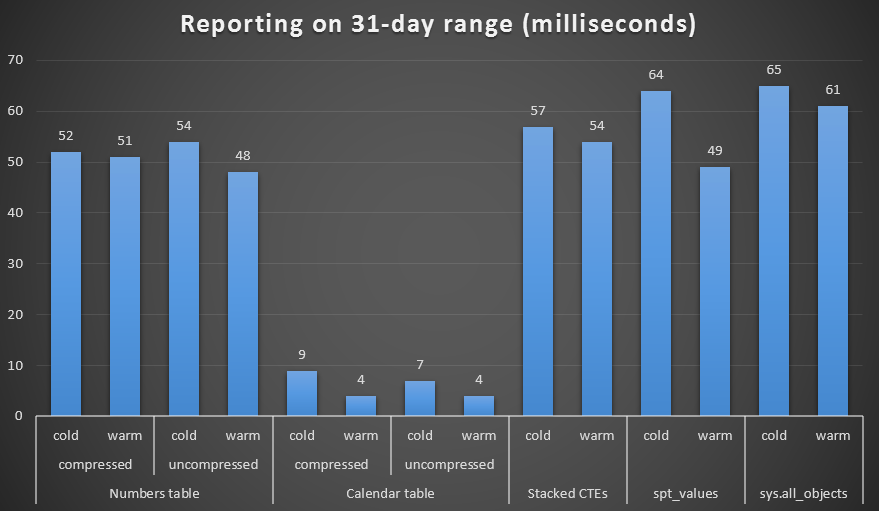
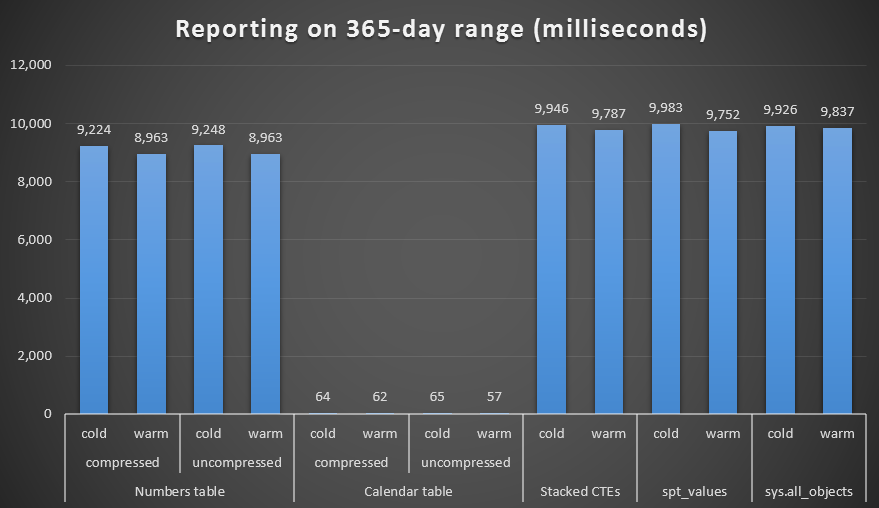
I created both compressed and uncompressed copies of the Numbers and Calendar tables, and tested a one week range, a one month range, and a one year range. I also ran queries with cold cache and warm cache, but that turned out to be largely inconsequential.

Duration, in milliseconds, to generate a week-long range

Duration, in milliseconds, to generate a month-long range

Duration, in milliseconds, to generate a year-long range
Addendum
Paul White (blog | @SQL_Kiwi) pointed out that you can coerce the Numbers table to produce a much more efficient plan using the following query:
SELECT
  OrderDate = DATEADD(DAY, n, 0),
  OrderCount = COUNT(s.SalesOrderID)
FROM dbo.Numbers AS n
LEFT OUTER JOIN Sales.SalesOrderHeader AS s
ON s.OrderDate >= CONVERT(DATETIME, @s)
  AND s.OrderDate < DATEADD(DAY, 1, CONVERT(DATETIME, @e))
  AND DATEDIFF(DAY, 0, OrderDate) = n
WHERE
  n.n >= DATEDIFF(DAY, 0, @s)
  AND n.n <= DATEDIFF(DAY, 0, @e)
GROUP BY n
ORDER BY n;
At this point I'm not going to re-run all of the performance tests (exercise for the reader!), but I will assume that it will generate better or similar timings. Still, I think a Calendar table is a useful thing to have even if it isn't strictly necessary.
Conclusion
The results speak for themselves. For generating a series of numbers, the Numbers table approach wins out, but only marginally - even at 1,000,000 rows. And for a series of dates, at the lower end, you will not see much difference between the various techniques. However, it is quite clear that as your date range gets larger, particularly when you're dealing with a large source table, the Calendar table really demonstrates its worth - especially given its low memory footprint. Even with Canada's wacky metric system, 60 milliseconds is way better than about 10 *seconds* when it only incurred 200 KB on disk.
I hope you've enjoyed this little series; it's a topic I've been meaning to revisit for ages.


I don't understand how this works with the d = aliasing seemingly in the middle of the line. Can you help?
Jason, can you elaborate? Do you mean this:
?
Think of it as:
Where
xrepresents the expressionDATEDIFF(DAY, @s, @e) + 1. That just resolves to a number, like any variable or constant you would put insideTOP(). In this case we only want the calendar table to include the number of days between the start and end date (DATEDIFF(DAY, @s, @e)), but we need to add 1 becauseDATEDIFFdoes not include the day at either the beginning or end of the range, depending on how you look at it.Then we just assign a column name to the next expression,
d = CONVERT.... I could have also said:But, my (admittedly quite subjective) preference is
alias = expression, as I explain here.Have you tried this same thing using the numbers table as the source for the date simply using CONVERT to convert the values stored in the numbers table to datetime values?
e.g. SELECT CONVERT(datetime, n) FROM dbo.Numbers
It should generate dates starting from 1900-01-02 00:00:00.000 (where n=1). This is based on the fact that dates are actually stored as numbers with the whole number representing the number of days past 1900-01-01 00:00:00.000.
Aaron,
Thank you for these beautifully documented and written blog posts. I learned a lot more than just how to generate numbers.
In the example, is the use of a Calendar Table (or other date source) of benefit only so days without orders can be captured? Or is there a performance advantage over just using @s and @e like so?
SELECT
OrderDate = DATEADD(DAY, s, 0),
OrderCount = COUNT(s.SalesOrderID)
FROM Sales.SalesOrderHeader AS s
WHERE s.OrderDate >= CONVERT(DATETIME, @s)
AND s.OrderDate < DATEADD(DAY, 1, CONVERT(DATETIME, @e))
Yes, it's so that the report includes rows even for days without sales. It isn't about performance (and I would like to repeat that joining to a calendar table isn't typically going to have any impact on performance at all anyway, unless you do really silly things with it).