

Note: This post was originally published only in our eBook, High Performance Techniques for SQL Server, Volume 4. You can find out about our eBooks here.
I regularly get asked the question, "Where do I start when it comes to trying to tune a SQL Server instance?" My first response is to ask them about the configuration of their instance. If certain things are not configured properly then starting to look at long-running or high-cost queries right away could be wasted effort.
I have blogged about common things administrators miss where I share many of the settings that administrators should change from a default installation of SQL Server. For performance-related items, I tell them they should check the following:
- Memory settings
- Updating statistics
- Index maintenance
- MAXDOP and cost threshold for parallelism
- tempdb best practices
- Optimize for ad hoc workloads
Once I get past the configuration items, I ask if they have looked at file and wait statistics as well as high-cost queries. Most of the time the response is "no" – with an explanation that they aren't sure how find that information.
Typically the common compliant when someone's stating they need to tune a SQL Server is that it's running slow. What does slow mean? Is it a certain report, a specific application, or everything? Did it just start happening, or has it been getting worse over time? I start by asking the usual triage questions of what the memory, CPU, and disk utilization is compared to when things are normal, did the problem just start happening, and what recently changed. Unless the client is capturing a baseline, they don't have metrics to compare against to know if current stats are abnormal.
Nearly every SQL Server that I work on hosts more than one user database. When a client reports that the SQL Server is running slow, most of the time they are concerned about a specific application that is causing issues for their customers. A knee-jerk reaction is to immediately focus on that particular database, however often times another process could be consuming valuable resources and the application's database is being impacted. For example, if you have a large reporting database and someone kicked off a massive report that saturates the disk, spikes CPU, and flushes the plan cache, you can bet that the other user databases would slow down while that report is being generated.
I always like to start by looking at the file stats. For SQL Server 2005 and up, you can query the sys.dm_io_virtual_file_stats DMV to get I/O statistics for each data and log file. This DMV replaced the fn_virtualfilestats function. To capture the file stats, I like to use a script that Paul Randal put together: capturing IO latencies for a period of time. This script will capture a baseline and, 30 minutes later (unless you change the duration in the WAITFOR DELAY section), capture the stats and calculate the deltas between them. Paul's script also does a bit of math to determine the read and write latencies, which makes it much easier for us to read and understand.
On my laptop I restored a copy of the AdventureWorks2014 database onto a USB drive so that I would have slower disk speeds; I then kicked off a process to generate a load against it. You can see the results below where my write latency for my data file is 240ms and write latency for my log file is 46ms. Latencies this high are troublesome.
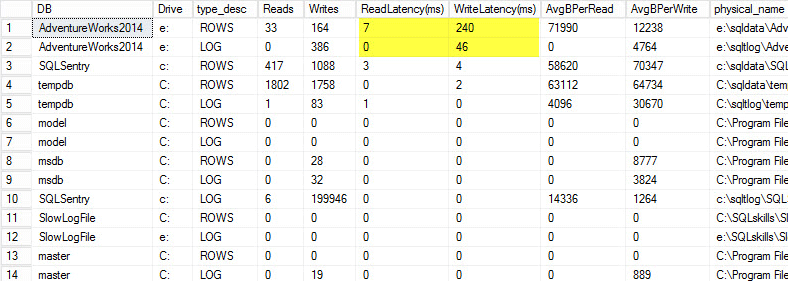
Anything over 20ms should be considered bad, as I shared in a previous post: monitoring read/write latency. My read latency is decent, but the AdventureWorks2014 database is suffering from slow writes. In this case I would investigate what is generating the writes as well as investigating my I/O subsystem performance. If this had been excessively high read latencies I would start investigating query performance (why is it doing so many reads, for instance from missing indexes), as well as overall I/O subsystem performance.
It is important to know the overall performance of your I/O subsystem, and the best way to know what it's capable of is by benchmarking it. Glenn Berry talks about this in his article analyzing I/O performance for SQL Server. Glenn explains latency, IOPS, and throughput and shows off CrystalDiskMark which is a free tool that you can use to baseline your storage.
After finding out how the file stats are performing, I like to look at wait stats by using the DMV sys.dm_os_wait_stats, which returns information about all the waits that occurred. For this I turn to another script that Paul Randal provides in his capturing wait statistics for a period of time blog post. Paul's script does a little math for us again but, more importantly, it excludes a lot of the benign waits that we typically don't care about. This script also has a WAITFOR DELAY and is set to 30 minutes. Reading wait stats can be a bit more tricky: You can have waits that appear to be high based on percentage, but the average wait is so low that it isn't anything to worry about.
I kicked off the same load process and captured my wait stats, which I have shown below. For explanations for many of these wait types you can read another one of Paul's blog posts, wait statistics, or please tell me where it hurts, plus some of his posts on this blog.
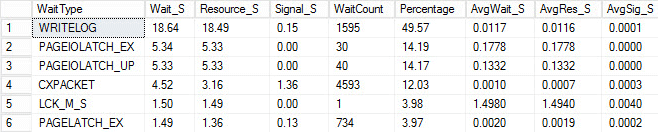
In this contrived output, the PAGEIOLATCH waits could be indicating a bottleneck with my I/O subsystem, but could also be a memory issue, table scans instead seeks, or a host of other issues. In my case, we know it is a disk issue, since I am storing the database on a USB stick. The LCK_M_S wait time is very high, however there is only one instance of the wait. My WRITELOG is also higher than I would like to see, but is understandable knowing the latency issues with the USB stick. This also shows CXPACKET waits, and it would be easy to have a knee-jerk reaction and think you have a parallelism/MAXDOP issue, however the AvgWait_S counter very low. Be careful when using waits for troubleshooting. Let it be a guide to tell you things that aren't the problem as well as giving you a direction of where to go look for issues. Proper troubleshooting is correlating behaviors from multiple areas to narrow down the problem.
After looking at the file and wait statistics I then start digging into the high cost queries based on the issues I found. For this I turn to Glenn Berry's Diagnostic Information Queries. These sets of queries are the go-to scripts that many consultants use. Glenn and the community are constantly providing updates to make them as informational and robust as possible. One of my favorite queries is the top cached queries by execution count. I love finding queries or stored procedures that have high execution_count coupled with high total_logical_reads. If those queries have tuning opportunities then you can quickly make a big difference to the server. Also included in the scripts are top cached SPs by total logical reads and top cached SPs by total physical reads. Both of these are good for looking for high reads with high execution counts so you can reduce the number of I/Os.
In addition to Glenn's scripts, I like to use Adam Machanic's sp_whoisactive to see what is currently running.
There is a lot more to performance tuning than just looking at file and wait stats and high-cost queries, however that's where I like to start. It is a way to quickly triage an environment to start determining what's causing the issue. There is no completely fool proof way to tune: what every production DBA needs is a checklist of things to run through to eliminate and a really good collection of scripts to run through to analyze the health of the system. Having a baseline is key to quickly ruling out normal vs. abnormal behavior. My good friend Erin Stellato has an entire course on Pluralsight called SQL Server: Benchmarking and Baselining if you need help with setting up and capturing your baseline.
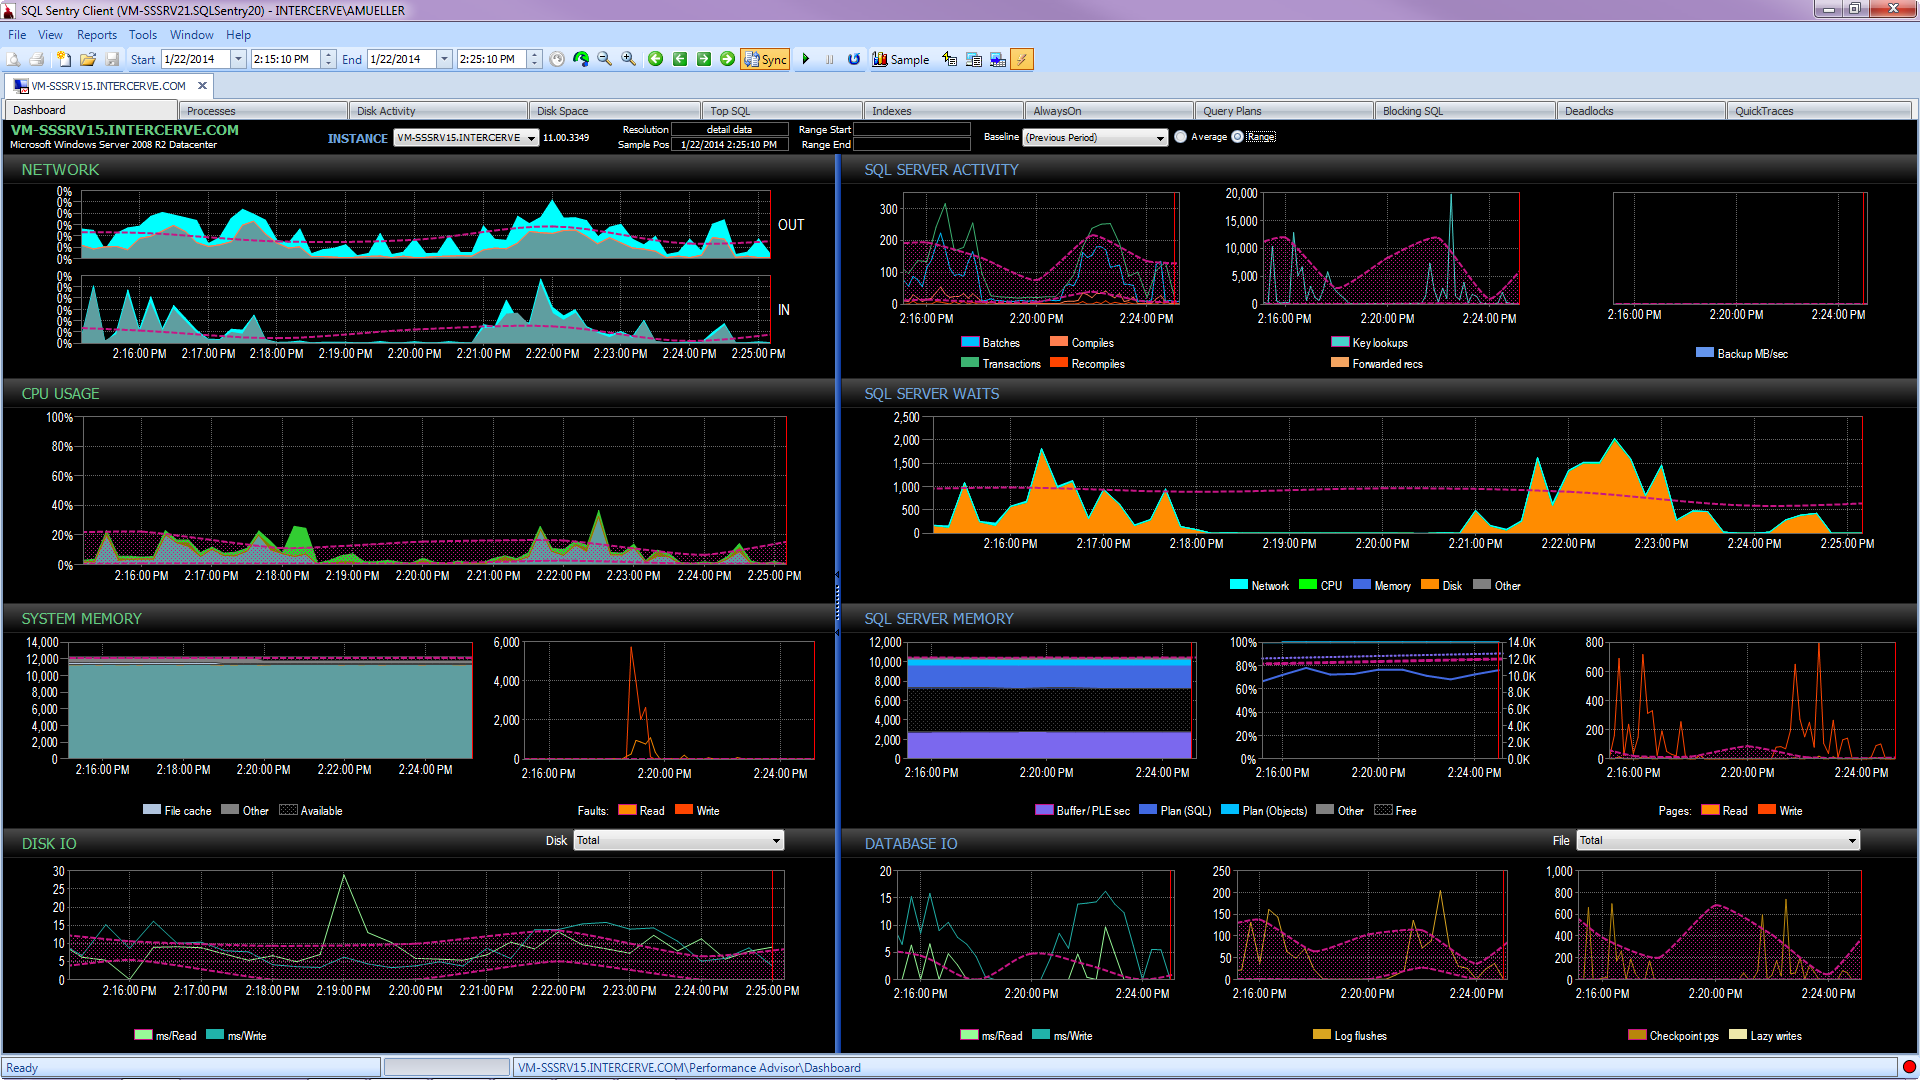
Better yet, get a state-of-the-art tool like SQL Sentry Performance Advisor that will not only collect and store historical information for profiling and trending, and give easy access to all of the details mentioned above and more, but it also gives the ability to compare activity to built-in or user-defined baselines, efficiently maintain indexes without lifting a finger, and alert or automate responses based on a very robust custom conditions architecture. The following screen shot depicts the historical view of the Performance Advisor dashboard, with disk waits in orange, database I/O at the bottom right, and baselines comparing the current and previous period on every graph (click to enlarge):
Quality monitoring tools are not free, but they provide a ton of functionality and support that allow you to focus on the performance issues on your servers, instead of focusing on queries, jobs, and alerts that may allow you to focus on your performance issues – but only once you get them right. There is often great value in not re-inventing the wheel.