


Being responsible for the performance of SQL Server can be a daunting task. There are many areas that we to have to monitor and understand. We are also expected to be able to stay on top of all those metrics and know what is happening on our servers at all times. I like to ask DBAs what the first thing that they think about when they hear the phrase “tuning SQL Server;” the overwhelming response I get is “query tuning.” I agree that tuning queries is very important and is a never-ending task that we face because workloads are continuously changing.
However there are many other aspects to consider when thinking about SQL Server performance. There are a lot of instance-, OS- and database-level settings that need to be tweaked from the defaults. Being a consultant allows me to work in many different lines of business and get exposure to all sorts of performance issues. When working with a new client I try to always perform a health audit of the server to know what I am dealing with. While performing these audits, one of the things that I’ve found repeatedly has been excessive read and write latencies on the disks where SQL Server data and log files reside.
Read/Write Latency
To view your disk latencies in SQL Server you can quickly and easily query the DMV sys.dm_io_virtual_file_stats. This DMV accepts two parameters: database_id and file_id. What is awesome is that you can pass NULL as both values and return the latencies for all files for all databases. The output columns include:
- database_id
- file_id
- sample_ms
- num_of_reads
- num_of_bytes_read
- io_stall_read_ms
- num_of_writes
- num_of_bytes_written
- io_stall_write_ms
- io_stall
- size_on_disk_bytes
- file_handle
As you can see from the column list, there is really useful information that this DMV retrieves, however just running SELECT * FROM sys.dm_io_virtual_file_stats(NULL, NULL); doesn’t help much unless you have memorized your database_ids and can do some math in your head.
When I query the file stats, I use a query from Paul Randal’s blog post, “How to examine IO subsystem latencies from within SQL Server.” This script makes the column names easier to read, includes the drive the file is on, the database name, and the path to the file.
By querying this DMV you can easily tell where the I/O hot spots are for your files. You can see where the highest write and read latencies are and which databases are the culprits. Knowing this will allow you to start looking at the tuning opportunities for those specific databases. This could include index tuning, checking to see if the buffer pool is under memory pressure, possibly moving the database to a faster portion of the I/O subsystem, or possibly partitioning the database and spreading the filegroups across other LUNs.
So you run the query and it returns lots of values in ms for latency – which values are okay, and which are bad?
What values are good or bad?
If you ask SQLskills, we will tell you something along the lines of:
- Excellent: < 1ms
- Very good: < 5ms
- Good: 5 – 10ms
- Poor: 10 – 20ms
- Bad: 20 – 100ms
- Really bad: 100 – 500ms
- OMG!: > 500ms
If you do a Bing search, you will find articles from Microsoft making the recommendations similar to:
- Good: < 10ms
- Okay: 10 – 20ms
- Bad: 20 – 50ms
- Seriously bad: > 50ms
As you can see, there are some slight variations in the numbers, but the consensus is that anything over 20ms can be considered troublesome. With that being said, your average write latency may be 20ms and that is 100% acceptable for your organization and that is okay. You need to know general I/O latencies for your system so that, when things do get bad, you know what normal is.
My Read/Write Latencies Are Bad, What Do I Do?
If you are finding that read and write latencies are bad on your server, there are several places you can start looking for issues. This is not a comprehensive list but some guidance of where to start.
- Analyze your workload. Is your indexing strategy correct? Not having the proper indexes will lead to much more data being read from disk. Scans instead of seeks.
- Are your statistics up to date? Bad statistics can make for poor choices for execution plans.
- Do you have parameter sniffing issues that are causing poor execution plans?
- Is the buffer pool under memory pressure, for instance from a bloated plan cache?
- Any network issues? Is your SAN fabric performing correctly? Have your storage engineer validate pathing and network.
- Move the hot spots to different storage arrays. In some cases it may be a single database or just a few databases that are causing all the problems. Isolating them to a different set of disk, or faster high end disk such as SSD’s may be the best logical solution.
- Can you partition the database to move troublesome tables to different disk to spread the load?
Wait Statistics
Just like monitoring your file stats, monitoring your wait stats can tell you a great deal about bottlenecks in your environment. We are lucky to have another awesome DMV (sys.dm_os_wait_stats) that we can query that will pull all available wait information collected since the last restart or since the last time the waits were reset; there are waits related to disk performance too. This DMV will return important information including:
- wait_type
- waiting_task_count
- wait_time_ms
- max_wait_time_ms
- signal_wait_time_ms
Querying this DMV on my SQL Server 2014 machine returned 771 wait types. SQL Server is always waiting on something, but there are a lot of waits that we shouldn’t worry ourselves with. For this reason, I utilize another query from Paul Randal; his blog post, “Wait Statistics, or please tell me where it hurts,” has an excellent script that excludes a bunch of the waits we don’t really care about. Paul also lists out many of the common problematic waits as well as offering guidance for the common waits.
Why are wait stats important?
Monitoring for high wait times for certain events will tell you when there are issues going on. You need a baseline to know what is normal and when things exceed a threshold or pain level. If you have really high PAGEIOLATCH_XX then you know SQL Server is having to wait for a data page to be read from disk. This could be disk, memory, workload change or a number of other issues.
A recent client I was working with was seeing some very unusual behavior. When I connected to the database server and was able to observe the server under a work load, I immediately started checking file stats, wait stats, memory utilization, tempdb usage, etc. One thing that immediately stood out was WRITELOG being the most prevalent wait. I know this wait has to do with a log flush to disk and reminded me of Paul’s series on Trimming the Transaction Log Fat. High WRITELOG waits can usually be identified by high-write latencies for the transaction log file. So I then used my file stats script to review the read and write latencies on the disk. I was then able to see high write latency on the data file but not my log file. In looking at the WRITELOG it was a high wait but the time waiting in ms was extremely low. However something in the second post of Paul’s series was still in my head. I should look at the auto growth settings for the database just to rule out “Death by a thousand cuts”. In looking at the database properties of the database I saw that the data file was set to auto grow by 1MB and the transaction log set to auto grow by 10%. Both files had nearly 0 unused space. I shared with the client what I found and how this was killing their performance. We quickly made the appropriate change and testing went forward, much better by the way. Sadly this is not the only time I have encountered this exact issue. Another other time a database was 66GB in size, it got there by 1MB growths.
Capturing your data
Many data professionals have created processes to capture file and wait stats on a regular basis for analysis. Since the wait stats are cumulative, you would want to capture them and compare the deltas between different times of day or before and after certain processes run. This isn’t too complicated and there are numerous blog posts available where people share how they accomplished this. The important part is to be measuring this data so that you can monitor it. How do you know today that things are better or worse on your database server unless you know the data from yesterday?
How can SQL Sentry help?
I'm glad you asked! SQL Sentry Performance Advisor brings latency and waits front and center on the dashboard. Any anomalies are easy to spot; you can switch to historical mode and see the previous trend and compare that to previous periods as well. This can prove to be priceless when analyzing those “what happened?” moments. Everyone has gotten that call, “Yesterday around 3:00PM the system just seemed to freeze, can you tell us what happened?” Um, sure, let me pull up Profiler and go back in time. If you have a monitoring tool like Performance Advisor, you would have that historical information at your fingertips.
In addition to the charts and graphs on the dashboard, you have the ability to use built-in alerts for conditions such as High Disk Waits, High VLF Counts, High CPU, Low Page Life Expectancy, and many more. You also have the ability to create your own custom conditions, and you can learn from the examples on the SQL Sentry site or through the Condition Exchange (Aaron Bertrand has blogged about this). I touched on the alerting side of this in my last article on SQL Server Agent Alerts.
On the Disk Space tab of Performance Advisor, it is very easy to see things like autogrowth settings and high VLF counts. You should know, but in case you don’t, autogrowth by 1MB or 10% is not the best setting. If you see these values (Performance Advisor highlights them for you), you can quickly make note and schedule the time to make the proper adjustments. I love how it displays Total VLFs as well; too many VLFs can be very problematic. You should read Kimberly’s post “Transaction Log VLFs – too many or too few?” if you haven't already.
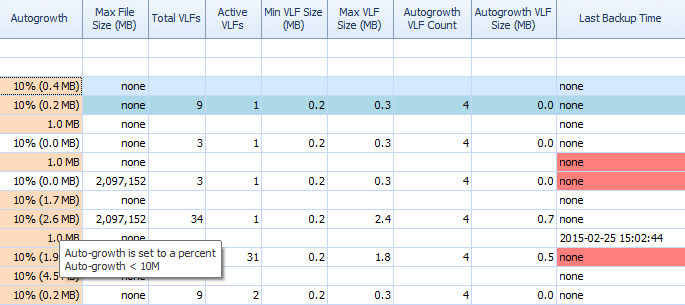 Partial grid on Performance Advisor's Disk Space tab
Another way that Performance Advisor can help is through its patented Disk Activity module. Here you can see that tempdb on F: is experiencing substantial write latency; you can tell this by the thick red lines underneath the disk graphics. You might also notice that F: is the only drive letter whose disk is represented in red; this is a visual cue that the drive has a misaligned partition, which can contribute to I/O problems.
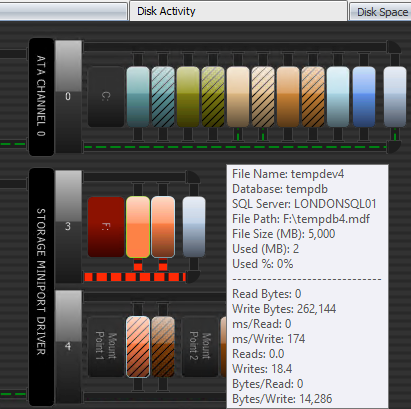 Performance Advisor Disk Activity module
And you can correlate this information in the grids below – problems are highlighted in the grids there, too, and take a look at the ms/Write column:
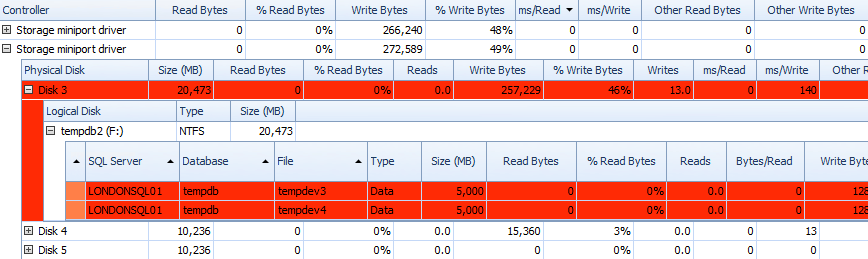 Partial grid of Performance Advisor Disk Activity data
You can also look at this information retroactively; if someone complains about a perceived disk bottleneck yesterday afternoon or last Tuesday, you can simply go back using the date pickers in the toolbar and see the average throughput and latency for any range. For more information on the Disk Activity module, see the User Guide.
Performance Advisor also has a lot of built-in reports under the categories Performance, Blocking, Top SQL, Disk/File Space, and Deadlocks. The image below shows you how to get to the Disk/File Space reports. Having the reports just a few mouse clicks away is very valuable to be able to immediately dig in and view what is (or was) happening on your server.
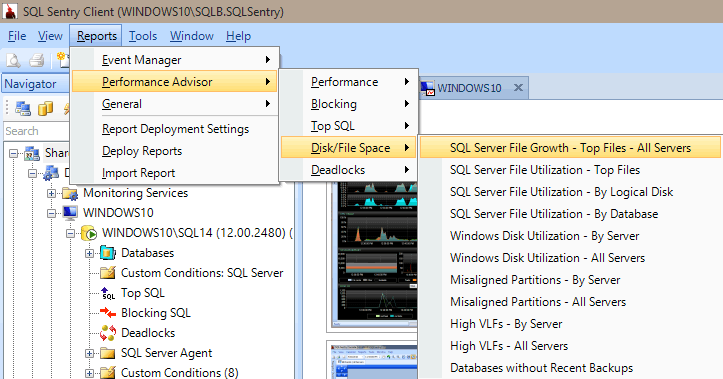 Performance Advisor reports
Summary
The important takeaway from this post is to know your performance metrics. A common statement among data professionals is that disk is our #1 bottleneck. Knowing the file stats of your server will go a long way in helping to understand the pain points on your server. In conjunction with file stats, your wait stats are a great place to look as well. Many people, including myself, start there. Having a tool like SQL Sentry Performance Advisor can drastically help you troubleshoot and find performance issues before they become too problematic; however, if you don’t have such a tool, getting familiar with sys.dm_os_wait_stats and sys.dm_io_virtual_file_stats will serve you well to start tuning your server.


QUESTION:
"What values are good or bad?"
– what column are we going to look at in the provided query?
SELECT * FROM sys.dm_io_virtual_file_stats(NULL, NULL)
I'm so confused with this. please send me email for clarification of this.