


One of the more perplexing problems to troubleshoot in SQL Server can be those related to memory grants. Some queries need more memory than others to execute, based on what operations need to be performed (e.g. sort, hash). SQL Server’s optimizer estimates how much memory is needed, and the query must obtain the memory grant in order to start executing. It holds that grant for the duration of query execution – which means if the optimizer overestimates memory you can run into concurrency issues. If it underestimates memory, then you can see spills in tempdb. Neither is ideal, and when you simply have too many queries asking for more memory than is available to grant, you’ll see RESOURCE_SEMAPHORE waits. There are multiple ways to attack this issue, and one of my new favorite methods is to use Query Store.
Setup
We will use a copy of WideWorldImporters that I inflated using the DataLoadSimulation.DailyProcessToCreateHistory stored procedure. The Sales.Orders table has about 4.6 million rows, and the Sales.OrderLines table has about 9.2 million rows. We will restore the backup and enable Query Store, and clear out any old Query Store data so we do not alter any metrics for this demo.
Reminder: Do not run ALTER DATABASE <YourDBName> SET QUERY_STORE CLEAR; against your production database unless you want to remove everything from Query Store.
  USE [master];
  GO

  RESTORE DATABASE [WideWorldImporters]
  	FROM  DISK = N'C:\Backups\WideWorldImporters.bak' WITH  FILE = 1,
  	MOVE N'WWI_Primary' TO N'C:\Databases\WideWorldImporters\WideWorldImporters.mdf',
  	MOVE N'WWI_UserData' TO N'C:\Databases\WideWorldImporters\WideWorldImporters_UserData.ndf',
  	MOVE N'WWI_Log' TO N'C:\Databases\WideWorldImporters\WideWorldImporters.ldf',
  	NOUNLOAD,  REPLACE,  STATS = 5
  GO

  ALTER DATABASE [WideWorldImporters] SET QUERY_STORE = ON;
  GO

  ALTER DATABASE [WideWorldImporters] SET QUERY_STORE (
  	OPERATION_MODE = READ_WRITE, INTERVAL_LENGTH_MINUTES = 10
  	);
  GO

  ALTER DATABASE [WideWorldImporters] SET QUERY_STORE CLEAR;
  GO
The stored procedure we will use for testing queries the aforementioned Orders and OrderLines tables based on a date range:
  USE [WideWorldImporters];
  GO

  DROP PROCEDURE IF EXISTS [Sales].[usp_OrderInfo_OrderDate];
  GO

  CREATE PROCEDURE [Sales].[usp_OrderInfo_OrderDate]
  	@StartDate DATETIME,
  	@EndDate DATETIME
  AS
  SELECT
  	[o].[CustomerID],
  	[o].[OrderDate],
  	[o].[ContactPersonID],
  	[ol].[Quantity]
  FROM [Sales].[Orders] [o]
  JOIN [Sales].[OrderLines] [ol]
  	ON [o].[OrderID] = [ol].[OrderID]
  WHERE [OrderDate] BETWEEN @StartDate AND @EndDate
  ORDER BY [OrderDate];
  GO
Testing
We will execute the stored procedure will three different sets of input parameters:
  EXEC [Sales].[usp_OrderInfo_OrderDate] '2016-01-01', '2016-01-08';
  GO

  EXEC [Sales].[usp_OrderInfo_OrderDate] '2016-01-01', '2016-06-30';
  GO

  EXEC [Sales].[usp_OrderInfo_OrderDate] '2016-01-01', '2016-12-31';
  GO
The first execution returns 1958 rows, the second returns 267,268 rows, and the last returns over 2.2 million rows. If you look at the date ranges, this isn’t surprising – the larger the date range the more data being returned.
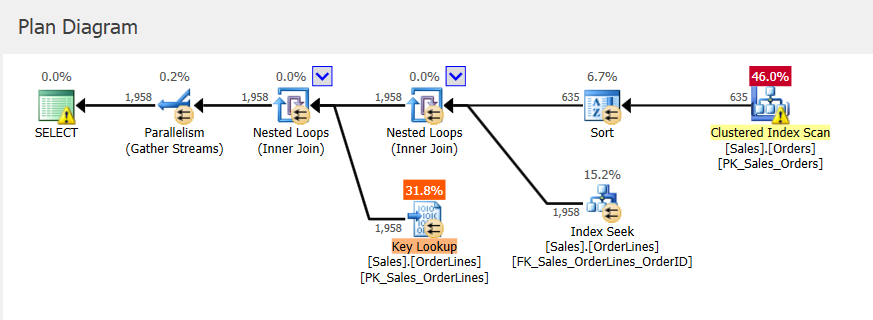
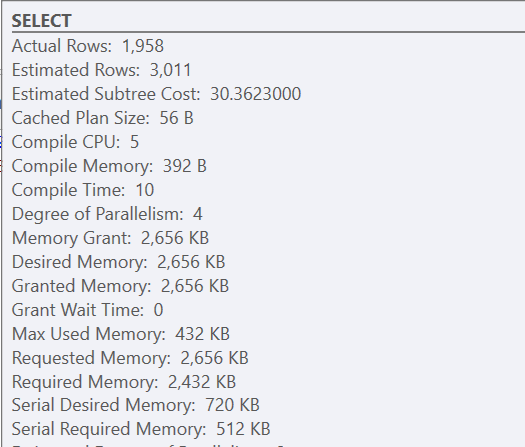
Because this is a stored procedure, the input parameters used initially determine the plan, as well as the memory to be granted. If we look at the actual execution plan for the first execution, we see nested loops and a memory grant of 2656 KB.
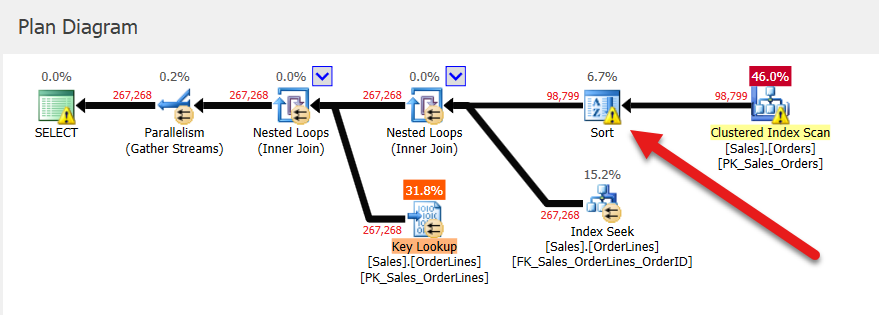
Subsequent executions have the same plan (as that’s what was cached) and the same memory grant, but we get a clue it’s not enough because there’s a sort warning.
If we look in Query Store for this stored procedure, we see three executions and the same values for UsedKB memory, whether we look at Average, Minimum, Maximum, Last, or Standard Deviation. Note: memory grant information in Query Store is reported as the number of 8KB pages.
  SELECT
  	[qst].[query_sql_text],
  	[qsq].[query_id],
  	[qsp].[plan_id],
  	[qsq].[object_id],
  	[rs].[count_executions],
  	[rs].[last_execution_time],
  	[rs].[avg_duration],
  	[rs].[avg_logical_io_reads],
  	[rs].[avg_query_max_used_memory] * 8 AS [AvgUsedKB],
  	[rs].[min_query_max_used_memory] * 8 AS [MinUsedKB],
  	  --memory grant (reported as the number of 8 KB pages) for the query plan within the aggregation interval
  	[rs].[max_query_max_used_memory] * 8 AS [MaxUsedKB],
  	[rs].[last_query_max_used_memory] * 8 AS [LastUsedKB],
  	[rs].[stdev_query_max_used_memory] * 8 AS [StDevUsedKB],
  	TRY_CONVERT(XML, [qsp].[query_plan]) AS [QueryPlan_XML]
  FROM [sys].[query_store_query] [qsq]
  JOIN [sys].[query_store_query_text] [qst]
  	ON [qsq].[query_text_id] = [qst].[query_text_id]
  JOIN [sys].[query_store_plan] [qsp]
  	ON [qsq].[query_id] = [qsp].[query_id]
  JOIN [sys].[query_store_runtime_stats] [rs]
  	ON [qsp].[plan_id] = [rs].[plan_id]
  WHERE [qsq].[object_id] = OBJECT_ID(N'Sales.usp_OrderInfo_OrderDate');

If we are looking for memory grant issues in this scenario – where a plan is cached and re-used – Query Store won’t help us.
But what if the specific query is compiled on execution, either because of a RECOMPILE hint or because it’s ad-hoc?
We can alter the procedure to add the RECOMPILE hint to the statement (which is recommended over adding RECOMPILE at the procedure level, or running the procedure WITH RECOMIPLE):
  ALTER PROCEDURE [Sales].[usp_OrderInfo_OrderDate]
  	@StartDate DATETIME,
  	@EndDate DATETIME
  AS
  SELECT
  	[o].[CustomerID],
  	[o].[OrderDate],
  	[o].[ContactPersonID],
  	[ol].[Quantity]
  FROM [Sales].[Orders] [o]
  JOIN [Sales].[OrderLines] [ol]
  	ON [o].[OrderID] = [ol].[OrderID]
  WHERE [OrderDate] BETWEEN @StartDate AND @EndDate
  ORDER BY [OrderDate]
  OPTION (RECOMPILE);
  GO
Now we will re-run our procedure with the same input parameters as before, and check the output:

Notice that we have a new query_id – the query text changed because we added OPTION (RECOMPILE) to it – and we also have two new plan_id values, and we have different memory grant numbers for one of our plans. For plan_id 5 there is only one execution, and the memory grant numbers match the initial execution – so that plan is for the small date range. The two larger date ranges generated the same plan, but there’s significant variability in the memory grants – 94,528 for minimum, and 573,568 for maximum.
If we look at memory grant information using the Query Store reports, this variability shows up a bit differently. Opening the Top Resource Consumers report from the database, and then changing the metric to be Memory Consumption (KB) and Avg, our query with the RECOMPILE comes to the top of the list.
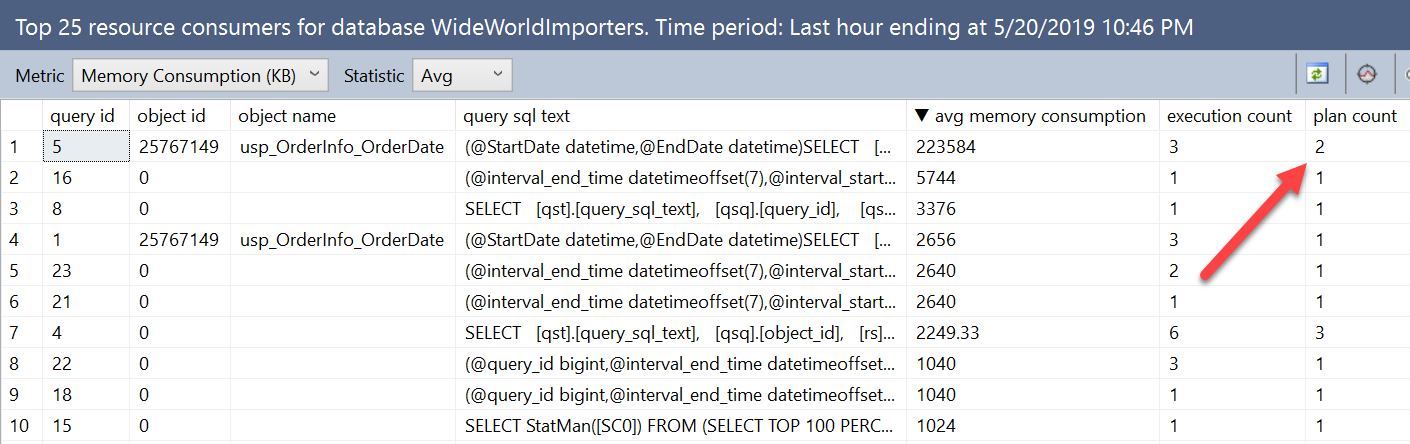
In this window, metrics are aggregated by query, not plan. The query we executed directly against the Query Store views listed not just the query_id but also the plan_id. Here we are able to see that the query has two plans, and we can view them both in the plan summary window, but the metrics are combined for all plans in this view.
The variability in memory grants is obvious when we’re looking directly at the views. We can find queries with variability using the UI by changing the Statistic from Avg to StDev:
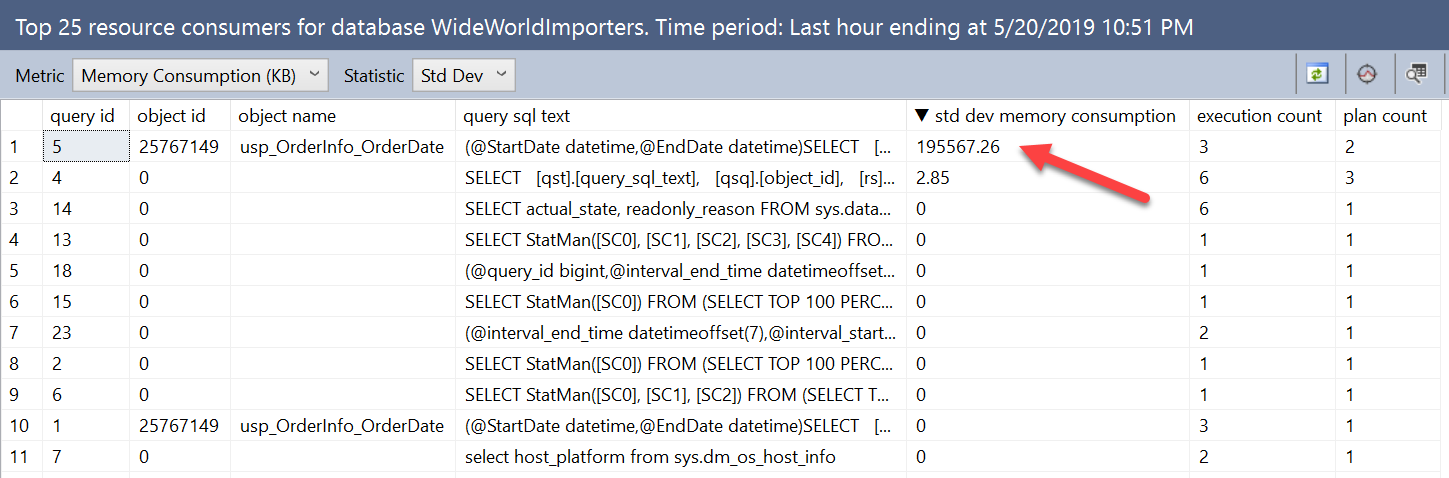
We can find the same information by querying the Query Store views and ordering by stdev_query_max_used_memory descending. But, we can also search based on the difference between the minimum and maximum memory grant, or a percentage of the difference. For example, if we were concerned about cases where the difference in the grants was greater than 512MB, we could run:
  SELECT
  	[qst].[query_sql_text],
  	[qsq].[query_id],
  	[qsp].[plan_id],
  	[qsq].[object_id],
  	[rs].[count_executions],
  	[rs].[last_execution_time],
  	[rs].[avg_duration],
  	[rs].[avg_logical_io_reads],
  	[rs].[avg_query_max_used_memory] * 8 AS [AvgUsedKB],
  	[rs].[min_query_max_used_memory] * 8 AS [MinUsedKB],
  	[rs].[max_query_max_used_memory] * 8 AS [MaxUsedKB],
  	[rs].[last_query_max_used_memory] * 8 AS [LastUsedKB],
  	[rs].[stdev_query_max_used_memory] * 8 AS [StDevUsedKB],
  	TRY_CONVERT(XML, [qsp].[query_plan]) AS [QueryPlan_XML]
  FROM [sys].[query_store_query] [qsq]
  JOIN [sys].[query_store_query_text] [qst]
  	ON [qsq].[query_text_id] = [qst].[query_text_id]
  JOIN [sys].[query_store_plan] [qsp]
  	ON [qsq].[query_id] = [qsp].[query_id]
  JOIN [sys].[query_store_runtime_stats] [rs]
  	ON [qsp].[plan_id] = [rs].[plan_id]
  WHERE ([rs].[max_query_max_used_memory]*8) - ([rs].[min_query_max_used_memory]*8) > 524288;
Those of you running SQL Server 2017 with Columnstore indexes, who have the advantage of Memory Grant feedback, can also use this information in Query Store. We will first change our Orders table to add a clustered Columnstore index:
  ALTER TABLE [Sales].[Invoices] DROP CONSTRAINT [FK_Sales_Invoices_OrderID_Sales_Orders];
  GO

  ALTER TABLE [Sales].[Orders] DROP CONSTRAINT [FK_Sales_Orders_BackorderOrderID_Sales_Orders];
  GO

  ALTER TABLE [Sales].[OrderLines] DROP CONSTRAINT [FK_Sales_OrderLines_OrderID_Sales_Orders];
  GO

  ALTER TABLE [Sales].[Orders] DROP CONSTRAINT [PK_Sales_Orders] WITH ( ONLINE = OFF );
  GO

  CREATE CLUSTERED COLUMNSTORE INDEX CCI_Orders
  ON [Sales].[Orders];
Then we will set the database combability mode to 140 so we can leverage memory grant feedback:
  ALTER DATABASE [WideWorldImporters] SET COMPATIBILITY_LEVEL = 140;
  GO
Finally, we’ll change our stored procedure to remove OPTION (RECOMPILE) from our query and then run it a few times with the different input values:
  ALTER PROCEDURE [Sales].[usp_OrderInfo_OrderDate]
  	@StartDate DATETIME,
  	@EndDate DATETIME
  AS
  SELECT
  	[o].[CustomerID],
  	[o].[OrderDate],
  	[o].[ContactPersonID],
  	[ol].[Quantity]
  FROM [Sales].[Orders] [o]
  JOIN [Sales].[OrderLines] [ol]
  	ON [o].[OrderID] = [ol].[OrderID]
  WHERE [OrderDate] BETWEEN @StartDate AND @EndDate
  ORDER BY [OrderDate];
  GO

  EXEC [Sales].[usp_OrderInfo_OrderDate] '2016-01-01', '2016-01-08';
  GO

  EXEC [Sales].[usp_OrderInfo_OrderDate] '2016-01-01', '2016-06-30';
  GO

  EXEC [Sales].[usp_OrderInfo_OrderDate] '2016-01-01', '2016-12-31';
  GO

  EXEC [Sales].[usp_OrderInfo_OrderDate] '2016-01-01', '2016-06-30';
  GO

  EXEC [Sales].[usp_OrderInfo_OrderDate] '2016-01-01', '2016-01-08';
  GO

  EXEC [Sales].[usp_OrderInfo_OrderDate] '2016-01-01', '2016-12-31';
  GO
Within Query Store we see the following:

We have a new plan for query_id = 1, which has different values for the memory grant metrics, and a slightly lower StDev than we had with plan_id 6. If we look in the plan in Query Store we see that it accesses the clustered Columnstore index:
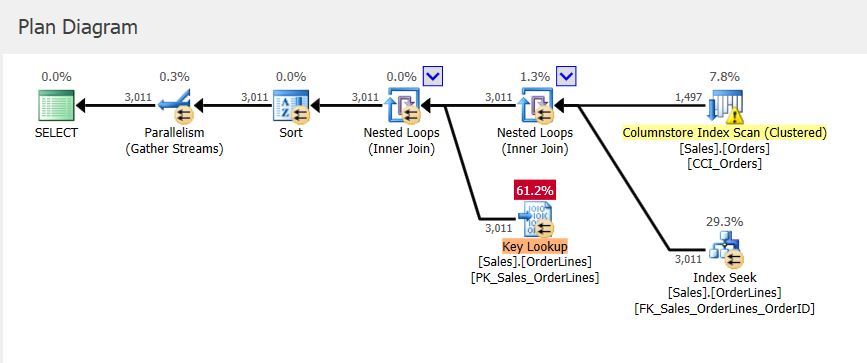
Remember that the plan in Query Store is the one that was executed, but it only contains estimates. While the plan in the plan cache has memory grant information updated when memory feedback occurs, this information does not get applied to the existing plan in Query Store.
Summary
Here’s what I like about using Query Store to look at queries with variable memory grants: the data is automatically being collected. If this problem shows up unexpectedly, we don’t have to put anything in place to try and collect information, we already have it captured in Query Store. In the case where a query is parameterized, it may be harder to find memory grant variability due to the potential for static values because of plan caching. However, we may also discover that, due to recompilation, the query has multiple plans with extremely different memory grant values that we could use to track down the problem. There are a variety of ways to investigate the problem using the data captured in Query Store, and it allows you to look at problems proactively as well as reactively.


Thank you so much for your post! We have been having major performance degradation on Azure (15x degradation during busy periods), the product team pointed out some major memory grant issues, but we haven't been able to find the memory grant information in the query store. We have scoured the web and nobody else mentioned anywhere the link between max_query_max_used_memory and memory grants. Now I just have to figure out how/why simple insert..values statements are needing 2.3 GB of memory.