
Microsoft has been enhancing the contents of the ShowplanXML output for SQL Server over the last few releases and in SQL Server 2017 CU3, they introduced user-defined function (UDF) execution statistics into the QueryTimeStats node of the XML output. This was also back ported to SQL Server 2016 in Service Pack 2 for actual execution plans. This feature allows you to definitively know the impact of scalar UDF execution as part of the performance characteristics of a query. However, there is an interesting catch associated with using this feature; you have to collect the actual execution plan using an up to date version of SQL Server Management Studio or using SentryOne Plan Explorer, or the information will be removed from the execution plan.
Comparing Plans in Different SSMS Versions
I recently presented a user group session in Chicago on query performance tuning using the plan cache and during the session I was using the latest release of SQL Server Management Studio at that time, version 17.5. At the time I had also recently updated my VM to SQL Server 2016 Service Pack 2, so I demonstrated the new UdfElapsedTime and UdfCpuTime information in the actual showplan QueryTimeStats and made a note for myself to write an article about thm. When I came back to actually start this article, using the exact same query on the exact same VM, I could not generate an actual execution plan that contained the UdfElapsedTime or UdfCpuTime information despite repeated attempts. I could not figure out what I was doing wrong, and it turned out that the root of the issue was that I had accidentally launched SQL Server Management Studio 2016 instead of SQL Server Management Studio 17.5. When I ran the same query in SSMS 17.5 I suddenly got back the UdfElapsedTime and UdfCpuTime information. See below for examples of the XML returned from both SSMS versions:
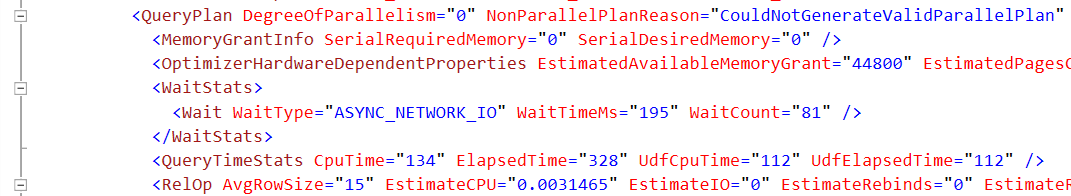 Showplan XML from SSMS 17.5
 Showplan XML from SSMS 2016 – WaitStats and QueryTimeStats have been completely removed
I used the Microsoft Message Analyzer to produce a TCP trace of network traffic on port 1433 between a client running SSMS 2016 against an SQL Server 2016 SP2 instance to capture the TDS packets being sent from the server to the client. This reveals that the ShowPlanXML returned by the server included the QueryTimeStats information even though it does not appear in the ShowPlanXML in SSMS 2016, so the client is actually stripping out any fields not included in the schema definition that shipped with the client.
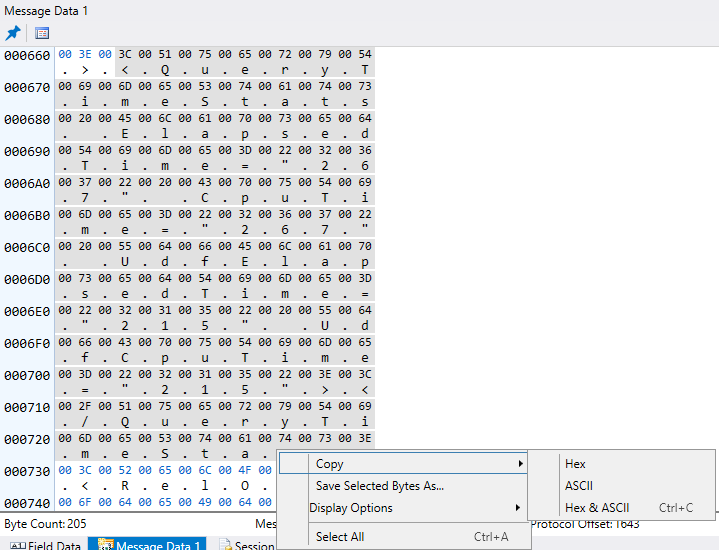
<.Q.u.e.r.y.T.i.m.e.S.t.a.t.s. .E.l.a.p.s.e.d.T.i.m.e.=.".2.6.7.". .C.p.u.T.i.m.e.=.".2.6.7.". .U.d.f.E.l.a.p.s.e.d.T.i.m.e.=.".2.1.5.". .U.d.f.C.p.u.T.i.m.e.=.".2.1.5.".>.<./.Q.u.e.r.y.T.i.m.e.S.t.a.t.s.>
This is something to watch out for with .sqlplan files that are generated using older client versions of SSMS and/or execution plans that are saved or copied from an older version of SSMS, which is something that often happens when I am working with clients by email.
In SSMS, looking at the graphical execution plan doesn’t give you any indication of the performance impact of the scalar user-defined function execution in the query:
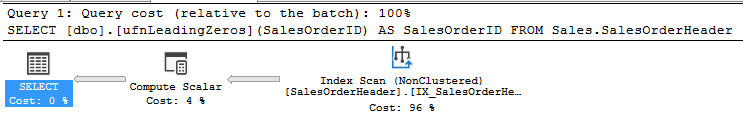
If we based our analysis of the performance strictly on the costs of each operator, the Compute Scalar for the function execution does not look like a significant impact to performance. The tool tips for the operators also don’t materialize the information or contain any warnings about the impact of the user-defined function. The only place we see that information within SSMS currently is in the XML of the plan, or in the Properties Window for the SELECT root operator of the plan, as shown below:
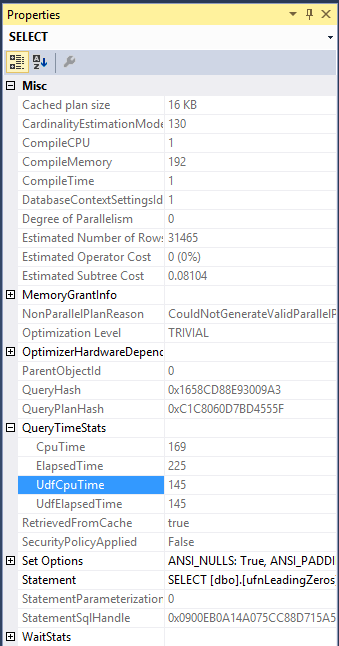
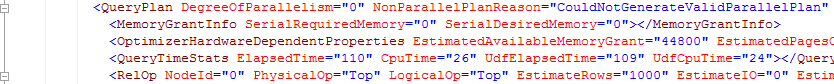
Using the information here though, we can see that the UdfCpuTime is 85.79% of the total CpuTime and the UdfElapsedTime is 64.44% of the total ElapsedTime for the query’s execution (doing the math to calculate the percentages using the QueryTimeStats CpuTime and UdfCpuTime (highlighted in blue above), and the ElapsedTime and UdfElapsedTime).
Using SentryOne Plan Explorer to Retrieve Plans
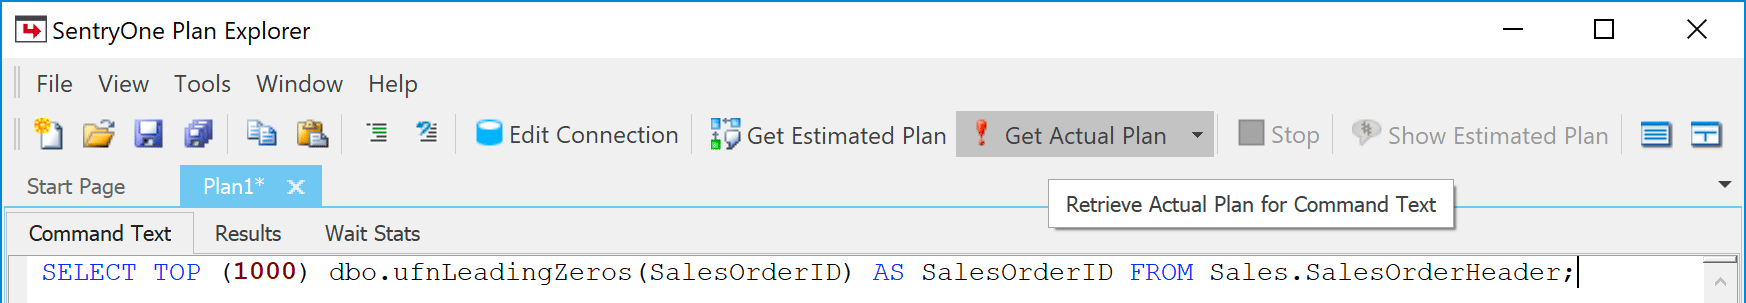
One of my favorite free tools for helping with SQL Server performance tuning is SentryOne Plan Explorer, and one of the features of Plan Explorer for a long time has been the ability to generate an actual execution plan by pasting the command text into a new window and clicking on the Get Actual Plan button, as shown below.
Since Plan Explorer reads the ShowplanXML as it is provided by the SQL Server engine, it will also contain the enhanced information in the QueryTimeStats. However, if you open an execution plan that was saved from an older version of Management Studio, or if you use the Plan Explorer Addin for SSMS in an older version to view the plan in Plan Explorer, then the enhanced information will not be shown.
The Statement grid of the Results tab in Plan Explorer can be updated using the Column Chooser to add the UDF Duration and UDF CPU columns along with the existing columns in the grid, making it easy to see where user-defined function execution is having an impact for large multi-statement batches. Plan Explorer also provides highlighting of these columns when they are a significant portion of the overall CPU and/or duration as shown below.

The plan diagram information in Plan Explorer has also been enhanced. Here are the diagrams using Costs by CPU + I/O and then Costs by CPU:
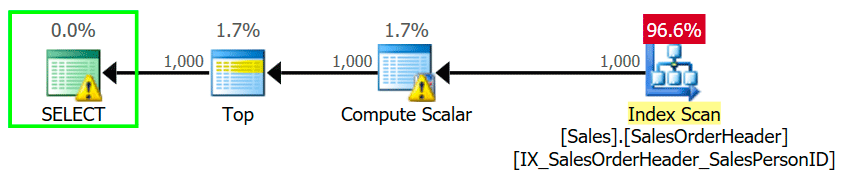 Plan diagram using Costs by CPU + I/O
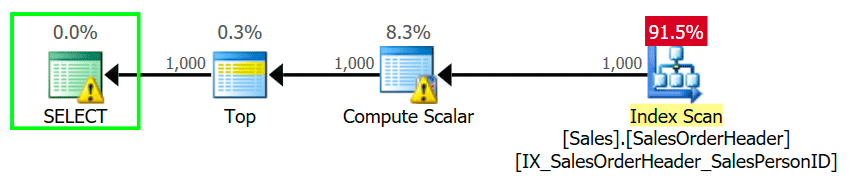 Plan diagram using Costs by CPU
There are additional warnings on the root SELECT operator when the execution statistics for user-defined functions indicate they are a significant portion of the overall CPU and/or overall duration:
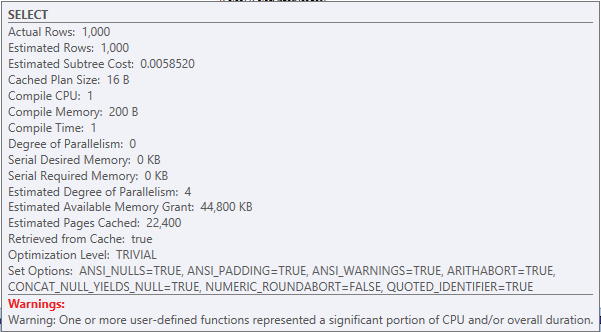 Tooltip for the root SELECT operator
The Compute Scalar operator also has a warning in Plan Explorer based on the row count being processed by the operation, even for plans that do not include the enhancements for the ShowplanXML:
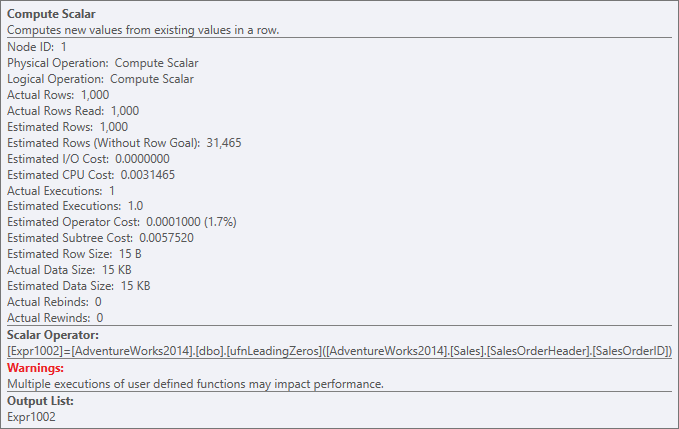 Tooltip for the Compute Scalar operator
Showing costs by CPU can help to identify operators with hidden CPU costs that might get drowned out by I/O. This ability to shift the view slightly to troubleshoot either CPU or I/O on its own is one of the many differentiators between Plan Explorer and SSMS. Here is the diagram's context menu where you can change this view:

Conclusion
The enhancements to the Showplan XML in SQL Server makes it much easier to determine the overall impact of scalar user-defined functions on query performance in SQL Server 2016 Service Pack 2 and SQL Server 2017 Cumulative Update 3, as long as you are using a more recent version of the client tools or Plan Explorer to retrieve the execution plan.