

When looking at query performance there are a lot of great sources of information within SQL Server, and one of my favorites is the query plan itself. In the last several releases, notably starting with SQL Server 2012, each new version has included more detail in the execution plans. While the list of enhancements continues to grow, here are a few attributes that I have I have found valuable:
- NonParallelPlanReason (SQL Server 2012)
- Residual predicate pushdown diagnostics (SQL Server 2012 SP3, SQL Server 2014 SP2, SQL Server 2016 SP1)
- tempdb spill diagnostics (SQL Server 2012 SP3, SQL Server 2014 SP2, SQL Server 2016)
- Trace Flags Enabled (SQL Server 2012 SP4, SQL Server 2014 SP2, SQL Server 2016 SP1)
- Operator Query Execution Statistics (SQL Server 2014 SP2, SQL Server 2016)
- Maximum memory enabled for a single query (SQL Server 2014 SP2, SQL Server 2016 SP1)
To view what exists for each version of SQL Server, visit the Showplan Schema page, where you can find the schema for each version since SQL Server 2005.
As much as I love all this extra data, it's important to note that some information is more relevant for an actual execution plan, versus an estimated one (e.g. tempdb spill information). Some days we can capture and use the actual plan for troubleshooting, other times we have to use the estimated plan. Very often we get that estimated plan – the plan that has been used for problematic executions potentially – from SQL Server's plan cache. And pulling individual plans is appropriate when tuning a specific query or set or queries. But what about when you want ideas on where to focus your tuning efforts in terms of patterns?
The SQL Server plan cache is a prodigious source of information when it comes to performance tuning, and I don't simply mean troubleshooting and trying to understand what's been running in a system. In this case, I'm talking about mining information from the plans themselves, which are found in sys.dm_exec_query_plan, stored as XML in the query_plan column.
When you combine this data with information from sys.dm_exec_sql_text (so you can easily view the text of the query) and sys.dm_exec_query_stats (execution statistics), you can suddenly start to look for not just those queries that are the heavy hitters or execute most frequently, but those plans that contain a particular join type, or index scan, or those that have the highest cost. This is commonly referred to as mining the plan cache, and there are several blog posts that talk about how to do this. My colleague, Jonathan Kehayias, says he hates to write XML yet he has several posts with queries for mining the plan cache:
- Tuning 'cost threshold for parallelism' from the Plan Cache
- Finding Implicit Column Conversions in the Plan Cache
- Finding what queries in the plan cache use a specific index
- Digging into the SQL Plan Cache: Finding Missing Indexes
- Finding Key Lookups inside the Plan Cache
If you've never explored what's in your plan cache, the queries in these posts are a good start. However, the plan cache does have its limitations. For example, it is possible to execute a query and not have the plan go into cache. If you have optimize for adhoc workloads option enabled for instance, then on first execution, the compiled plan stub is stored in the plan cache, not the full compiled plan. But the biggest challenge is that the plan cache is temporary. There are many events in SQL Server which can clear the plan cache entirely or clear it for a database, and plans can be aged out of cache if not used, or removed after a recompile. To combat this, typically you have to either query the plan cache regularly, or snapshot the contents to a table on a scheduled basis.
This changes in SQL Server 2016 with Query Store.
When a user database has Query Store enabled, the text and plans for queries executed against that database are captured and retained in internal tables. Rather than a temporary view of what's currently executing, we have a long-term picture of what has previously executed. The amount of data retained is determined by the CLEANUP_POLICY setting, which defaults to 30 days. Compared to a plan cache that may represent just a few hours' worth of query execution, the Query Store data is a game changer.
Consider a scenario where you're doing some index analysis – you have some indexes not being used, and you have some recommendations from the missing index DMVs. The missing index DMVs don't provide any detail about what query generated the missing index recommendation. You can query the plan cache, using the query from Jonathan's Finding Missing Indexes post. If I execute that against my local SQL Server instance, I get a couple rows of output related to some queries I ran earlier.

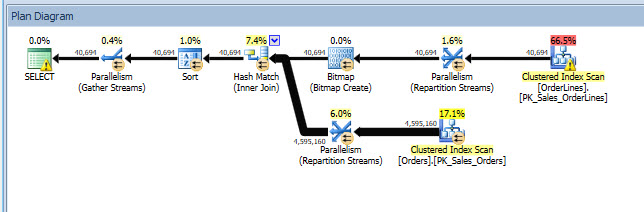
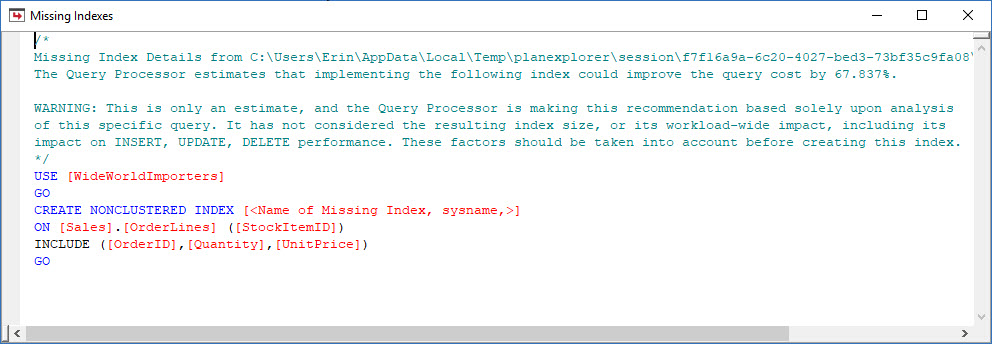
I can open up the plan in Plan Explorer, and I see there's a warning on the SELECT operator, which is for the missing index:
This is a great start, but again, my output depends on whatever is in the cache. I can take Jonathan's query and modify for Query Store, then run it against my demo WideWorldImporters database:
USE WideWorldImporters;
GO

WITH XMLNAMESPACES
   (DEFAULT 'http://schemas.microsoft.com/sqlserver/2004/07/showplan')

SELECT
	query_plan,
	n.value('(@StatementText)[1]', 'VARCHAR(4000)') AS sql_text,
	n.value('(//MissingIndexGroup/@Impact)[1]', 'FLOAT') AS impact,
    DB_ID(PARSENAME(n.value('(//MissingIndex/@Database)[1]', 'VARCHAR(128)'),1)) AS database_id,
    OBJECT_ID(n.value('(//MissingIndex/@Database)[1]', 'VARCHAR(128)') + '.' +
        n.value('(//MissingIndex/@Schema)[1]', 'VARCHAR(128)') + '.' +
        n.value('(//MissingIndex/@Table)[1]', 'VARCHAR(128)')) AS OBJECT_ID,
    n.value('(//MissingIndex/@Database)[1]', 'VARCHAR(128)') + '.' +
        n.value('(//MissingIndex/@Schema)[1]', 'VARCHAR(128)') + '.' +
        n.value('(//MissingIndex/@Table)[1]', 'VARCHAR(128)')
    AS object,
	(   SELECT DISTINCT c.value('(@Name)[1]', 'VARCHAR(128)') + ', '
        FROM n.nodes('//ColumnGroup') AS t(cg)
        CROSS APPLY cg.nodes('Column') AS r(c)
        WHERE cg.value('(@Usage)[1]', 'VARCHAR(128)') = 'EQUALITY'
        FOR  XML PATH('')
    ) AS equality_columns,
    (  SELECT DISTINCT c.value('(@Name)[1]', 'VARCHAR(128)') + ', '
        FROM n.nodes('//ColumnGroup') AS t(cg)
        CROSS APPLY cg.nodes('Column') AS r(c)
        WHERE cg.value('(@Usage)[1]', 'VARCHAR(128)') = 'INEQUALITY'
        FOR  XML PATH('')
    ) AS inequality_columns,
    (   SELECT DISTINCT c.value('(@Name)[1]', 'VARCHAR(128)') + ', '
        FROM n.nodes('//ColumnGroup') AS t(cg)
        CROSS APPLY cg.nodes('Column') AS r(c)
        WHERE cg.value('(@Usage)[1]', 'VARCHAR(128)') = 'INCLUDE'
        FOR  XML PATH('')
    ) AS include_columns
FROM (
	SELECT query_plan
	FROM
	(
	  SELECT TRY_CONVERT(XML, [qsp].[query_plan]) AS [query_plan]
	  FROM sys.query_store_plan [qsp]) tp
	  WHERE tp.query_plan.exist('//MissingIndex')=1
	  ) AS tab (query_plan)
CROSS APPLY query_plan.nodes('//StmtSimple') AS q(n)
WHERE n.exist('QueryPlan/MissingIndexes') = 1;
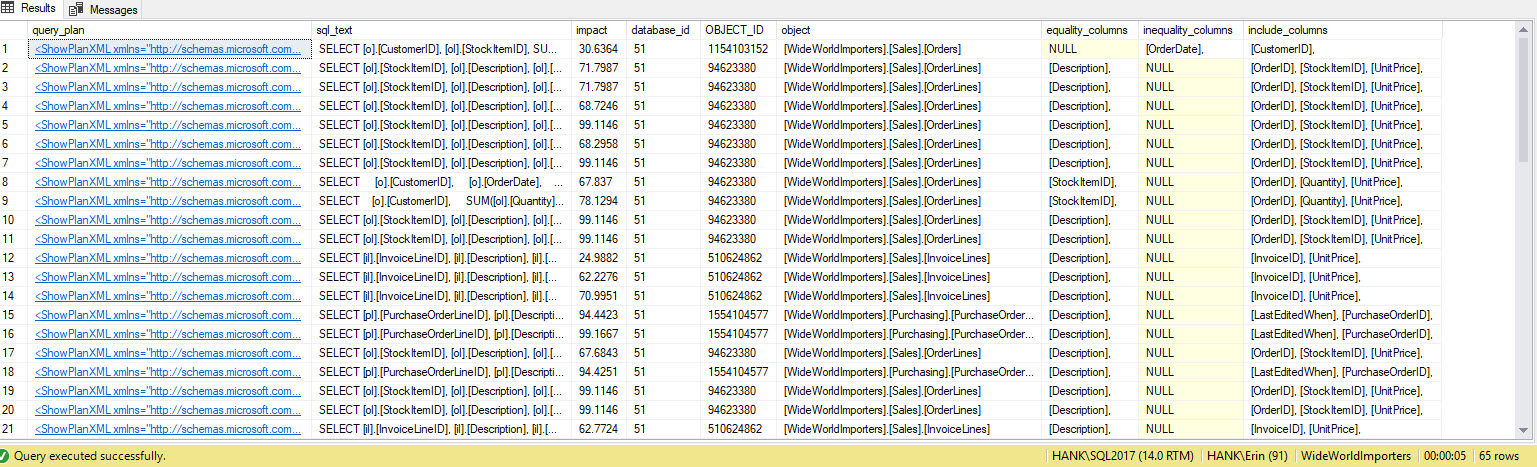
I get many more rows in the output. Again, the Query Store data represents a larger view of queries executed against the system, and using this data gives us a comprehensive method to determine not just what indexes are missing, but what queries those indexes would support. From here, we can dig deeper into Query Store and look at performance metrics and execution frequency to understand the impact of creating the index and decide if the query executes often enough to warrant the index.
If you are not using Query Store, but you are using SentryOne, you can mine this same information from the SentryOne database. The query plan is stored in the dbo.PerformanceAnalysisPlan table in a compressed format, so the query we use is a similar variation to the one above, but you will notice the DECOMPRESS function is used as well:
USE SentryOne;
GO

WITH XMLNAMESPACES
   (DEFAULT 'http://schemas.microsoft.com/sqlserver/2004/07/showplan')

SELECT
	query_plan,
	n.value('(@StatementText)[1]', 'VARCHAR(4000)') AS sql_text,
	n.value('(//MissingIndexGroup/@Impact)[1]', 'FLOAT') AS impact,
    DB_ID(PARSENAME(n.value('(//MissingIndex/@Database)[1]', 'VARCHAR(128)'),1)) AS database_id,
    OBJECT_ID(n.value('(//MissingIndex/@Database)[1]', 'VARCHAR(128)') + '.' +
        n.value('(//MissingIndex/@Schema)[1]', 'VARCHAR(128)') + '.' +
        n.value('(//MissingIndex/@Table)[1]', 'VARCHAR(128)')) AS OBJECT_ID,
    n.value('(//MissingIndex/@Database)[1]', 'VARCHAR(128)') + '.' +
        n.value('(//MissingIndex/@Schema)[1]', 'VARCHAR(128)') + '.' +
        n.value('(//MissingIndex/@Table)[1]', 'VARCHAR(128)')
    AS object,
	(   SELECT DISTINCT c.value('(@Name)[1]', 'VARCHAR(128)') + ', '
        FROM n.nodes('//ColumnGroup') AS t(cg)
        CROSS APPLY cg.nodes('Column') AS r(c)
        WHERE cg.value('(@Usage)[1]', 'VARCHAR(128)') = 'EQUALITY'
        FOR  XML PATH('')
    ) AS equality_columns,
    (  SELECT DISTINCT c.value('(@Name)[1]', 'VARCHAR(128)') + ', '
        FROM n.nodes('//ColumnGroup') AS t(cg)
        CROSS APPLY cg.nodes('Column') AS r(c)
        WHERE cg.value('(@Usage)[1]', 'VARCHAR(128)') = 'INEQUALITY'
        FOR  XML PATH('')
    ) AS inequality_columns,
    (   SELECT DISTINCT c.value('(@Name)[1]', 'VARCHAR(128)') + ', '
        FROM n.nodes('//ColumnGroup') AS t(cg)
        CROSS APPLY cg.nodes('Column') AS r(c)
        WHERE cg.value('(@Usage)[1]', 'VARCHAR(128)') = 'INCLUDE'
        FOR  XML PATH('')
    ) AS include_columns
FROM (
	SELECT query_plan
	FROM
	(
	  SELECT -- need to decompress the gzipped xml here:
CONVERT(xml, CONVERT(nvarchar(max), CONVERT(varchar(max), DECOMPRESS(PlanTextGZ)))) AS [query_plan]
FROM dbo.PerformanceAnalysisPlan) tp
	  WHERE tp.query_plan.exist('//MissingIndex')=1
	  ) AS tab (query_plan)
CROSS APPLY query_plan.nodes('//StmtSimple') AS q(n)
WHERE n.exist('QueryPlan/MissingIndexes') = 1;
On one SentryOne system I had the following output (and of course clicking on any of the query_plan values will open the graphical plan):

A couple of advantages SentryOne offers over Query Store is that you don't have to enable this type of collection per database, and the monitored database does not have to support the storage requirements, since all of the data is stored in the repository. You can also capture this information across all supported versions of SQL Server, not just those that support Query Store. Note though that SentryOne only collects queries that exceed thresholds such as duration and reads. You can tweak these default thresholds, but it is one item to be aware of when mining the SentryOne database: not all queries may be collected. In addition, the DECOMPRESS function is not available until SQL Server 2016; for older versions of SQL Server, you will either want to:
- Back up the SentryOne database and restore it on SQL Server 2016 or higher to run the queries;
- bcp the data out of the dbo.PerformanceAnalysisPlan table and import it into a new table on a SQL Server 2016 instance;
- query the SentryOne database via a linked server from a SQL Server 2016 instance; or,
- query the database from application code which can parse for specific things after decompressing.
With SentryOne, you have the ability to mine not just the plan cache, but also the data retained within the SentryOne repository. If you're running SQL Server 2016 or higher, and you have Query Store enabled, you can also find this information in sys.query_store_plan. You are not limited to just this example of finding missing indexes; all of the queries from Jonathan's other plan cache posts can be modified to be used to mine data from SentryOne or from Query Store. Further, if you are familiar enough with XQuery (or willing to learn), you can use the Showplan Schema to figure out how to parse the plan to find the information you want. This gives you the ability to find patterns, and anti-patterns, in your query plans that your team can fix before they become a problem.