
Last Friday, I gave a webinar about Plan Explorer 3.0, the new features, and why we decided to eliminate the PRO edition and give away all the features for free. If you missed it, you can watch the webinar here:
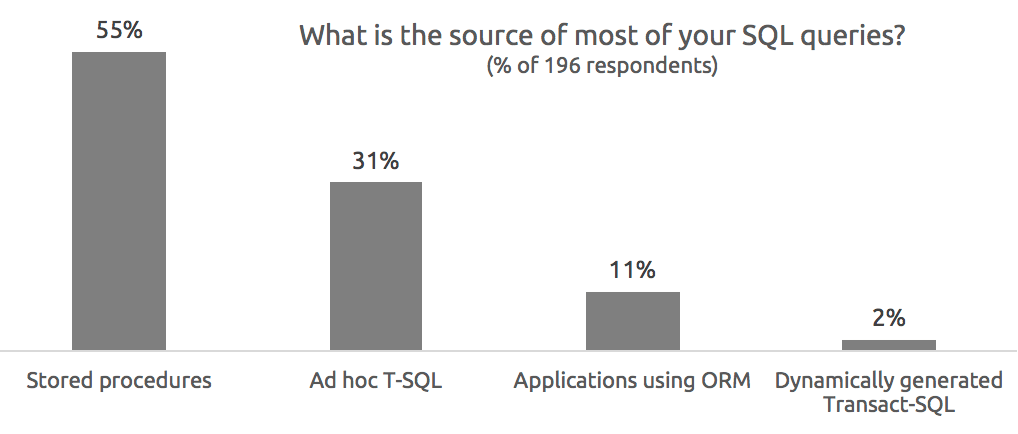
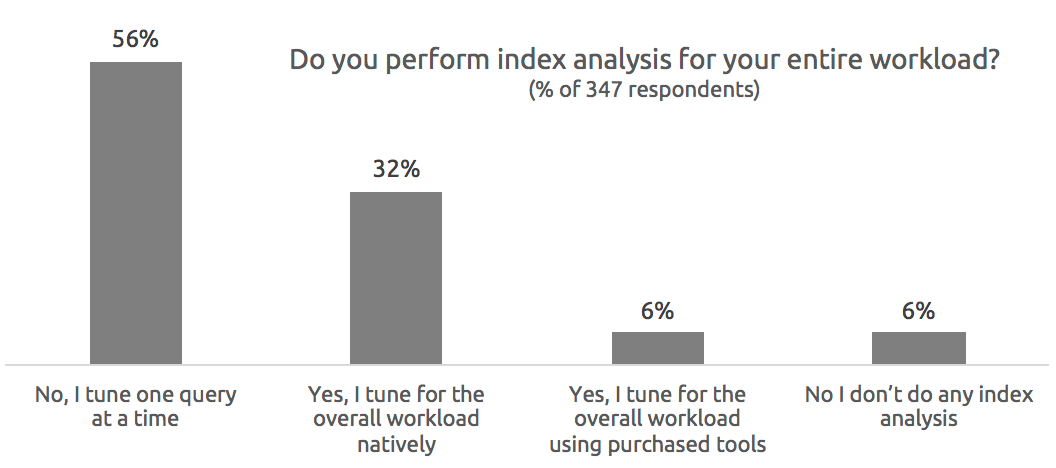
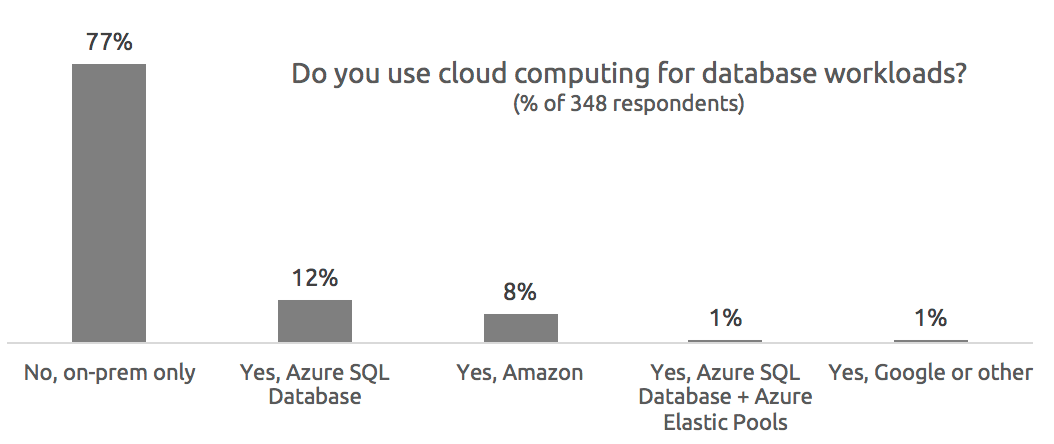
There were many great questions submitted, and I will try to address those here. We also asked a few of our own questions at different points during the presentation, and users asked for details of those, so I'll start with the survey questions. We had a peak of 502 attendees, and I will indicate on the charts below how many people answered each question. Since the first question was asked before the webinar technically started, a smaller number of people answered that one.
Audience Questions
Q: Are the code samples available?
A: Yes, the three session files I used for my demos are available here:
You can open these in the latest build of Plan Explorer, but if you want to run any of the queries again locally, you'll need AdventureWorks2014 (with the enlarging script from Jonathan Kehayias) and/or the new Wide World Importers sample database.
Q: So everything shown today is in the new, unified, free Plan Explorer? If so, what is your company's new revenue model?
A: I'm always surprised when I come across people who think that all we offer is Plan Explorer (I see these in person, and there were several similar comments on Greg's blog post as well). Our real bread and butter is in our monitoring platform, and we're hoping that your positive experience with Plan Explorer will lead you to try out our other solutions, too.
Q: We're still using SQL Server 2008. Are there benefits to using PE vs SSMS?
A: Yes, while you will miss out on some of the functionality (such as Live Query Profile), there is a lot more information available to you compared to SSMS, and we go out of our way to make specific issues much more discoverable.
Q: Will Live Query Profile work for SQL Server 2014?
A: Yes, as long as Service Pack 1 is applied, as the feature relies on a DMV that was added in SQL Server 2014 SP1.
Q: What are the limitations with respect to SQL Server 2012? Can I use this tool at all?
A: Absolutely. The limitation I brought up during the webinar about SQL Server 2012 and lower is that they are unable to capture Live Query Profile data.
Q: Is the data only collected for SQL Server 2014 and higher? What if SQL Server 2014 is installed but the compatibility is set to 2012?
A: Yes, Live Query Profile (and the resource charts) works in SQL Server 2014 (with at least SP1), SQL Server 2016, and Azure SQL Database. It is unaffected by compatibility level.
Q: Which version of SQL Server is needed to get the wait stats information back?
A: Wait statistics collection relies on an Extended Events session, so you need to be running against SQL Server 2008 or higher, and execute in the context of a user or login with enough permissions to create and drop an Extended Events session (CONTROL SERVER in SQL Server 2008 and 2008 R2, and ALTER ANY EVENT SESSION in SQL Server 2012 and above).
Q: How do I get Index Analysis or the Live Query Profile charts to display?
A: There were many variations on these two questions, and from the sounds of it, people were actively playing with the new version during the webinar, and not seeing either the Index Analysis data or the Live Query Profile data. If you have an existing plan captured from SSMS or an earlier version of Plan Explorer, there won't be any information to display.
In order to collect Index Analysis data, you must generate an estimated or actual plan from within Plan Explorer. In order to see a columns and indexes grid, you must choose a Selected Operation: in the dropdown at the top of the Index Analysis tab.
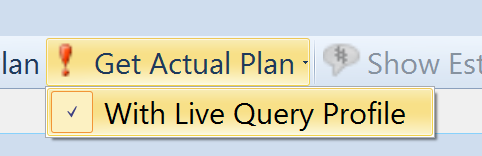
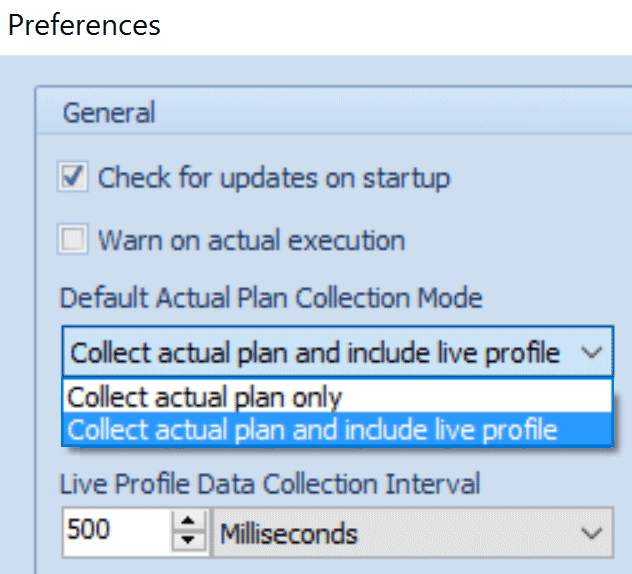
In order to collect Live Query Profile data, you must generate an actual plan from within Plan Explorer, and be running against 2014 SP1 or better. You also need to ensure you have selected the option "With Live Query Profile" (see image at right), and wait for the query execution to finish before the charts will render. In a future version, the charts will render in real time, but in this release we do that after all of the data has been collected.
Q: Does the Live Query Profile function against cloned databases in SQL Server 2014 SP2?
A: Yes, this will work, however it won't provide much information since a cloned database is empty – you will see the right estimates in the plan, but the actuals will all be 0, and so the runtime metrics won't represent any realistic or meaningful bottlenecks. Unless you are populating the clone with alternate data, as Erin Stellato promotes in an earlier post. Also note that if you want query plans to reflect real production data sizes, you'll want to make sure all forms of auto-stats are off, otherwise they will be updated as you run queries, and then all estimates will be 0.
Q: Does the new version of Plan Explorer work with SQL Server 2016?
A: Yes. We support all of the new SQL Server 2016 plan operators and other showplan changes (see my post, "Plan Explorer Support for SQL Server 2016"), and the add-in works with the latest version of SSMS as well (see my post, "Announcing Plan Explorer Add-In Support for SSMS 2016").
Q: So even an actual execution plan in SSMS is labeled with estimated costs?
A: Yes, that's right. When you capture Live Query Profile data, we can change the cost percentages for all of the operators, because we know with a significant degree of accuracy how much actual work each operation performed (the query needs to run longer than a threshold, however). This can be especially useful if you are troubleshooting an I/O problem, because the estimates never seem to take I/O bottlenecks into account. The following graphic cycles through the original estimates (we can always show you what SSMS would have told you), the actuals after re-costing, and the actuals after re-costing and changing costs to "by I/O" and line widths to "by data size":
Q: I used to open my plan produced by SSMS in Plan Explorer but from what Aaron just showed, did I understand correctly that I should run my queries (while tuning) from Plan Explorer?
A: I addressed this question in the webinar, but to be clear, I think there are two steps in the evolution of a query: (1) ensuring correct results, and (2) performance optimization. I am a strong believer that currently you should be using SSMS for (1) and Plan Explorer for (2). I've long promoted that once people are sure they have correct results, they should tune by generating actual execution plans from within Plan Explorer, because we collect a lot more runtime information for you. This runtime information is particularly helpful if you share your plans on our Q & A site, because it makes all of the metrics and potential bottlenecks much more apparent.
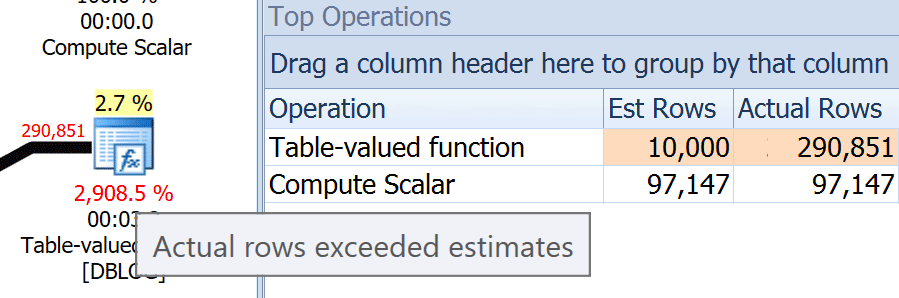
Q: What are the percentages below the operator… for example that 2,885% below the function?
A: That percentage is not a cost but rather the % of rows that were actually processed compared to the estimate. In this case, SQL Server estimated that the function would return 10,000 rows, but at runtime it returned close to 300,000! You can see a tooltip if you hover only on that % number, and you can see the row count estimate differences in the tooltip for the operator, or in other grids like Top Operations (the function returns a different number of rows now than it did during the demo):
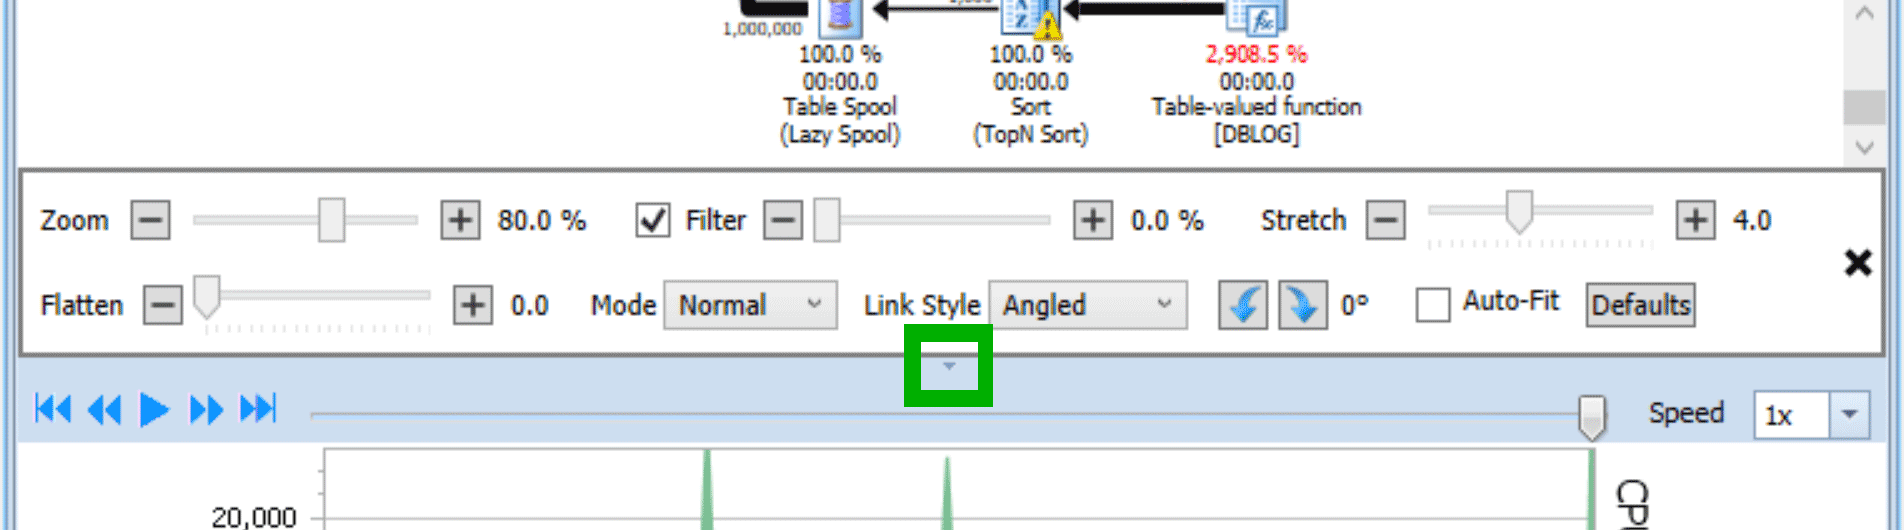
Q: Can you minimize or hide the replay portion to have more real estate for the plan itself?
A: Yes, all of our panels are adjustable; many have a push-pin which toggles between static and auto-hide, most panels can be dragged around (just like in Visual Studio, SSMS, etc.), and the replay panel in particular has a little arrow at top center that allows you to quickly show/hide:
Q: Can you see the offending block of code directly from the plan?
A: I'm not sure if I'm interpreting the question correctly, but all of our panels are context sensitive, and the statement for the plan currently being examined is shown both in the Statement grid and on the Text Data panel:
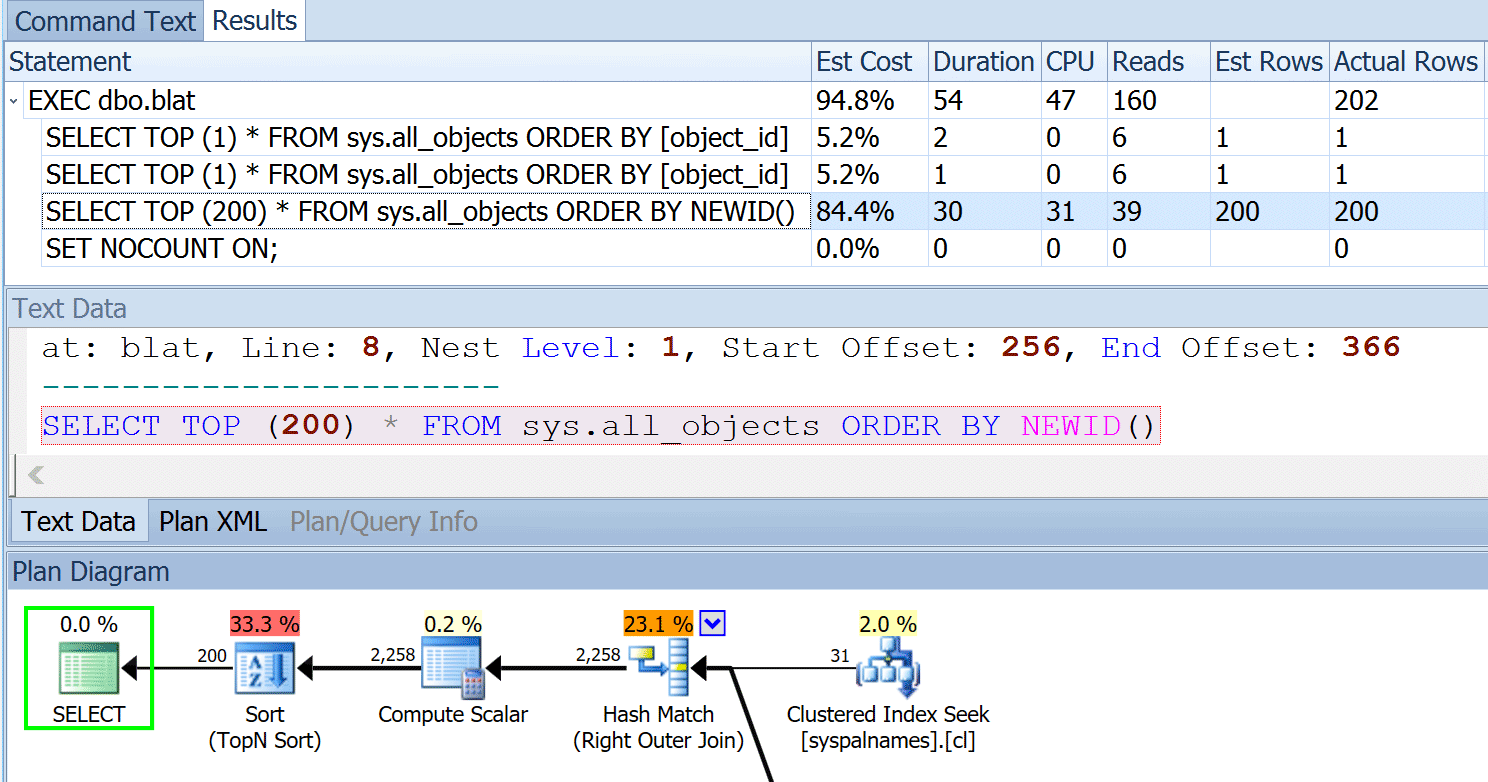
If the statement text isn't fully visible due to length, you can always right-click that cell and choose Copy Statement to Command Text Copy, and then switch to that tab. Or, if you don't wantt o overwrite the current contents of the Command Text tab, choose Copy > Cell and paste into a new session, SSMS, or another editor.
Q: How can I stop a "Get actual plan" if I started a 1-hour-query by mistake?
A: If a query is currently running, there is a Stop button on the status bar, bottom left:

Q: Would not it be better to use DROP_EXISTING = ON instead of dropping an index first and creating a new one?
A: We definitely have plans to make the index scripting more robust in the future, including options like DROP_EXISTING and ONLINE.
Q: Does this tie into SentryOne?
A: All of the functionality in Plan Explorer is also available in the SentryOne Client. You do not technically need to install Plan Explorer if you have the client, except that updates are pushed on a different schedule, so in many cases it may make sense to have both installed.
Keep in mind that plans that we collect for you during monitoring activities are estimated plans, due to the high cost of collecting actual plans for all queries running against a server. This means that if you drill down to a collected plan in the client, it won't have additional information such as Index Analysis and Live Query Profile data. You can always run the query again, interactively, in order to get that additional runtime data.
Q: What is the performance overhead of these new features?
A: Most of the information we collect is no more expensive than if you ran the same queries and collected the same runtime data from Management Studio (e.g. with SHOWPLAN, STATISTICS TIME, and STATISTICS IO on). Much of this is offset, though, by our default behavior of discarding results, so we don't burden the server with the effort of transmitting results to our application.
For extremely complex plans running against databases with very complex schemas and a LOT of indexes, the index and stats collection could be less efficient, but this will be extremely unlikely to cause any noticeable impact on existing workloads. This will not be affected by the number of rows in a table, which was mentioned in one variation of this question.
For really long-running or resource-intensive queries, my biggest concern would be our Live Query Profile collection. We have two preferences that can help with this: whether to include Live Query Profile with all actual plan generation by default, and what interval to collect data from the DMV. While I still feel the overhead of this collection should never come anywhere near the overhead of the query itself, you can tweak these settings to make the collection less aggressive.
That all said, with the disclaimer that everything should be done in moderation, I haven't observed any issues related to the overhead of collecting the data, and would not hesitate to use the full functionality against a production instance.
Q: Is there anything in there for helping build filtered indexes?
A: Currently we don't have any functionality that recommends filtered indexes, but it is definitely on our radar.
Q: Any plans to add a query plan compare feature to Plan Explorer?
A: Yes, this has certainly been on our roadmap since long before this functionality was introduced in SSMS. :-) We're going to take our time and build out a feature set that you've hopefully come to expect from us.
Q: Could you use with SSIS packages to figure out performance of a package?
A: I suppose you could, if you invoke the package or job through T-SQL against a server (Plan Explorer doesn't have the ability to launch things like SSIS packages directly). But the application will only show the performance aspects that are made visible through SQL Server – if there are inefficiencies within the SSIS package that aren't related to execution against SQL Server (say, an infinite loop in a script task), we're not going to be able to pick those up, because we have no visibility and aren't performing any code analysis.
Q: Can you quickly show how to use the deadlock analysis feature?
A: I missed this question during the webinar, but I talk about this functionality in my Demo Kit, Jonathan Kehayias has blogged about it here, Steve Wright has a video about it on YouTube, and the official documentation can be reviewed in the PE User Guide.
Q: Can this be used like Profiler? Can I analyze an entire workload?
A: Plan Explorer is designed to help analyze individual queries and their execution plans. We have a fully-featured monitoring platform for larger scoped efforts, and there are several 3rd party workload analysis tools out there as well.
Q: I'm very new to query tuning – could you suggest tools and articles for deeper understanding?
A: There are a lot of resources for getting better at query tuning:
- Any T-SQL book by Itzik Ben-Gan, Grant Fritchey, or Benjamin Nevarez;
- Any blog post by Paul White or Rob Farley;
- Q & A here on answers.sqlperformance.com or over at dba.stackexchange.com;
- Query tuning videos on YouTube;
- The Demo Kit (with a new version coming soon!); and,
- Practice. Seriously. You can read all the books and articles you want, but without practical, hands-on work troubleshooting and improving problematic queries with real performance issues, it will be tough to become an expert. IMHO.
Summary
Thanks for attending the webinar, and thanks so much for all the great questions. I'm sorry I wasn't able to address them all, but I hope this was helpful nonetheless. If you had a question that I didn't address above, please feel free to ask me directly at abertrand@sentryone.com.