

If you are deploying SQL Server Availability Groups, one of the important aspects of a successful deployment is monitoring the synchronization of the secondary replica databases with the primary replica. There are multiple ways to monitor replica synchronization in an Availability Group, and this post will show each of them and explain their benefits and drawbacks,
One of the easiest ways to monitor the status of an Availability Group, each of the replica servers, and the availability databases, is through the built-in dashboard in Management Studio. However, the default layout of the dashboard doesn't provide a lot of details, and will need to be customized to show additional information about the replica servers as well as the availability databases. Additional columns can be added to the layout through the Add/Remove Columns link on the dashboard, or through the right-click context menu on any of the existing column headers, as shown below:
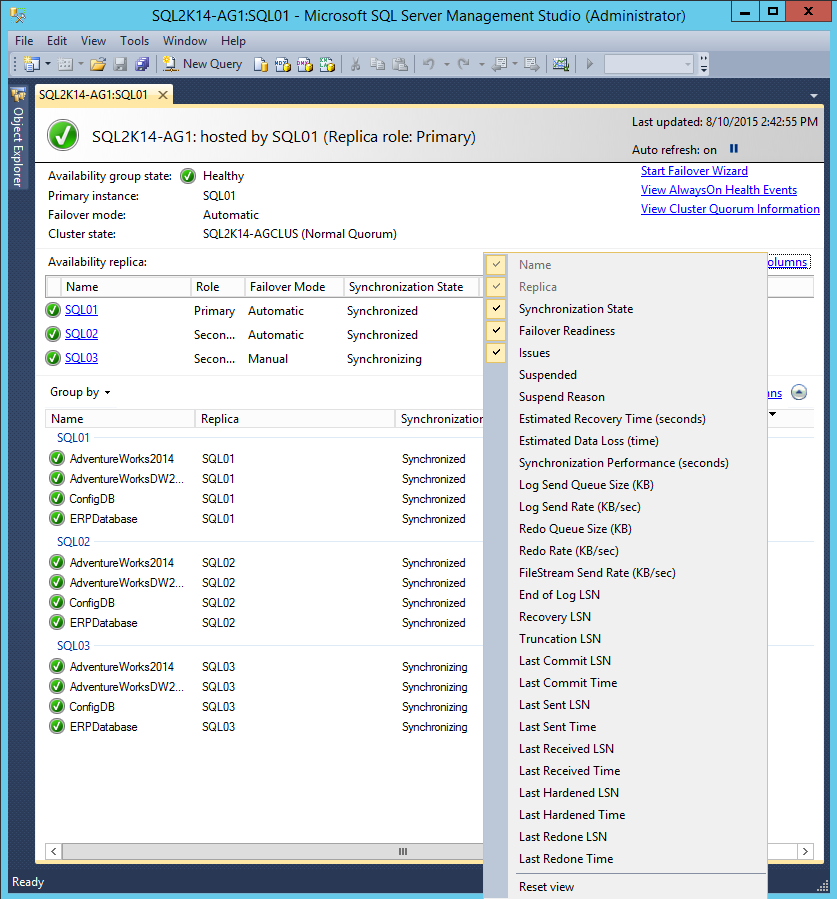 Customizing the AG Dashboard in SSMS
For the availability databases, monitoring the Log Send Queue Size (KB), Log Send Rate (KB/sec), Estimated Data Loss (time), Estimated Recovery Time (seconds), and Synchronization Performance (seconds) will give you a better understanding of how data is flowing to the replicas and the overall health of the availability databases. For example, in the screenshot below, I've modified the VM network configuration for SQL03 so that it has higher latency and lower throughput, which is affecting the synchronization of the databases:
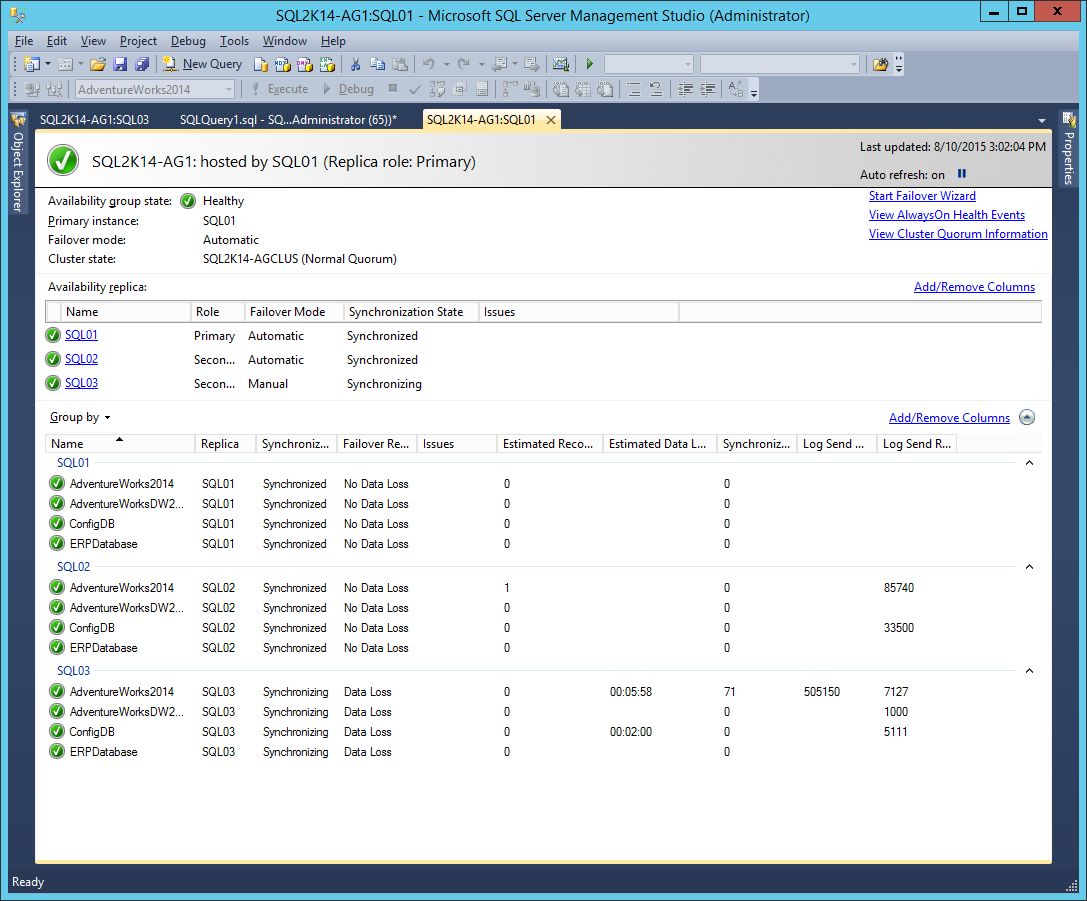
Here we can see that there is nearly six minutes of potential data loss for SQL03, and 505 MB of unsent log that is being sent at a rate of 7 MB/sec to the secondary (which, in this case, is an asynchronous secondary). Whereas SQL02 is currently caught up and has no data loss as a synchronous secondary in the configuration.
An alternative to the Availability Group Dashboard is direct querying of the DMVs, which is where the dashboard pulls its information from as a source. The following query shows the current status and synchronization metrics for each database in an availability group:
SELECT
	ar.replica_server_name,
	adc.database_name,
	ag.name AS ag_name,
	drs.is_local,
	drs.is_primary_replica,
	drs.synchronization_state_desc,
	drs.is_commit_participant,
	drs.synchronization_health_desc,
	drs.recovery_lsn,
	drs.truncation_lsn,
	drs.last_sent_lsn,
	drs.last_sent_time,
	drs.last_received_lsn,
	drs.last_received_time,
	drs.last_hardened_lsn,
	drs.last_hardened_time,
	drs.last_redone_lsn,
	drs.last_redone_time,
	drs.log_send_queue_size,
	drs.log_send_rate,
	drs.redo_queue_size,
	drs.redo_rate,
	drs.filestream_send_rate,
	drs.end_of_log_lsn,
	drs.last_commit_lsn,
	drs.last_commit_time
FROM sys.dm_hadr_database_replica_states AS drs
INNER JOIN sys.availability_databases_cluster AS adc
	ON drs.group_id = adc.group_id AND
	drs.group_database_id = adc.group_database_id
INNER JOIN sys.availability_groups AS ag
	ON ag.group_id = drs.group_id
INNER JOIN sys.availability_replicas AS ar
	ON drs.group_id = ar.group_id AND
	drs.replica_id = ar.replica_id
ORDER BY
	ag.name,
	ar.replica_server_name,
	adc.database_name;
By querying the DMVs directly on the primary replica, it is easy to get up to date information without waiting for the refresh period of the dashboard in Management Studio. This has been useful a few times while consulting with clients that had a link failure between data centers, or where the connectivity was down for maintenance for a duration of time, and the secondary replicas are in the process of catching up once the connection was restored.
The final native tool for monitoring Availability Group synchronization is Performance Monitor, using the SQLServer:Database Replica performance object. The table below shows the relevant performance counters and their descriptions from Books Online (https://msdn.microsoft.com/en-us/library/ff878356(v=sql.110).aspx):
| Counter Name | Description |
|---|---|
| File Bytes Received/sec | Amount of FILESTREAM data received by the secondary replica for the secondary database in the last second. |
| Log Bytes Received/sec | Amount of log records received by the secondary replica for the database in the last second. |
| Log remaining for undo | The amount of log in kilobytes remaining to complete the undo phase. |
| Log Send Queue | Amount of log records in the log files of the primary database, in kilobytes, that has not yet been sent to the secondary replica. This value is sent to the secondary replica from the primary replica. Queue size does not include FILESTREAM files that are sent to a secondary. |
| Recovery Queue | Amount of log records in the log files of the secondary replica that has not yet been redone. |
| Redo blocked/sec | Number of times the redo thread is blocked on locks held by readers of the database. |
| Redo Bytes Remaining | The amount of log in kilobytes remaining to be redone to finish the reverting phase. |
| Redone Bytes/sec | Amount of log records redone on the secondary database in the last second. |
| Total Log requiring undo | Total kilobytes of log that must be undone. |
One of the challenges and limitations of using Performance Monitor to monitor the environment is that the object is valid only on the instance of SQL Server that hosts a secondary replica. This means that you have to add the counters from each secondary replica into Performance Monitor get a full view of what is happening with all of the secondary databases, where both the AG Dashboard in Management Studio, and the DMV query against the primary replica, provide information about all of the secondary databases in a single location.
As an alternative to the built-in features for monitoring Availability Group synchronization, you can also leverage third party tools like SQL Sentry Performance Advisor, which includes monitoring of Availability Groups as a standard feature. You can read more about this feature in this blog post from Greg Gonzalez that first introduced the feature in version 7.5 of the product.
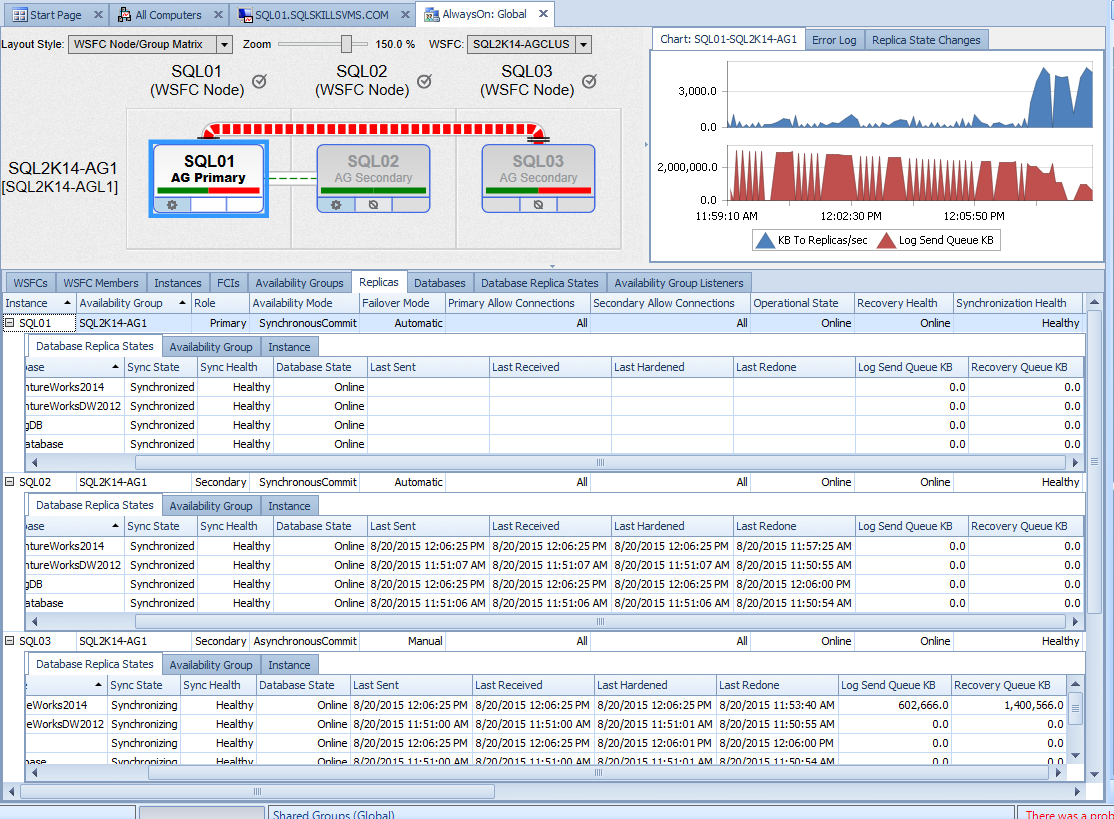 Performacnce Advisor AG Dashboard
The Replicas tab in Performance Advisor allows each of the secondary replica servers to be expanded to show the databases and their current synchronization data easily. The WSFC Node/Group Matrix default layout at the top of the dashboard also gives health information about the primary replica's send queue status, the secondary replica's redo queue status, and the flow of data between each of the replica servers. In this example, we can see that the log send queue on the primary is currently sending a large amount of data from SQL01 to SQL03, based on the width of the line between the servers, after the connectivity issues between SQL01 and SQL03 were corrected in the environment. The chart on the right shows the rate at which data is being transferred from SQL01, along with the current size of the Log Send Queue, since that is the replica selected on the left hand side. Clicking on one of the other replica servers in the WSFC Node/Group Matrix layout will also change the chart to match that specific replica's performance metrics on the right hand side.
There are many ways to monitor the performance of data synchronization between replica servers in an Availability Group in SQL Server. The built-in Availability Group Dashboard in Management Studio contains a wealth of information that is easy to access once you know how to customize the layout to show the most important information on the dashboard. It is also possible to use the DMVs directly from the primary replica server to monitor the performance of data synchronization using Transact-SQL, and third party tools like SQL Sentry include monitoring of the data synchronization as well. While Performance Monitor can provide this same information, the fact that the performance counters are only available from the secondary replica server makes it a little more work to get a full view of the entire environment.


Jonathan,
Maybe you can answer a question I have had for a long time about availability groups. We have been running SQL2012 availability group servers for over 2 years now. The servers started as SP1 builds and have been upgraded to SP2 builds now. We allow our database files to expand with alerts set when an expansion happens. We patch these servers once a month to keep up-to-date with Microsoft security so we have a regular failover. I have noticed that the alert will fire on the primary node to show the database has expanded but the secondary node alert does not fire until we perform a failover. Most of the time the expansion happens when we re-index the databases which happens just before we do our maintenance and the failovers.
Just to confirm that something is getting delayed until the failover we can see a massive spike in transactions per second just when the failover happens.
Do you have any ideas of what is taking place when a failover happens?
Thanks
Chris
Jonathan,
You should mention that query is valid only for SQL Server 2014 and SQL Server 2016.
There is no is_primary_replica column in sys.dm_hadr_database_replica_states table on SQL Server 2012 https://msdn.microsoft.com/en-us/library/ff877972%28v=sql.110%29.aspx
Thanks,
Jakub
You can get the same information from 2012 by joining to the sys.dm_hadr_availability_group_states DMV and checking the primary_replica from there:
SELECT
ar.replica_server_name,
adc.database_name,
ag.name AS ag_name,
drs.is_local,
CASE WHEN hags.primary_replica = ar.replica_server_name THEN 1 ELSE 0 END AS is_primary_replica,
drs.synchronization_state_desc,
drs.is_commit_participant,
drs.synchronization_health_desc,
drs.recovery_lsn,
drs.truncation_lsn,
drs.last_sent_lsn,
drs.last_sent_time,
drs.last_received_lsn,
drs.last_received_time,
drs.last_hardened_lsn,
drs.last_hardened_time,
drs.last_redone_lsn,
drs.last_redone_time,
drs.log_send_queue_size,
drs.log_send_rate,
drs.redo_queue_size,
drs.redo_rate,
drs.filestream_send_rate,
drs.end_of_log_lsn,
drs.last_commit_lsn,
drs.last_commit_time
FROM sys.dm_hadr_database_replica_states AS drs
INNER JOIN sys.availability_databases_cluster AS adc
ON drs.group_id = adc.group_id AND
drs.group_database_id = adc.group_database_id
INNER JOIN sys.availability_groups AS ag
ON ag.group_id = drs.group_id
INNER JOIN sys.availability_replicas AS ar
ON drs.group_id = ar.group_id AND
drs.replica_id = ar.replica_id
INNER JOIN sys.dm_hadr_availability_group_states AS hags
ON hags.group_id = ag.group_id
ORDER BY
ag.name,
ar.replica_server_name,
adc.database_name;
All my current AG setups for demos and teaching are 2014, so I appreciate you pointing out the difference, but it's still easy to work around and get the same information with another DMV joined to the query.
Chris,
It sounds like you are mixing two problems into one question here, one about whether alerts will fire on the secondary, which I don't know the answer to since I don't know how your alerts are configured, and the second for what is happening as you failover the AG for routine maintenance, which I would also need to know a lot more about the configuration and steps being taken to answer.
Here is our set-up describing the first part.
On both nodes we would have an alert called Alloc space used XXX_PROD which is a SQL Server performance condition alert. The Object is SQLServer:Databases, Counter is Data File(s) Size (KB) with Instance XXX_PROD. The condition is Alert if counter rises above with a value just greater than the current allocation. We will see that on the Primary replica this alert will fire if the database file(s) expand. The alert on the secondary only fires when the AG is failed over.
Chris
It fires at the point of the failover, or only when the node is the active Primary replica for a database?
It looks like the moment the node becomes the primary replica for all the databases in the AG.
Chris
Another good way to monitor always on replicas is through policy based management.
Chuck,
What policies do you use for AG's?
Thanks
Chris
Could you speak on, or provide documentation to, information on acceptable values or thresholds for the listed performance counters pertaining to AG's?
How could one trigger a job or procedure to run when the primary replica changes ? I do not want to run the respective jobs at timed intervals, check to see if the host is the primary replica, and then execute / skip. I there anyway to execute an agent job for this action as we do when "Start Automatically when SQL Server Agent Starts" ? I would put a trigger on sys.dm_hadr_database_replica_states when the primary replica value updates, but triggers are not allowed.
You can setup alerts under the SQL Job agent that trigger a job to fire off.
You can either configure the alert to look for errors codes 35264 (Sev 10), 35287 (Sev 16), and 35288 (Sev 16) or setup an alert to look for an event description as '%AlwaysOn%Suspend%'.
Another column I would recommend adding to this query is "drs.redo_queue_size / drs.redo_rate) / 60.0 AS est_redo_completion_time_min". This calculation will provide an estimate on how long it will take for the redo logs to be applied. Great query, Jonathan!
Add this as the first step in your job:
DECLARE @is_prime bit;
Select @is_prime = (select sys.fn_hadr_is_primary_replica ( 'DB_Name' ))
IF @is_prime = 0
BEGIN
PRINT 'EXITING GRACEFULLY';
THROW 51000, 'This is not a primary replica', 1;
END