


In my last post, I started a series to cover proactive health checks that are vital for your SQL Server. We started with disk space, and in this post we’ll discuss maintenance tasks. One of the fundamental responsibilities of a DBA is to ensure that the following maintenance tasks run regularly:
- Backups
- Integrity checks
- Index maintenance
- Statistics updates
My bet is that you already have jobs in place to manage these tasks. And I would also bet that you have notifications configured to email you and your team if a job fails. If both are true, then you’re already being proactive about maintenance. And if you’re not doing both, that’s something to fix right now – as in, stop reading this, download Ola Hallengren’s scripts, schedule them, and make sure you set up notifications. (Another alternative specific to index maintenance, which we also recommend to customers, is SQL Sentry Fragmentation Manager.)
If you don’t know if your jobs are set to email you if they fail, use this query:
SELECT [Name], [Description]
  FROM [dbo].[sysjobs]
  WHERE [enabled] = 1
  AND [notify_level_email] NOT IN (2,3)
  ORDER BY [Name];
However, being proactive about maintenance goes one step further. Beyond just making sure your jobs run, you need to know how long they take. You can use the system tables in msdb to monitor this:
SELECT
  [j].[name] AS [JobName],
  [h].[step_id] AS [StepID],
  [h].[step_name] AS [StepName],
  CONVERT(CHAR(10), CAST(STR([h].[run_date],8, 0) AS DATETIME), 121) AS [RunDate],
  STUFF(STUFF(RIGHT('000000' + CAST ( [h].[run_time] AS VARCHAR(6 ) ) ,6),5,0,':'),3,0,':')
    AS [RunTime],
  (([run_duration]/10000*3600 + ([run_duration]/100)%100*60 + [run_duration]%100 + 31 ) / 60)
    AS [RunDuration_Minutes],
  CASE [h].[run_status]
    WHEN 0 THEN 'Failed'
    WHEN 1 THEN 'Succeeded'
    WHEN 2 THEN 'Retry'
    WHEN 3 THEN 'Cancelled'
    WHEN 4 THEN 'In Progress'
  END AS [ExecutionStatus],
  [h].[message] AS [MessageGenerated]
FROM [msdb].[dbo].[sysjobhistory] [h]
INNER JOIN [msdb].[dbo].[sysjobs] [j]
ON [h].[job_id] = [j].[job_id]
WHERE [j].[name] = 'DatabaseBackup - SYSTEM_DATABASES – FULL'
AND [step_id] = 0
ORDER BY [RunDate];
Or, if you’re using Ola’s scripts and logging information, you can query his CommandLog table:
SELECT [DatabaseName], [CommandType], [StartTime], [EndTime],
  DATEDIFF(MINUTE, [StartTime], [EndTime]) AS [Duration_Minutes]
FROM [master].[dbo].[CommandLog]
WHERE [DatabaseName] = 'AdventureWorks2014'
AND [Command] LIKE 'BACKUP DATABASE%'
ORDER BY [StartTime];
The above script lists backup duration for each full backup for the AdventureWorks2014 database. You can expect that maintenance task durations will slowly increase over time, as databases grow larger. As such, you’re looking for large increases, or unexpected decreases, in duration. For example, I had a client with an average backup duration of less than 30 minutes. All of a sudden, backups starting taking greater than an hour. The database hadn’t changed significantly in size, no settings had changed for the instance or database, nothing had changed with hardware or disk configuration. A few weeks later, backup duration dropped back down to less than half an hour. A month after that, they went up again. We eventually correlated the change in backup duration to failovers between cluster nodes. On one node, the backups took less than half an hour. On the other, they took over an hour. A little investigation into the configuration of the NICs and SAN fabric and we were able to pinpoint the problem.
Understanding the average time of execution for CHECKDB operations is also important. This is something that Paul talks about in our High Availability and Disaster recovery Immersion Event: you must know how long CHECKDB normally takes to run, so that if you find corruption and you run a check on the entire database, you know how long it should take for CHECKDB to complete. When your boss asks, “How much longer until we know the extent of the problem?” you’ll be able to provide a quantitative answer of the minimum amount of time you’ll need to wait. If CHECKDB takes longer than usual, then you know it’s found something (which may not necessarily be corruption; you must always let the check finish).
Now, if you’re managing hundreds of databases, you don’t want to run the above query for every database, or every job. Instead, you might just want to find jobs that fall outside the average duration by a certain percentage, which you can get using this query:
SELECT
  [j].[name] AS [JobName],
  [h].[step_id] AS [StepID],
  [h].[step_name] AS [StepName],
  CONVERT(CHAR(10), CAST(STR([h].[run_date],8, 0) AS DATETIME), 121) AS [RunDate],
  STUFF(STUFF(RIGHT('000000' + CAST ( [h].[run_time] AS VARCHAR(6 ) ) ,6),5,0,':'),3,0,':')
    AS [RunTime],
  (([run_duration]/10000*3600 + ([run_duration]/100)%100*60 + [run_duration]%100 + 31 ) / 60)
    AS [RunDuration_Minutes],
  [avdur].[Avg_RunDuration_Minutes]
FROM [dbo].[sysjobhistory] [h]
INNER JOIN [dbo].[sysjobs] [j]
ON [h].[job_id] = [j].[job_id]
INNER JOIN
(
  SELECT
    [j].[name] AS [JobName],
    AVG((([run_duration]/10000*3600 + ([run_duration]/100)%100*60 + [run_duration]%100 + 31 ) / 60))
      AS [Avg_RunDuration_Minutes]
  FROM [dbo].[sysjobhistory] [h]
  INNER JOIN [dbo].[sysjobs] [j]
  ON [h].[job_id] = [j].[job_id]
  WHERE [step_id] = 0
  AND CONVERT(DATE, RTRIM(h.run_date)) >= DATEADD(DAY, -60, GETDATE())
  GROUP BY [j].[name]
) AS [avdur]
ON [avdur].[JobName] = [j].[name]
WHERE [step_id] = 0
AND (([run_duration]/10000*3600 + ([run_duration]/100)%100*60 + [run_duration]%100 + 31 ) / 60)
    > ([avdur].[Avg_RunDuration_Minutes] + ([avdur].[Avg_RunDuration_Minutes] * .25))
ORDER BY [j].[name], [RunDate];
This query lists jobs that took 25% longer than the average. The query will require some tweaking to provide the specific information you want – some jobs with a small duration (e.g. less than 5 minutes) will show up if they just take a few extra minutes – that might not be a concern. Nevertheless, this query is a good start, and realize there are many ways to find deviations – you could also compare each execution to the previous one and look for jobs that took a certain percentage longer than the previous.
Obviously, job duration is the most logical identifier to use for potential problems – whether it’s a backup job, an integrity check, or the job that removes fragmentation and updates statistics. I have found that the largest variation in duration is typically in the tasks to remove fragmentation and update statistics. Depending on your thresholds for reorg versus rebuild, and the volatility of your data, you may go days with mostly reorgs, then suddenly have a couple index rebuilds kick in for large tables, where those rebuilds completely alter the average duration. You may want to change your thresholds for some indexes, or adjust the fill factor, so that rebuilds occur more often, or less often – depending on the index and the level of fragmentation. To make these adjustments, you need to look at how often each index is rebuilt or reorganized, which you can only do if you’re using Ola’s scripts and logging to the CommandLog table, or if you’ve rolled your own solution and are logging each reorg or rebuild. To look at this using the CommandLog table, you can start by checking to see which indexes are altered most often:
SELECT [DatabaseName], [ObjectName], [IndexName], COUNT(*)
  FROM [master].[dbo].[CommandLog] [c]
  WHERE [DatabaseName] = 'AdventureWorks2014'
  AND [Command] LIKE 'ALTER INDEX%'
  GROUP BY [DatabaseName], [ObjectName], [IndexName]
  ORDER BY COUNT(*) DESC;
From this output, you can start to see which tables (and therefore indexes) have the most volatility, and then determine whether the threshold for reorg versus rebuild needs to be adjusted, or the fill factor modified.
Making Life Easier
Now, there is an easier solution than writing your own queries, as long as you’re using SQL Sentry Event Manager (EM). The tool monitors all Agent jobs set up on an instance, and using the calendar view, you can quickly see which jobs failed, were canceled, or ran longer than usual:
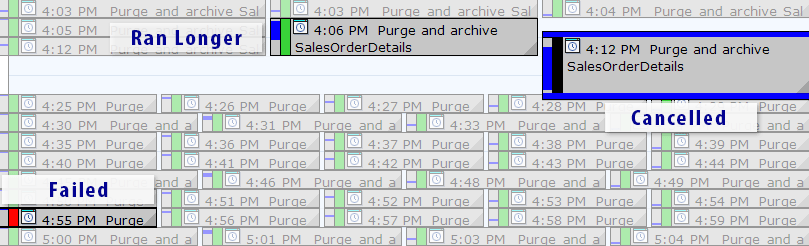 SQL Sentry Event Manager calendar view (with labels added in Photoshop)
You can also drill into individual executions to see how much longer it took a job to run, and there are also handy runtime graphs allowing you to quickly visualize any patterns in duration anomalies or failure conditions. In this case, I can see that around every 15 minutes, the runtime duration for this specific job jumped by almost 400%:
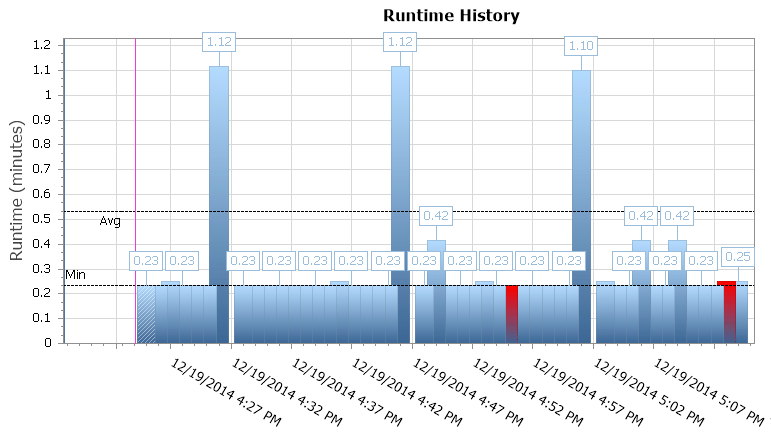 SQL Sentry Event Manager runtime graph
This gives me a clue that I should look into other scheduled jobs that may be causing some concurrency issues here. I could zoom out on the calendar again to see what other jobs are running around the same time, or I might not even need to look to recognize that this is some reporting or backup job that runs against this database.
Summary
I would bet that most of you already have the necessary maintenance jobs in place, and that you also have notifications set up for job failures. If you’re not familiar with average durations for your jobs, then that’s your next step in being proactive. Note: you may also need to check to see how long you’re retaining job history. When looking for deviations in job duration, I prefer to look at a few months’ worth of data, rather than a few weeks. You don’t need to have those run times memorized, but once you’ve verified you’re keeping enough data to have the history to use for research, then start looking for variations on a regular basis. In an ideal scenario, the increased run time can alert you to a potential issue, allowing you to address it before a problem occurs in your production environment.


Thanks! Great article.