
Improved Support for Parallel Statistics Rebuilds
One of the great ways to learn about bugs in SQL Server is to read through the release notes for Cumulative Updates and Service Packs when they come out. However, occasionally this is also a great way to learn about enhancements to SQL Server as well.
Cumulative Update 6 for SQL Server 2014 Service Pack 1 introduced a new trace flag, 7471, that changes the locking behavior of UPDATE STATISTICS tasks in SQL Server (see KB #3156157). In this post we’ll look at the difference in locking behavior and where this trace flag might be useful.
To set up an appropriate demo environment for this post, I used the AdventureWorks2014 database and created an enlarged version SalesOrderDetail table based on the script available on my blog. The SalesOrderDetailEnlarged table was enlarged to 2GB in size so that UPDATE STATISTICS WITH FULLSCAN operations could be executed against different statistics on the table concurrently. I then used sp_whoisactive to examine the locks being held by both sessions.
Behavior without TF 7471
The default behavior of SQL Server requires an exclusive lock (X) on the OBJECT.UPDSTATS resource for the table whenever an UPDATE STATISTICS command is executed against a table. You can see this in the sp_whoisactive output for two concurrent executions of UPDATE STATISTICS WITH FULLSCAN against the Sales.SalesOrderDetailEnlarged table, using different index names for the statistics to update. This results in blocking of the second execution of the UPDATE STATISTICS until the first execution completes.
UPDATE STATISTICS [Sales].[SalesOrderDetailEnlarged]
    ([PK_SalesOrderDetailEnlarged_SalesOrderID_SalesOrderDetailID]) WITH FULLSCAN;
<Object name="SalesOrderDetailEnlarged" schema_name="Sales">
<Locks>
<Lock resource_type="METADATA.INDEXSTATS"
index_name="PK_SalesOrderDetailEnlarged_SalesOrderID_SalesOrderDetailID"
request_mode="Sch-S" request_status="GRANT" request_count="2" />
<Lock resource_type="METADATA.STATS" request_mode="Sch-S" request_status="GRANT" request_count="1" />
<Lock resource_type="OBJECT" request_mode="Sch-S" request_status="GRANT" request_count="2" />
<Lock resource_type="OBJECT.UPDSTATS" request_mode="X" request_status="GRANT" request_count="1" />
</Locks>
</Object>UPDATE STATISTICS [Sales].[SalesOrderDetailEnlarged]
([IX_SalesOrderDetailEnlarged_ProductID]) WITH FULLSCAN;<Object name="SalesOrderDetailEnlarged" schema_name="Sales">
<Locks>
<Lock resource_type="METADATA.INDEXSTATS"
index_name="PK_SalesOrderDetailEnlarged_SalesOrderID_SalesOrderDetailID"
request_mode="Sch-S" request_status="GRANT" request_count="1" />
<Lock resource_type="OBJECT" request_mode="Sch-S" request_status="GRANT" request_count="1" />
<Lock resource_type="OBJECT.UPDSTATS" request_mode="X" request_status="WAIT" request_count="1" />
</Locks>
</Object>The granularity of the lock resource being on OBJECT.UPDSTATS prevents concurrent updates of multiple statistics against the same table. Hardware enhancements in recent years have really changed the potential bottlenecks that are common to SQL Server implementations, and just as changes have been made to DBCC CHECKDB to make it run faster, changing the locking behavior of UPDATE STATISTICS to allow concurrent updates of statistics on the same table can significantly reduce maintenance windows for VLDBs, especially where there is sufficient CPU and I/O subsystem capacity to allow concurrent updates to happen without impacting end-user experiences.
Behavior with TF 7471
The locking behavior with trace flag 7471 enabled changes from requiring an exclusive lock (X) on the OBJECT.UPDSTATS resource to requiring an update lock (U) on the METADATA.STATS resource for the specific statistic that is being updated, which allows concurrent executions of UPDATE STATISTICS on the same table. The output of sp_whoisactive for the same UPDATE STATISTICS WITH FULLCAN commands with the trace flag enabled is shown below:
UPDATE STATISTICS [Sales].[SalesOrderDetailEnlarged]
    ([PK_SalesOrderDetailEnlarged_SalesOrderID_SalesOrderDetailID]) WITH FULLSCAN;
<Object name="SalesOrderDetailEnlarged" schema_name="Sales">
<Locks>
<Lock resource_type="METADATA.INDEXSTATS"
index_name="PK_SalesOrderDetailEnlarged_SalesOrderID_SalesOrderDetailID"
request_mode="Sch-S" request_status="GRANT" request_count="2" />
<Lock resource_type="METADATA.STATS" request_mode="U" request_status="GRANT" request_count="1" />
<Lock resource_type="OBJECT" request_mode="Sch-S" request_status="GRANT" request_count="2" />
</Locks>
</Object>UPDATE STATISTICS [Sales].[SalesOrderDetailEnlarged]
([IX_SalesOrderDetailEnlarged_ProductID]) WITH FULLSCAN;<Objects>
<Object name="SalesOrderDetailEnlarged" schema_name="Sales">
<Locks>
<Lock resource_type="METADATA.INDEXSTATS"
index_name="IX_SalesOrderDetailEnlarged_ProductID"
request_mode="Sch-S" request_status="GRANT" request_count="2" />
<Lock resource_type="METADATA.INDEXSTATS"
index_name="PK_SalesOrderDetailEnlarged_SalesOrderID_SalesOrderDetailID"
request_mode="Sch-S" request_status="GRANT" request_count="2" />
<Lock resource_type="METADATA.STATS" request_mode="U" request_status="GRANT" request_count="1" />
<Lock resource_type="OBJECT" request_mode="Sch-S" request_status="GRANT" request_count="2" />
</Locks>
</Object>For VLDBs, which are becoming much more common place, this can make a big difference in the time it takes to perform statistics updates across a server.
I recently blogged about a parallel maintenance solution for SQL Server using Service Broker and Ola Hallengren’s maintenance scripts as a way to optimize nightly maintenance tasks and reduce the time required to rebuild indexes and update statistics on servers that have plenty of CPU and I/O capacity available. As a part of that solution, I forced an order of queuing tasks to Service Broker to try and avoid having concurrent executions against the same table for both index rebuild/reorganize and UPDATE STATISTICS tasks. The aim of this was to keep the workers as busy as possible until the end of the maintenance tasks, where things would serialize in execution based on blocking of concurrent tasks.
I did some modifications to the processing in that post to just test the effects of this trace flag with concurrent statistics updates only, and the results are below.
Testing Concurrent Statistics Update Performance
To test the performance of only updating statistics in parallel using the Service Broker configuration, I started out by creating a column statistic on every column in the AdventureWorks2014 database using the following script to generate the DDL commands to be executed.
USE [AdventureWorks2014]
GO

SELECT *, 'DROP STATISTICS ' + QUOTENAME(c.TABLE_SCHEMA) + '.'
  + QUOTENAME(c.TABLE_NAME) + '.' + QUOTENAME(c.TABLE_NAME
  + '_' + c.COLUMN_NAME) + ';
GO
CREATE STATISTICS ' +QUOTENAME(c.TABLE_NAME + '_' + c.COLUMN_NAME)
  + ' ON ' + QUOTENAME(c.TABLE_SCHEMA) + '.' + QUOTENAME(c.TABLE_NAME)
  + ' (' +QUOTENAME(c.COLUMN_NAME) + ');' + '
GO'
 FROM INFORMATION_SCHEMA.COLUMNS AS c
INNER JOIN INFORMATION_SCHEMA.TABLES AS t
    ON c.TABLE_CATALOG = t.TABLE_CATALOG AND
       c.TABLE_SCHEMA = t.TABLE_SCHEMA AND
       c.TABLE_NAME = t.TABLE_NAME
WHERE t.TABLE_TYPE = 'BASE TABLE'
 AND c.DATA_TYPE <> N'xml';
This is not something that you would typically want to do, but it gives me plenty of statistics for parallel testing of the impact of the trace flag on updating stats concurrently. Instead of randomizing the order in which I queue the tasks to Service Broker, I instead just queue the tasks as they exist in the CommandLog table based on the ID of the table, simply incrementing the ID by one until all of the commands have been queued for processing.
USE [master];

-- Clear the Command Log
TRUNCATE TABLE [master].[dbo].[CommandLog];

DECLARE @MaxID INT;
SELECT @MaxID = MAX(ID)
FROM master.dbo.CommandLog;

SELECT @MaxID = ISNULL(@MaxID, 1)

---- Load new tasks into the Command Log
EXEC master.dbo.IndexOptimize
  @Databases = N'AdventureWorks2014',
  @FragmentationLow = NULL,
  @FragmentationMedium = NULL,
  @FragmentationHigh = NULL,
  @UpdateStatistics = 'ALL',
  @StatisticsSample = 100,
  @LogToTable = 'Y',
  @Execute = 'N';

DECLARE @NewMaxID INT
SELECT @NewMaxID = MAX(ID)
FROM master.dbo.CommandLog;

USE	msdb;

DECLARE @CurrentID INT = @MaxID
WHILE (@CurrentID <= @NewMaxID)
BEGIN
	-- Begin a conversation and send a request message
	DECLARE @conversation_handle UNIQUEIDENTIFIER;
	DECLARE @message_body XML;

	BEGIN TRANSACTION;

	BEGIN DIALOG @conversation_handle
		 FROM SERVICE [OlaHallengrenMaintenanceTaskService]
		 TO SERVICE N'OlaHallengrenMaintenanceTaskService'
		 ON CONTRACT [OlaHallengrenMaintenanceTaskContract]
		 WITH ENCRYPTION = OFF;

	SELECT @message_body = N'<CommandLogID>'+CAST(@CurrentID AS NVARCHAR)+N'</CommandLogID>';

	SEND ON CONVERSATION @conversation_handle
		 MESSAGE TYPE [OlaHallengrenMaintenanceTaskMessage]
		 (@message_body);

	COMMIT TRANSACTION;

	SET @CurrentID = @CurrentID + 1;
END

WHILE EXISTS (SELECT 1 FROM OlaHallengrenMaintenanceTaskQueue WITH(NOLOCK))
BEGIN
	WAITFOR DELAY '00:00:01.000'
END

WAITFOR DELAY '00:00:06.000'

SELECT DATEDIFF(ms, MIN(StartTime), MAX(EndTime)) FROM master.dbo.CommandLog;
GO 10
Then I waited for all tasks to complete, measured the delta in start time and end time of the task executions, and took the average of ten tests to determine the improvements just for updating statistics concurrently using the default sampling and full scan updates.
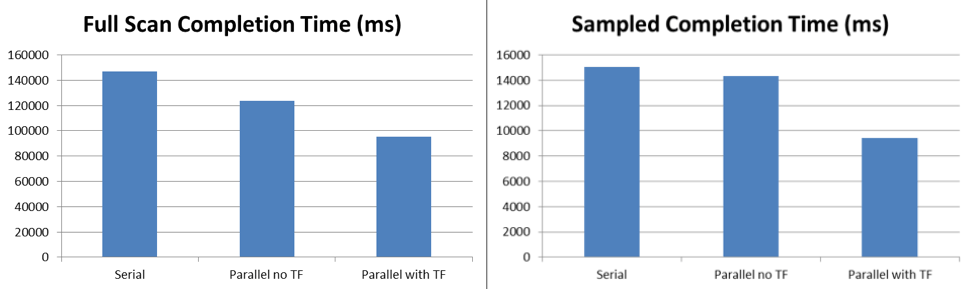
The test results show that even with the blocking that occurs under the default behavior without the trace flag, sampled updates of statistics runs 6% faster and full scan updates run 16% faster with five threads processing the tasks queued to Service Broker. With trace flag 7471 enabled, the same sampled updates of statistics runs 38% faster and full scan updates run 45% faster with five threads processing the tasks queued to Service Broker.
Potential Challenges with TF 7471
As compelling as the test results are, nothing in this world is free and in my initial testing of this I encountered some issues with the size of the VM that I was using on my laptop that created workload problems.
I originally was testing parallel maintenance using a 4vCPU VM with 4GB RAM that I setup specifically for this purpose. As I began to increase the number of MAX_QUEUE_READERS for the activation procedure in Service Broker I began to encounter issues with RESOURCE_SEMAPHORE waits when the trace flag was enabled, allowing parallel updates of statistics on the enlarged tables in my AdventureWorks2014 database due to the memory grant requirements for each of the UPDATE STATISTICS commands that were running. This was alleviated by changing the VM configuration to 16GB RAM but this is something to monitor and watch for when performing parallel tasks on larger tables, to include index maintenance, since memory grant starvation will also affect end user requests that may be trying to execute and need a larger memory grant as well.
The product team has also blogged about this trace flag and in their post they warn that deadlock scenarios may occur during concurrent updating of statistics while statistics are also being created. This is not something I have run into yet during my testing, but it is definitely something to be aware of (Kendra Little warns about it too). As a result of that, their recommendation is that this trace flag only is enabled during parallel maintenance task execution and then it should be disabled for normal workload periods.
Enjoy!
3 thoughts on “Improved Support for Parallel Statistics Rebuilds”
Comments are closed.

Thanks for the idea packed article. I now need to try out service broker, your example is a great starter, using Hallengren's command table as a "to do" work list, looking at the lock info from sp_whoisactive, the new SQL 2014 TF feature.
Nice explanation of a potentially useful new feature, Jonathan. For sampled stats, if resource usage or deadlocks become an issue, or you want to update statistics on large tables an order of magnitude faster, then this is possible with a little coding effort – simply collect the sample once for all relevant columns rather than once per stats object, generate stats using full scan across the small sample, and then write the stats back to the original table. We've been able to do this since 2008R2, and I've implemented this approach on data warehouses with dramatic results.
Why don't MS just support update statistics * on [Table] (maxdop N),, do it in one table scan (or multiple if MAXDOP > 1) and be done with it?