Over three years ago now, I posted about a fix to Plan Explorer regarding bad cardinality estimates that SQL Server's Showplan XML was producing, in the case of key/RID lookups with a filter predicate in SQL Server 2008 and above. I thought it would be interesting to look back and go into a little more detail about one of these plans and the iterations that we went through to ensure we were displaying correct metrics, regardless of what Management Studio shows. Again, this work was largely done by Brooke Philpott (@MacroMullet) and Greg Gonzalez (@SQLsensei) and with great input from Paul White (@SQL_Kiwi).
This is quite similar to the query I presented in my earlier post, which came from Paul (and which would take some work to reproduce exactly in modern versions of AdventureWorks, where at the very least transaction dates have changed):
SELECT
    th.ProductID,
    p.Name,
    th.TransactionID,
    th.TransactionDate
FROM Production.Product AS p
JOIN Production.TransactionHistory AS th ON
    th.ProductID = p.ProductID
WHERE
    p.ProductID IN (1, 2)
    AND th.TransactionDate BETWEEN '20070901' AND '20071231';
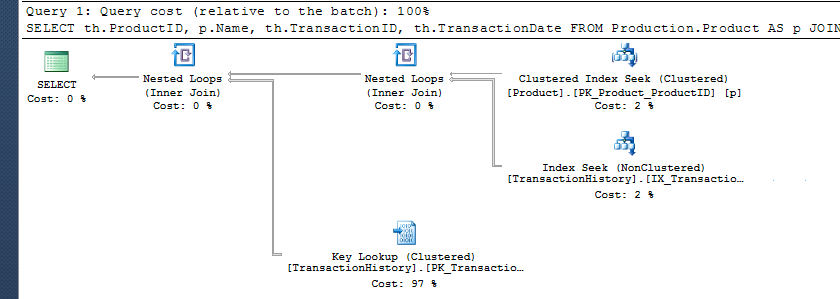
The plan from Management Studio looked correct enough:
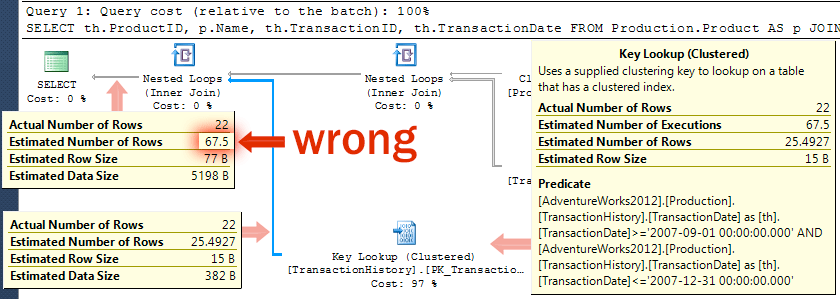
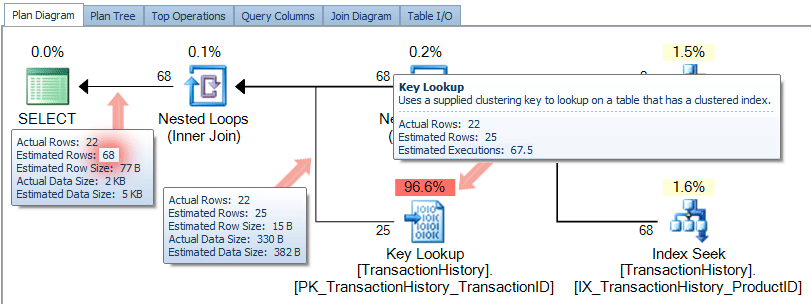
However, if you look closer, it seems that the ShowPlan has pushed the estimated number of executions from the key lookup straight over to the estimated number of rows for the final exchange:
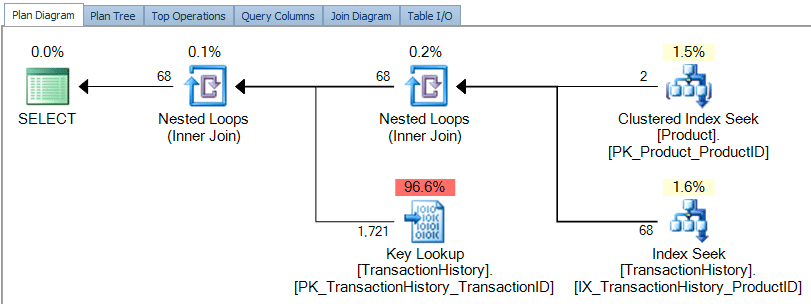
On first glance, the graphical plan diagram in Plan Explorer looks quite similar to the plan that SSMS produces:
Now, in the process of developing Plan Explorer, we have discovered several cases where ShowPlan doesn't quite get its math correct. The most obvious example is percentages adding up to over 100%; we get this right in cases where SSMS is ridiculously off (I see this less often today than I used to, but it still happens).
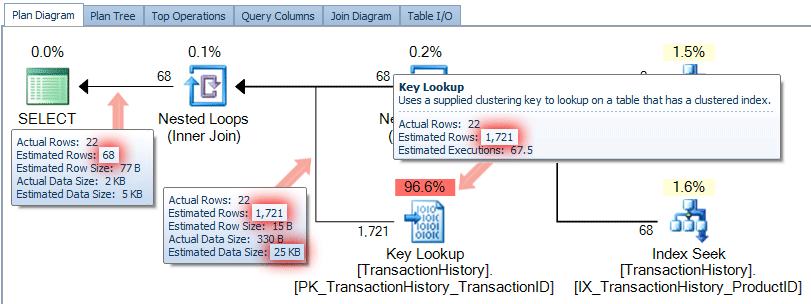
Another case is where, starting in SQL Server 2008, SSMS started putting total estimated rows instead of rows per execution along with lookups, but only in cases where a predicate is pushed to the lookup (such as the case in this bug reported by Paul, and this more recent observation by Joey D'Antoni). In earlier versions of SQL Server (and with functions and spools), we would typically show estimated row counts coming out of a lookup by multiplying the estimated rows per execution (usually 1) by the estimated number of rows according to SSMS. But with this change, we would be over-counting, since the operator is now already doing that math. So, in earlier versions of Plan Explorer, against 2008+, you would see these details in the tooltips, connector lines, or in the various grids:
(Where does 1,721 come from? 67.5 estimated executions x 25.4927 estimated rows.)
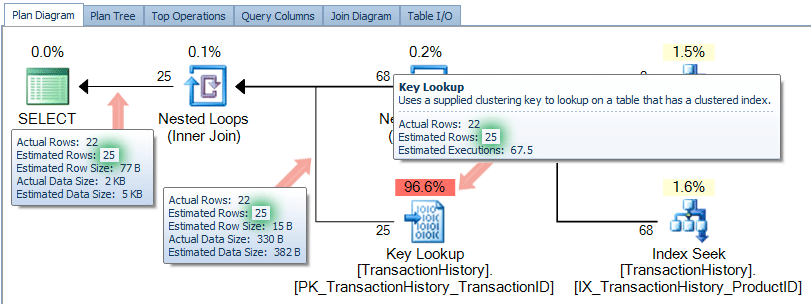
Back in 2012, we fixed part of this issue by not performing this mathematical operation any longer, and relying solely on the estimated row counts coming out of the key lookup. This was almost correct, but we were still relying on the estimated row count ShowPlan was providing us for the final exchange:
We quickly addressed this issue as well, in version 7.2.42.0 (released on Hallowe'en 2012), and now feel we are providing information that is much more accurate than Management Studio (though we will keep an eye on this bug from Paul):
This clearly happened a long time ago, but I still thought it would be interesting to share. We continue to make enhancements to Plan Explorer to provide you with the most accurate information possible, and I will be sharing a few more of these nuggets in upcoming posts.




Does this behavior extend to cases without Key Lookup operations? We're experiencing a similar situation but with only Nested Loop operations: the first loop has a top input of 1.5 estimated rows and a bottom input of around 3,000 estimated rows. This results in around 4,500 output estimated rows, which are also the top input for the second Nested Loop operation. The bottom input has an estimated number of rows of 16 and is expected to be executed 4,500 times.
To me this should result in 4,500 * 16 = around output 72,000 rows, but in actuality the estimated number of output rows of the second Nested Loop is 6.1 million rows (vs 28 actual rows!!!). This has the negative effect of claiming too much memory. Link to SQL Sentry Plan Explorer here: http://share.pho.to/A4NXA
Other than this article, I cannot find any reason why the estimated output rows of a nested loop is higher than the top input times the bottom input. Our server is running SQL server version 11.0.3000.0.
Sure, a key lookup is not required for this symptom to occur. Joey D'Antoni talked about a similar case here, where it was a spool feeding in to a nested loop join that caused the issue:
https://joeydantoni.com/2016/02/03/using-sql-sentry-plan-explorer-to-shed-light-on-estimated-execution-plans/
Thanks for your reply! It turned out the estimated number of rows (16) was correct, but the EQ_ROWS and other statistics columns were way off. After an UPDATE STATISTICS command with the FULLSCAN option the EQ_ROWS were back to normal again and so was the execution plan.
I'm still in the dark about the reason for this (and if it has anything to do with the bug), but at least the problem is fixed.