Being a database administrator can be very challenging at times when you have to troubleshoot performance issues. The database server is just one component of the application ecosystem and it routinely gets blamed as being the performance problem. SQL Server is one of those black boxes that many don’t understand, much like the SAN and network. Production DBAs that monitor their servers can quickly identify if SQL Server is performing outside of its normal baseline, however there are two major areas that we have little visibility into: the SAN and the network. DBAs regularly have to work with other engineers when it comes to troubleshooting performance issues that are not directly related to SQL Server. We can easily track disk performance by monitoring sys.dm_io_virtual_file_stats, which I wrote about in Monitoring Read/Write Latency; however, tracking network performance problems within SQL Server isn’t as easy.
Poor network performance can be a silent killer for application performance and my personal experience has shown this to be the case on many occasions. Often an application would start having performance issues and the application engineer would say that the application server looks good and starts to point their finger at the database. I would get a call to look at the database server and all indications showed that the database server was in good health (and this is where monitoring for key performance indicators and having a baseline helps!). Since the application and database teams were saying everything was good, we would ask the network team to check things out. The network team would look at a few things and give the all clear on their side as well. Each team troubleshooting and reviewing their respective systems took time, meanwhile the application performance was still suffering. The issue would then get escalated until all the teams would be asked to join a conference bridge to troubleshoot together. Eventually someone would start a deeper network test and determine that we either had a port saturation, routing, or some other complex networking issue. A few clicks or changing something on their end would eventually resolve the application slowness.
The most significant networking issue that I have encountered with clients typically involves bandwidth when performing backups. Many larger organizations are migrating to 10Gb networking for core infrastructure, however when working with both physical and virtual networking, it is easy to misconfigure a setting or port and have it drop to 1Gb. For regular application network traffic you may not notice the degradation in performance, however as soon as you start trying to copy 100s of GB of data for backups, that 1Gb will become saturated and your backup and restore jobs will suffer.
For DBAs it can be challenging to get others to look that deep into problems that they don’t think are their issue because initial indicators don’t reveal the problem. Being able to arm yourself with data before reaching out to other teams will help to get them involved. By using iPerf to do an initial bandwidth test, you can quickly determine if you are getting the network speeds that you are supposed to. For example, if you are utilizing 10Gb network between the application server and database server and you run a test and are only getting 1Gb, then you know something is not quite right. If you can document this finding, then you can with confidence ask your network engineers to look into a bandwidth issue.
How do you get started using iPerf? First you need to download the tool from iPerf.fr. Since I am working on Windows Server 2012, I’ve downloaded the Windows binaries onto my machine. Once you download and unzip the package, you will need to run the program from a command line. I downloaded iPerf 3.0.11 which has been out for almost a year. Make sure to read the documentation of this utility. Since this is a command line tool, there are dozens of options that you can use. In the example below I will only be using a few of them, however depending on your situation, you may need to use other options such as specifying the port or increasing the packet size. Please note that the option commands are case sensitive.
To use iPerf, you have to use at least two servers to test the bandwidth. Once you have copied the binaries to the two servers, you have to first start the iPerf listener on one of the servers. To do this I will run the following command:
This command runs iPerf in server mode and will only allow one connection at a time.
On the second server you will need to launch iPerf using several client options. First we are going to specify -c to specify client mode. We will also use -t to specify the time to run each test and -P to specify the number of simultaneous connections to make. We want to specify multiple connections so that we can put a proper strain on the network. For this test I am going to run the following command:
The command above will start a 30 second transmission test with 10 simultaneous connections.
I ran this test on two virtual machines on my Dell M6800 so there wasn’t a physical network for these VM’s to go through.
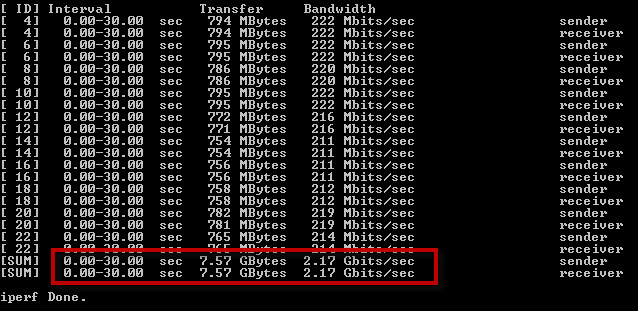
From server 2 connecting to server 1 I got 7.57 GBytes transferred with a bandwidth of 2.17 Gbits/sec. Not bad for a couple of VMs on a laptop.
 Network stats / iPerf output : Server 2 connecting to Server 1
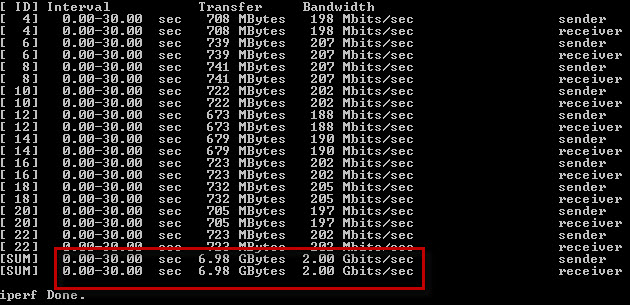
From server 1 connecting to server 2 I got 6.98 GBytes transferred with a bandwidth of 2.00 Gbits/sec. As you can see there is a slight difference in the numbers but still relatively close. Had these numbers been drastically different then I would need to investigate the cause.
 Network stats / iPerf output : Server 1 connecting to Server 2
It is important to run these tests before going into production and to make a habit of regularly repeating these tests on your production servers. You need to know what is normal, if you aren’t monitoring it, then you can’t measure it. If you know that firmware updates are being performed on your servers, the virtual host, or any core networking equipment, an iPerf test before and after the changes could quickly alert you to identify any negative side effects.
It is also important to perform this test against any servers that interface directly with the database server and any servers the database server directly interfaces with such as network backup devices. IPerf works on both Windows and Linux making it easy to test between the two Operating Systems.
For DBAs, the network no longer has to be a black box that you don’t know anything about. Using iPerf can alert you to any bandwidth issues with the network between your database server and any other server. There is no reason to only rely on PING and TRACERT for limited network troubleshooting. Download iPerf and start documenting your network bandwidth.


Windows 2008 R2 DC Sp1 Bugcheck 27 running iperf
Cool eh?
Thanks a lot Tim, it's very helpful post.
Hi Tim,
Does this takes into consideration of multiple NIC in the server? How that works?
Thank you,
HP
To answer your question you would need to talk able how you have teaming on those nics implimented. If you test with 1 connection you will only get a partial picture and will probably be testing one NIC. If you use -P to specify the number of simultaneous connections to make you can be sure to truely flood all pipes and because they are seperate connections/sessions it should cause your nic teaming to be used. Once I couldn't verify the bandwidth on a WAN link until I realized the border router was limiting each session. Once I used -P and started multiple connections/sessions I got an accurate result.
Thank you Rob. I did tried with -P range from 10 – 60 connections for 30 seconds, should that give me correct result? I did on the server which showed 4 different NIC under TaskManager–>Network section and 1 NIC was getting utilized (i.e. peaking high) when I was running the test.
Really depends on how you have the NICs teamed/load balanced. The way I do it 4 NICs show up as 1. Talking about server 2012 r2 using the Microsoft Multiplexor Driver. I seem to remember back when I used the Broadcom teaming software it was the same but you also had many more options relating the teaming and load balancing.
Gotcha. Once last question, using SSIS if I am sending data from Server1 to Server 2 and if I wanted to check NIC throughput between both the servers, I would have to make Server2 as listener (i.e. with iperf3 -s) and Server1 would be where I would run the connection command (i.e. iperf3 -c Server1 -t 30 -P 10), correct?
@Hiren
That is correct,
Awhile back I got a couple of appneta boxes and run what they call pathview which I use to monitor my wan links. I highly recommend this. If you are a roll your own kind of guy, I used to use iperf coupled with nagios to test and collect bandwidth stats but replaced that with pathview.
https://www.appneta.com/products/pathview/
Thank you Rob for all the information you provided. Thank you Tim for really nice article, it is very useful and informative.