


One of the most common performance bottlenecks that I see as a consultant is inadequate storage subsystem performance. There are a number of reasons for poor storage performance, but measuring it and understanding what needs to be measured and monitored is always a useful exercise.
There are actually three main metrics that are most important when it comes to measuring I/O subsystem performance:
Latency
The first metric is latency, which is simply the time that it takes an I/O to complete. This is often called response time or service time. The measurement starts when the operating system sends a request to the drive (or the disk controller) and ends when the drive finishes processing the request. Reads are complete when the operating system receives the data, while writes are complete when the drive informs the operating system that it has received the data.
For writes, the data may still be in a DRAM cache on the drive or disk controller, depending on your caching policy and hardware. Write-back caching is much faster than write-through caching, but it requires a battery backup for the disk controller. For SQL Server usage, you want to make sure you are using write-back caching rather than write-through caching if at all possible. You also want to make sure your hardware disk cache is actually enabled, since some vendor disk management tools disable it by default.
Input/Output Operations per Second (IOPS)
The second metric is Input/Output Operations per Second (IOPS). This metric is directly related to latency. For example, a constant latency of 1ms means that a drive can process 1,000 IOs per second with a queue depth of 1. As more IOs are added to the queue, latency will increase. One of the key advantages of flash storage is that it can read/write to multiple NAND channels in parallel, along with the fact that there are no electro-mechanical moving parts to slow disk access down. IOPS actually equals queue depth divided by the latency, and IOPS by itself does not consider the transfer size for an individual disk transfer. You can translate IOPS to MB/sec and MB/sec to latency as long as you know the queue depth and transfer size.
Sequential Throughput
Sequential throughput is the rate that you can transfer data, typically measured in megabytes per second (MB/sec) or gigabytes per second (GB/sec). Your sequential throughput metric in MB/sec equals the IOPS times the transfer size. For example, 556 MB/sec equals 135,759 IOPS times a 4096 bytes transfer size, while 135,759 IOPS times a 8192 bytes transfer size would be 1112 MB/sec of sequential throughput. Despite its everyday importance to SQL Server, sequential disk throughput often gets short-changed in enterprise storage, both by storage vendors and by storage administrators. It is also actually fairly common to see the actual magnetic disks in a direct attached storage (DAS) enclosure or a storage area network (SAN) device be so busy that they cannot deliver their full rated sequential throughput.
Sequential throughput is critical for many common database server activities, including full database backups and restores, index creation and rebuilds, and large data warehouse-type sequential read scans (when your data does not fit into the SQL Server buffer pool). One performance goal I like to shoot for on new database server builds is to have at least 1GB/sec of sequential throughput for every single drive letter or mount point. Having this level of performance (or better) makes your life so much easier as a database professional. It makes so many of your common database chores so much faster, and it also gives you the freedom to do more frequent index tuning when you can create an index on a large table in seconds or minutes instead of hours.
SQL Server I/O Workload Metrics
When it comes to SQL Server and I/O performance, there are a number of things that you should measure and monitor over time. You should know the read vs. write ratio for your workload for all of your user database files and for tempdb. The ratios will be different for different SQL Server file types and workloads. You can use my DMV Diagnostic Queries to determine this, and you can also use the Disk Activity View in SQL Sentry Performance Advisor to easily get a more complete view of your disk activity, from a high-level, overall picture, all the way down to individual files:
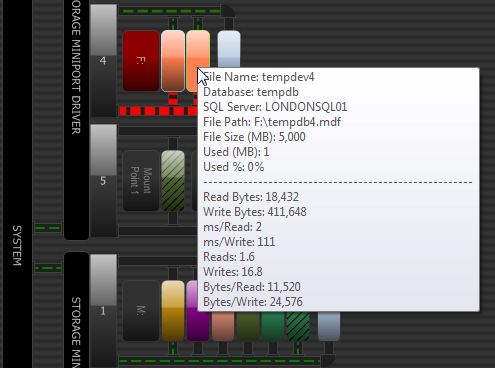 SQL Sentry Performance Advisor : Disk Activity
You should also measure the typical I/O rates for IOPS and sequential throughput. In Windows Performance Monitor (PerfMon), reads/sec and writes/sec show IOPS, while disk read bytes/sec and disk write bytes/sec represent sequential throughput. You should use PerfMon to measure average disk sec/read and average disk sec/write, which is read and write latency at the disk level. Finally, you can use my DMV Diagnostic Queries to measure the average file-level read and write latency for all of your user database files as well as for tempdb.
Methods for Measuring I/O Performance
You can use the Disk section in Windows Resource Monitor to get a quick, real-time view of some key disk metrics for all of your SQL Server database files. Going deeper, you can use PerfMon to measure and monitor the critical performance counters that I have previously mentioned. Before you go into production with a new database server, you should do some disk benchmark testing to determine what kind of performance your I/O subsystem can actually deliver. This is actually not that difficult or time consuming (if you use the right tools), but it often gets forgotten when a new database server is provisioned and tested.
The first disk benchmark you should always run is CrystalDiskMark 4.0, which has recently been rewritten to use the relatively new Microsoft DiskSpd disk benchmark program. The CDM 4.0 user-interface lets you choose a wider range of test-file sizes and it also lets you choose the queue depth and number of threads for the test runs. This lets you get a more server-like I/O workload and it also lets you more properly stress newer NVMe flash-storage devices that can handle queue depths higher than 32.
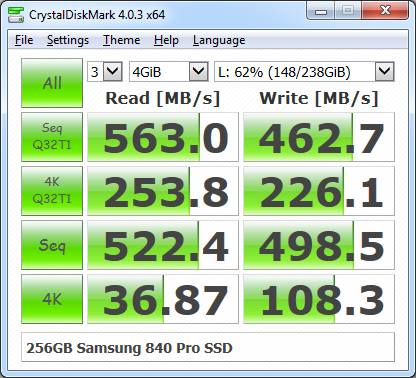 CrystalDiskMark 4.03 Results with QD = 32 and threads = 1
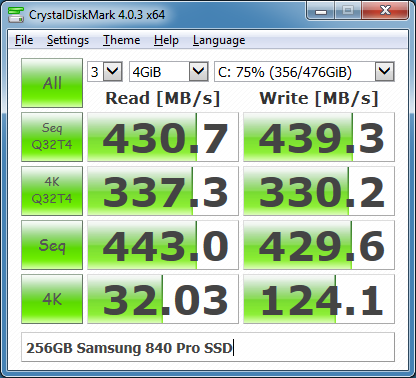 Figure 2: CrystalDiskMark 4.03 Results with QD = 32 and threads = 4
Unlike previous versions of CDM, the two most relevant rows for SQL Server usage are in the middle of the results display. They are the 4K random reads and writes with a high queue depth (32 by default), and the sequential reads and writes. After you do some storage benchmark tests with CrystalDiskMark 4.0, you should do some more exhaustive testing with Microsoft DiskSpd. In a future article, I will cover how to use DiskSpd to do more complete testing for SQL Server.


Glen,
Your posts about testing storage are valuable. Can't wait for the next one about DiskSpd!
Just wanted to say Thank you!
Best,
Mark
Thanks for the article. Nice basic treatment of disk i/o.
Unfortunately, it has almost nothing SQL-Server specific in it: how to discover i/o bottlenecks in your processes, and how to resolve them.
Also, two suggestions are made: 1) make sure write-back caching is enabled, and 2) making sure the hardware disk cache is enabled, but no explanation is provided on how to determine those things.
Hopefully some of these items will be addressed in the sequel.
Some more comments about your suggestion to enable disk caching:
https://support.microsoft.com/en-us/kb/234656
"Disk caching should be disabled in order to use the drive with SQL Server."
"Your SQL Server installation depends on the controller's ability to disable the on-disk cache and to provide a stable I/O cache. "
"To fully secure your data, you should ensure that all data caching is properly handled. In many situations, this means you must disable the write caching of the disk drive. "
Dave,
Thanks for your comments! I think I did cover quite a bit of SQL Server-specific information, especially, for a short introductory article. There are links to resources such as my DMV Diagnostic queries, that have a number of specific queries that you can use to measure I/O performance from a SQL Server perspective, along with comments about how to interpret the results.
I am talking about hardware RAID controller or SAN-level disk caching, not individual disk caching. These will have battery backups for enterprise-level equipment. Typically, you have to use vendor-specific management tools to check on and change the caching policy for something like a hardware RAID controller.
The Microsoft KB article that you reference (https://support.microsoft.com/en-us/kb/234656) is mainly talking about the small (16MB-64MB) DRAM caches found on individual magnetic drives in consumer desktop equipment, not enterprise-lever servers.
Nice article!!!
I know CrystalDiskMark is a free tool.
Is "Disk Activity View in SQL Sentry Performance Advisor" is free too?
No, sorry, Performance Advisor is paid software: https://sentryone.com/platform/sql-server-performance-monitoring
Hi Glenn,
If an organisation use a hosting service and/or 'private hosted clouds' they may not have access to all performance counters. In situations like this, 'synthetic transactions' may offer some value? Submit a specific, precise workload, 10 seconds (average duration), worth once every 10 minutes, and capture each duration. Over a long period, variations in duration might point to IO subsystem stress. https://paulbrewer.wordpress.com/2015/07/19/sql-server-performance-synthetic-transaction-baseline/
Regards
Paul
Paul,
I don't really like the idea of regularly generating any tangible extra I/O activity just for measurement and monitoring purposes. There are several I/O specific queries in my DMV Diagnostic information query script that can be used to capture historical and trending I/O performance without having to run an extra workload.
I use your DMV diagnostic queries all the time and think they are great. There are a few issues with using them for longer term trend analysis though:
– Virtual IO and other Stats are obviously cleared each time SQL is restarted. You can capture and record them at intervals but (and this is a big but) you are never really comparing like for like. Different queries running on different servers at different times using different data/plans, with different levels of concurrent back ground activity are difficult to compare.
– The stats can be skewed by unusual workload patterns, overnight 'batch settlement' type work scanning large tables in an OLTP environment for example.
I obviously agree that unnecessary workloads are not a good thing, from a DBA perspective though a 5 second single threaded test of IO and CPU once every 10 minutes might be worth the cost. It's almost insignificant but the insights it would provide might be valuable. An unambigous, discreet x microseconds execution time for the same IO or CPU workload on SQL Server y at time interval z.
Thanks
Paul
Can I have the good benchmark we can shoot for on I/O rates when doing a SQL backup to disk/SAN/UNC?
"For example, a constant latency of 1ms means that a drive can process 1,000 IOs per second with a queue depth of 1", what is a queue?